
This study highlights a procedure in which 15 trained normal-hearing assessors evaluated the sound quality of three premium hearing aids in their default prescriptions using two types of hearing loss.
A number of studies have shown a positive correlation between hearing aid satisfaction and the sound quality of hearing aids.1,2 Developing hearing aids with good sound quality requires a valid and reliable method to evaluate the hearing aids.
Sound quality is fundamentally a subjective quantity. Evaluating sound quality is therefore an exercise in getting data that are representative of some subpopulation or an entire population. It also involves designing studies involving people with hearing impairment and situations relevant to everyday life with respect to the quality of sound.
Sound quality evaluations are often performed via questionnaires like the Speech, Spatial, and Qualities of Hearing (SSQ) scale.3 Questionnaires have the benefit of assessing situations that are relevant for the individual test subjects; however, the results can be more difficult to reproduce, as individual test subjects may rate their hearing differently in various environments.

This article was submitted to HR by Christian Stender Simonsen, MScEE, a development engineer at Oticon A/S in Smørum, Denmark, and Søren Vase Legarth, MScEE, an engineer at DELTA SenseLab, in Hørsholm, Denmark. Correspondence can be addressed to HR or Christian Stender Simonsen at .
In contrast, testing sound quality in a laboratory setting has somewhat opposite strengths and weaknesses; it is extremely difficult to make laboratory tests that approximate reality. It is also difficult to select situations that represent the entire range of environments a test subject would use to evaluate sound quality.
Despite these limitations, laboratory settings for testing sound quality do provide for common environments. It also allows for easy reproduction of the test method. Since this study was aimed at getting results with as little variability as possible and to ease interpretation, we used laboratory testing to reproduce sound quality ratings across different environments.
Using normal-hearing test subjects to evaluate hearing aids. It may be hypothesized that, as a group, people with hearing impairment are much more heterogeneous in terms of perceived sound quality than people with normal hearing. If we were to evaluate the sound quality of hearing aids, it would seem obvious to use test subjects with hearing impairment to do the evaluation. This would leave us with the question of finding ways to dissect and categorize test subjects into homogenous groups.
However, if we use normal-hearing subjects, we do not have to deal with this hearing loss categorization, yielding sound quality data with less error variance. Using a trained expert panel will further reduce this error variance.4 A panel of normal-hearing subjects also provides true first-time users of hearing aids who are completely unbiased by previous hearing aid experiences.
DELTA SenseLab is an independent Danish company specializing in human perception of all senses and evaluating products based on perception. They have a trained expert listening panel that has been used in this study to evaluate sound quality of hearing aids. By using their listening panel, we reduce error variance in the results and also get first-time user data from an independent institution.
Methods
The main aim of this study was to get an independent sound quality evaluation of Oticon Epoq against two competing premium products for a group of first-time users. Moreover, the study aimed at finding an efficient method to evaluate sound quality of hearing aids.
Listening panel. A total of 15 subjects/assessors were selected from DELTA SenseLab’s expert listening panel: 13 males and 2 females ages 22 to 48 (average age = 31 years). The assessors were all native Danish speakers with normal hearing measured according to ISO 8253-1.5
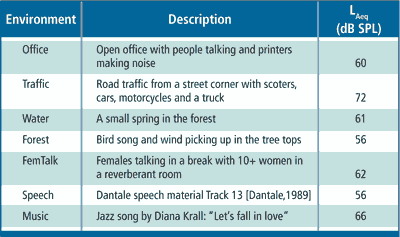
TABLE 1. The seven environments and their presentation levels.
Sound environments. Table 1 lists the 7 sound environments and presentation levels used during recordings and playback. The presentation levels were set to match criteria of natural environment levels. Each recording was post-processed to remove low frequency noise (below 20 Hz) and to compensate for the frequency response of the Sennheiser HD 650 headphones that were used during playback.
The environments were selected based on their ability to expose certain characteristics of sound quality. For example, the water environment might introduce spurious effects due to compression dynamics, while the almost stationary noise in the forest environment might expose comb filter effects (eg, a group delay of sound processed by the hearing aid compared to the direct sound coming through the vent). Speech, females talking, and office environments all represent important everyday listening situations, whereas music is an example of an environment where good sound quality might be at an absolute premium. On the other hand, the traffic environment represents a situation where one needs to be alert to sounds but the sound might not necessarily be enjoyable; thus, sound quality in this environment also involves evaluating the noise reduction scheme of the device.
Hearing losses. Two hearing losses (Figure 1) were used in the evaluation: “N2” and “N3” as described in the standard draft IEC 60118-15 (2008).6 N2 is a mild hearing loss, and N3 a moderately sloping hearing loss. The hearing aids were programmed by choosing default prescribed settings for N2 and N3 for each of the hearing aids. This was done to make sure the situation would correspond to a first-time user fitting, and also to simplify comparisons across products.
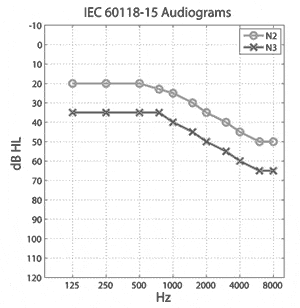
FIGURE 1. N2 and N3 hearing losses from IEC 60118-15 draft used in this study.
Hearing aids and test anchor. Besides Oticon Epoq, two premium instruments from two competitive manufacturers were selected for the study. They were chosen based on market feedback that they were among the top hearing aids relative to sound quality. Since two hearing losses were used to program each instrument and the test panel also had to rate an anchor and a reference, it was decided not to include more products.
The receiver-in-the-ear (RITE) style was selected for all products due to the appeal it has to first-time users, its minimal occlusion effect, and the smooth frequency response.7 For both the mild (N2) and the moderately sloping (N3) prescriptions, domes were selected based on the fitting software recommendation, resulting in the most open dome from each manufacturer for the N2 prescription and a more closed dome for the N3 prescription.
Although details of the procedure are described later, this study required an anchor: a product that is preferably inferior to the tested instruments relative to sound quality. For the anchor, we selected an older Oticon mid-range device, Oticon Tego, in a BTE thin-tube style to approximate the RITE style of the three test devices. There were two reasons for this choice. First, the RITE style was not yet introduced at the time this product was launched. Second, we wanted an anchor with a sound quality that, in most environments, would be perceived to be worse than the three premium hearing aids in order to provide the best contrast for quality scaling.
For these reasons, a two-generations-old mid-range product seemed an appropriate choice. The moderately sloping (N3) prescription was used for the anchor, but we also chose to include a mild (N2) prescription of the anchor as a fourth N2 product.
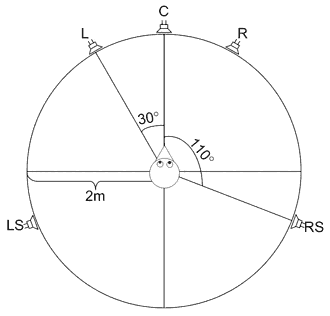
Recordings. Each set of hearing aids were fitted to a HATS mannequin that was situated in the middle of a 5 multichannel loudspeaker setup (Figure 2) according to ITU-R BS.1116-18 in a listening room that fulfilled EBU 32769 (a low reverberation time and background noise environment). All hearing aids with both prescriptions were recorded in all 7 environments, and we took great care to achieve consistent placement of the hearing aid dome in the HATS ears. A recording with no hearing aids situated in the HATS ears was also used as a reference. Since the listeners had normal hearing, it was decided to adjust the moderately sloping (N3) recordings down by 3 dB so as not to let loudness perception dominate their evaluation.
|

|
| FIGURE 2. Left diagram shows 5-loudspeaker setup. Right image shows HATS mannequin fitted with RITE style hearing aid. | |

FIGURE 3. Graphical user interface for the MUSHRA task. Each sample is rated on a 100-point scale. The first task is to find the reference and give it a score of 100. Then the other samples are evaluated.
Procedure. The listening test was based on the ITU-R BS.1534-19 recommendation, which is a double-blind multiple stimulus test using a hidden reference and anchor (MUSHRA). Stimuli were rated according to a 100-point quality scale subdivided into five equal judgements: “Bad,” “Poor,” “Fair,” “Good,” and “Excellent” (Figure 3). A randomized presentation order was used for all subjects within each repetition block.
The subjects were given the task of evaluating recordings of the 4 different hearing aids (including the anchor) with two prescriptions against a reference for the 7 different environments. The DELTA SenseLabOnline software made it possible to switch quickly between the 9 different recordings for each environment. Each assessor ran two separately blocked evaluations to allow for increased statistical significance and to track subject performance.
Results
The results from all environments and the overall results are shown in Figure 4, where we have labeled the two competing premium products as “Product A” and “Product B.” The sound environments “Office” and “FemTalk” (Female Talk) received similar ratings for the 8 systems—not surprising since these environments are fairly similar. The “Speech” and the “Music” environments received very similar ratings, as did the “Water” and “Forest” environments—again, not surprising since they both represented similar environmental sounds.
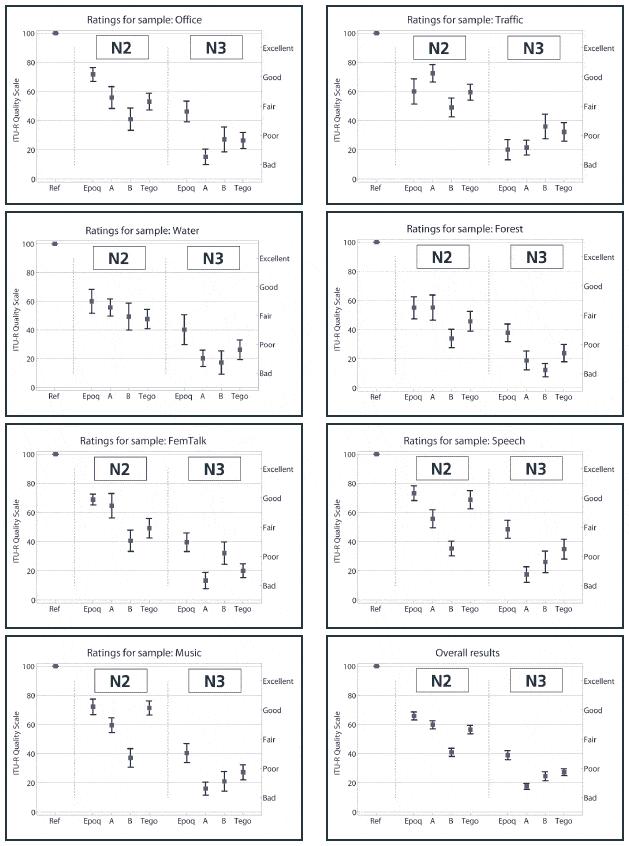
FIGURE 4. Results from all environments and the combined overall results. The bars show mean values and 95% confidence intervals.
Essentially, subjects in all environments showed a preference for Oticon Epoq for both the mild loss (N2) prescriptions and the moderately sloping (N3) prescriptions, whereas Product A is rated worst for the moderately sloping hearing loss and Product B worst for the mild loss. The “Traffic” scores are unique in that they have no similarity to any other environment, which may be explained by the fact that it is a fairly loud environment (see Table 1) that contains unwanted/aversive noise.
Seen from an overall perspective with the mild (N2) prescription, Oticon Epoq is rated significantly better than the competing hearing aids. For the mild hearing loss prescription, Product A is rated a little better than Tego, whereas Product B is rated significantly worse than the others. For the moderately sloping (N3) prescription, Oticon Epoq is again rated significantly better, whereas Product A is rated significantly worse than the others.
The mild loss (N2) prescriptions are rated significantly higher than the moderately sloping loss (N3) prescriptions.
Discussion
The results of this study showed a preference for Oticon Epoq among both the mild (N2) and the moderately sloping (N3) prescriptions. Oticon Tego was introduced 5 years ago as a mid-range product, and it surprised us that it did not come out as having the worst perceived sound quality among the tested hearing aids (ie, we specifically selected Tego in the N3 prescription to be the low anchor and ensure optimal contrast in the MUSHRA scale).
However, there are several important caveats for assessing the results. For the mild prescription, Product B was rated significantly lower compared to the competitors, and there may be several reasons why this occurred. We believe that, in this case, it is due to an excessive amount of amplification compared to the other hearing aids for this prescription. Since we wanted an independent evaluation of total systems—including all of the prescriptions—we did not equalize loudness across products. Gabrielsson10 and Lundberg11 suggest that sound quality and loudness evaluations influence each other. Running both with and without loudness equalization would be something to consider in a second study.
For the moderately sloping (N3) prescription, Product A was rated to have the lowest sound quality. This product, by default, uses a frequency lowering technique. Again, we were interested in a comparison with pure default prescriptions, and therefore did not disable this feature. It should be noted that the frequency lowering technique was default-on in both the N2 and the N3 prescriptions, but with greater effect in the N3 case. We cannot separate distinct signal processing algorithms in our sound quality ratings, but do believe that the poor ratings of Product A in this case are affected by the frequency lowering technique.
It seems apparent that the moderately sloping (N3) prescriptions are inferior to the mild (N2) prescriptions in terms of sound quality. This was expected, since the larger hearing loss introduces more gain, which might not be tolerated by the normal-hearing subjects—though we reduced output by 3 dB for the moderately sloping prescriptions so as not to let loudness dominate the evaluation. More gain in hearing aids is associated with greater levels of compression, which can have a deleterious effect on sound quality.12 With the moderately sloping (N3) prescription, we also used more closed domes leading to higher levels of occlusion, which may also influence sound quality ratings.13
This study also dealt with methodology regarding sound quality evaluations. Using normal-hearing people to evaluate hearing aids can be controversial. However, a clear advantage with this normal-hearing panel is that they can be considered first-time users and therefore have no preference based on previous experience. For most evaluations of hearing aids, we use people with hearing impairment, but will in the future investigate further applicability of using normal-hearing versus hearing-impaired people.
Acknowledgement
The method used here and some of the results were part of the presentation at the Third International Workshop on Perceptual Quality of Systems (PQS) held in Dresden, Germany, September 6-8, 2010.
References
- Wong LN, Hickson L, McPherson B. Hearing aid satisfaction: what does research from the past 20 years say? Trends Amplif. 2003; 7(4):117-161.
- Killion MC. Myths that discourage improvements in hearing aid design. Hearing Review. 2004;11(1):32-40.
- Gatehouse S, Noble W. Speech, Spatial, and Qualities of Hearing scale (SSQ). Int J Audiol. 2004;43:85-99.
- Bech S, Zacharov N. Perceptual Audio Evaluation. Theory, Method and Application. Hoboken, NJ: John Wiley & Sons, Ltd; 2006.
- International Organisation for Standards. ISO 8253-1 (1998). Acoustics, Audiometric Methods, Part 1: Basic Pure Tone Air and Bone Conduction Threshold Audiometry. Geneva, Switzerland: ISO; 1998.
- International Electrotechnical Commission (IEC). IEC 60118-15 (2008) Working Draft. Electroacoustics, Hearing Aids, Part 15: Signal Processing in Hearing Aids. Geneva, Switzerland: IEC; 2008.
- Flynn MC. New design focus yields a hearing device that people actually want. Hearing Review. 2006;13(4):58-63.
- International Telecommunications Union Radiocommunication Assembly. ITU-R Recommendation BS.1116-1 (1997). Methods for the subjective assessments of small impairments in audio systems including multichannel sound systems. Geneva, Switzerland: ITU-R; 1997.
- EBU 3276 (1998). Listening conditions for the assessment of sound programme material: monophonic and two-channel stereophonic. Geneva, Switzerland.
- ITU-R BS.1534-1 (2003). Method for the subjective assessment of intermediate quality levels of coding systems. International Telecommunications Union Radiocommunication Assembly.
- Gabrielsson A, Hagerman B, Bech-Kristensen T, Lundberg G. Perceived sound quality of reproductions with different frequency responses and sound levels. J Acoust Soc Am. 1990;88:1359-1366.
- Lundberg G, Ovegård A, Hagerman B, Gabrielsson A, Brändström U. Perceived sound quality in a hearing aid with vented and closed earmould equalized in frequency response. Scan Audiol. 1992;21(2):87-92.
- Souza PE. Effects of compression on speech acoustics, intelligibility, and sound quality. Trends Amplif. 2002;6:131-165.
- Kuk F. Perceptual consequences of vents in hearing aids. Brit J Audiol. 1991;25(3):163-169.
Citation for this article:
Simonsen CS, Legarth SV. A procedure for sound quality evaluation of hearing aids. Hearing Review. 2010;17(13):32-37.