What factors would most likely lead non-adopters to purchase hearing aids?
This installment of MarkeTrak rates 53 factors that might help persuade a reluctant non-hearing aid user to pursue hearing help, including financial and price considerations, multi-environmental listening utility, product features, and psychosocial barriers in the purchase of hearing aids.
Nearly 1 in 4 people with hearing loss own hearing aids—up from 1 in 5 people in the 1980s. Barriers to hearing aid adoption have been explored in detail in past MarkeTrak publications.1-3 Historically, one of the key reasons for non-adoption of hearing aids has been “my hearing loss is too mild to require amplification.”

Sergei Kochkin, PhD, is executive director of the Better Hearing Institute, Washington, DC.
Starting with MarkeTrak VII, we began segmenting barriers to adoption based on degree of hearing loss. For subjects with mild hearing loss, they simply might not be viable candidates for amplification; however, for subjects with moderate-severe (ie, moderate-through-severe) hearing loss who report their hearing loss is “too mild,” it is reasonable to suspect they are in denial about their hearing loss and the impact it has on their lives.
Since non-adopters have significantly lower hearing loss and are younger, it is important that we continue to examine adoption rates taking into account degree of hearing loss. In previous publications, we devised a method of segmenting the hearing-impaired population into hearing loss deciles (1 = lower 10% of people with mild hearing loss, 10 = top 10% of people with severe hearing loss).
Also in a previous publication,4 we compared demography and hearing loss characteristics of hearing aid owners and non-adopters. In summary, by comparing hearing aid owners with non-adopters, we have quantified the following:
- 83% of hearing aid owners are in hearing loss Deciles 5-10 compared to 43% of non-adopters.
- There are approximately 11 million non-adopters with hearing loss in Deciles 5-10—the population that most closely resembles the hearing aid industry’s typical consumer.
- 40% of people with moderate-severe hearing loss own hearing aids compared to 9% of people with mild hearing loss.
- Non-adopters are 11.2 years younger than hearing aid owners (average age of 59.9 for non-adopters vs 71.1 for hearing aid owners).
- Non-adopters have been aware of their hearing loss on average for 12.4 years (median = 8 years).4
The objectives of the following study were to:
- Explore non-adopter use of hearing care professionals or medical professionals relative to addressing hearing loss.
- Describe non-adopters who have expressed a high likelihood of hearing aid purchase intent as a solution for their hearing loss within the next year.
- Since we have explored “barriers to hearing aid adoption” previously,1-3 we thought it would be of interest to quantify factors that may influence non-adopters with low-purchase intent to adopt hearing aids sooner than they had planned.
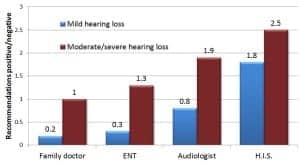
Figure 1. Recommendations for hearing aids by professional, comparing patients with mild (Deciles 1-4) and moderate-severe (Deciles 5-10) hearing loss; ratio of positive to negative recommendations shown (n=3,975).
Method
We will only summarize the research methodology that has been described in detail in a previous publication.4
- A screening questionnaire was sent to a nationally representative sample of 80,000 household members of the National Family Opinion (NFO) Panel in December 2008.
- A detailed 7-page questionnaire was sent to a random sample of 5,500 non-adopters with self-admitted hearing loss in February 2009. The response rate to this detailed survey was 79%.
With respect to this study, non-adopters were asked about:
- Their experience with professionals in exploring their hearing loss
- Their perceptions of how they got their hearing loss
- Their use of assistive listening devices
- Their likelihood of purchasing hearing aids in the next 4 years.
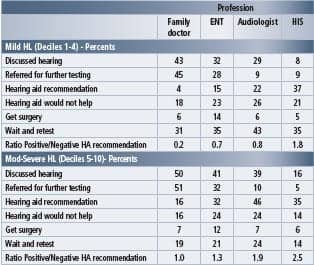
Table 1. Visitation with medical and hearing healthcare professional (n=3,975)
Additionally, they were presented with 53 influencing factors—issues that could possibly expedite their decision to purchase a hearing aid within the next 2 years. They were asked to rate each factor on a 5-point scale where a score of 5 = “much more likely to purchase a hearing aid,” 3 = “somewhat more likely,” and 1 = “not more likely.” The issues presented included: enhancements to hearing aids (22 factors), improvements in the utility of hearing aids (7), price of hearing aids and change in financial situation (13), and psycho-social factors (11) including quality of life changes in the individual’s life and recommendations from their social and professional network.
Throughout this publication, comparisons are made between people with mild hearing loss (Deciles 1-4) and moderate-severe hearing loss (Deciles 5-10); however, the focus will be on this latter group, which represents the typical consumer of hearing aids. It should also be recognized that, in all cases, these are consumers’ perceptions of these factors.
Use of Hearing/Medical Professionals
Referrals and hearing aid recommendations. Table 1 documents visitation with medical and hearing care professionals, segmented by the patients’ degree of hearing loss. People with either mild or moderate-severe hearing loss were more likely to discuss their hearing with their family doctor (43% and 50%, respectively), followed by an ENT, audiologist, and hearing instrument specialist (HIS).
Family doctors are more likely to refer both mild and moderate-severe people with hearing loss for testing (45% and 51%). ENTs and audiologists are more likely to recommend that the patient wait and retest their hearing if they have mild hearing loss (35% and 43%), while a roughly equal proportion of HISs are likely to recommend either more testing or a hearing aid (35% and 37%). For both mild and moderate-severe patients with hearing loss, ENTs recommend surgery (14% and 12%), significantly more than their peers.
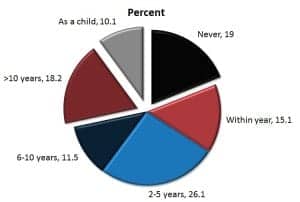
Figure 2. Non-adopter reports of last time their hearing was tested professionally (n=4,243)
As shown in Figure 1 and in Table 1, all professionals, except hearing instrument specialists, are more likely to recommend against hearing aids for people with mild hearing loss. For example, family doctors recommend hearing aids to 4% of people with mild hearing loss while recommending against to 18%, for a positive/negative ratio of 0.2 (4%/18%). In comparison, hearing instrument specialists give nearly twice as many positive recommendations for hearing aids as they give negatives.
With respect to people with moderate-severe hearing loss, family doctors are just as likely to recommend for or against hearing aids (16%). ENTs, audiologists, and hearing instrument specialists give more positive recommendations for hearing aids than negative. Audiologists are more likely to recommend hearing aids (46%) than the other three professionals; however, they also give more negative recommendations (24%). Hearing instrument specialists are 2.5 times more likely to recommend hearing aids than against.
Figure 2 shows that only about 2 in 5 (41.2%) non-adopters have had their hearing tested in the last 5 years. Nearly half (46.3%) have never had their hearing tested or were last tested as a child or more than 10 years ago.
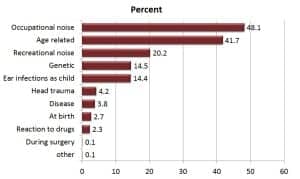
Figure 3. Non-adopter perceptions of cause of hearing loss (n=4,243).
In an earlier publication,1 we hypothesized that 40% of people with moderate-severe hearing loss know they have hearing loss but have insufficient information to take that next step, which is to have their hearing tested professionally. That continues to be a barrier to non-adoption of hearing aids, and the use of online or paper-and-pencil hearing loss screeners could serve as a “precursor hearing test” to motivate people to visit a hearing care professional. Recognition of the extent of hearing loss continues to be the number-one reason why people purchase hearing aids.4Figure 3 illustrates non-adopter perceptions of the causes of their hearing loss. Nearly half (48.1%) report occupational noise, 2 in 5 (41.7%) indicate it is age related, and 1 in 5 (20.2%) state their hearing loss emanates from recreational noise. About 14% report their hearing loss is genetic or caused by ear infections as a child. Less than 5% report their hearing loss was caused by head trauma, disease, a birth defect, reaction to drugs, or a result of surgery.
Short-term Hearing Aid Purchase Intent: Personal Characteristics
Individuals with hearing loss were asked to indicate their hearing aid purchase intent during the next 4 years. In Figure 4, short-term (<2 years) and long-term (3-4 years) purchase intent is shown by level of hearing loss as measured in deciles.
Hearing aid purchase intent is highly related to degree of hearing loss. For example, subjects with a very mild hearing loss (Decile 1) show only a 1.8% chance of purchasing hearing aids in less than 2 years compared to subjects in Decile 9 with nearly a 1 in 5 chance; we see a decline in Decile 10 most likely because many of people in this decile are either deaf or not candidates for traditional amplification.
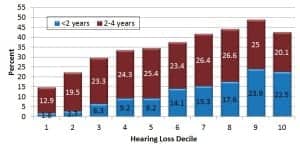
Figure 4. Hearing aid purchase intent by degree of hearing loss (Decile 1 = mild, Decile 10 = severe).
The demography of people reporting to purchase hearing aids in 6 months to a year is shown in Table 2a. On average they are 66 years old, slightly younger than the typical new user who is 68.8. More than half (55%) are male, and they are more affluent than the typical new user ($61,500 versus $54,000 household income per year). Factors that influenced them to want to purchase in the near future are recognition that their hearing loss got worse (69%), spouse or relative influence (53%), and safety concerns (21%), followed by recommendations of an audiologist (20%) and ENT (18%). Typically, new users report only 5% of the time that safety is a key influencing factor.4 Price, insurance coverage, and receipt of a free hearing aid influenced 14%, 17%, and 11%, respectively (typically, 6% and 8.5% of new users report price and receipt of a free hearing aid as a factor). All media (print, TV, radio) influenced 13% while no specific media garnered more than 5% of the influencing factors.
Table 2b documents the hearing loss characteristics of people reporting a short-term purchase intent. Seven out of 10 have a self-perceived bilateral hearing loss, the majority (61%) report their hearing loss as moderate, close to half cannot hear a whisper or speech across a room without visual cues, more than half report that hearing in noise is either quite or extremely difficult for them, they are more likely to be in the top quadrant on the BHI Quick Hearing Check (37%), and to be in hearing loss Deciles 6-9. On average, they have been aware of their hearing loss for 9.5 years (median = 5 years), which is longer than the typical hearing aid user (mean = 6.7 years, median = 3 years).4Do non-adopters with hearing loss use other devices to compensate for their hearing loss? In an earlier publication,5 we demonstrated that more than a million people use personal sound amplification products (PSAPs) that cost less than $50; however, what about assistive listening devices (ALDs)? Hearing-impaired non-adopters reported non-use of loop systems in teleconferencing, telephone captioning services, alerting devices, and external microphones. Only a small minority use a telephone ring indicator (14%), telephone amplifier (7%), earphones for the television (3%), amplified headsets in public places (2%), and loop systems with headsets in public places (0.5%).
Influencing Factors That May Expedite Hearing Aid Purchase
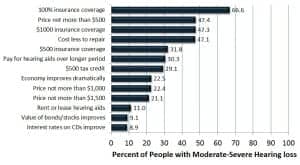
Figure 5a. Percent likelihood of adopting hearing aids within 2 years based on financial or pricing changes for people with moderate-severe hearing loss.
Historically, the MarkeTrak survey has focused on obstacles to hearing aid purchase.1-3 We thought it would be of interest to present the hearing-impaired consumer with a number of improvements in four key areas: financial, hearing aid listening utility, product enhancements, and psycho-social changes.
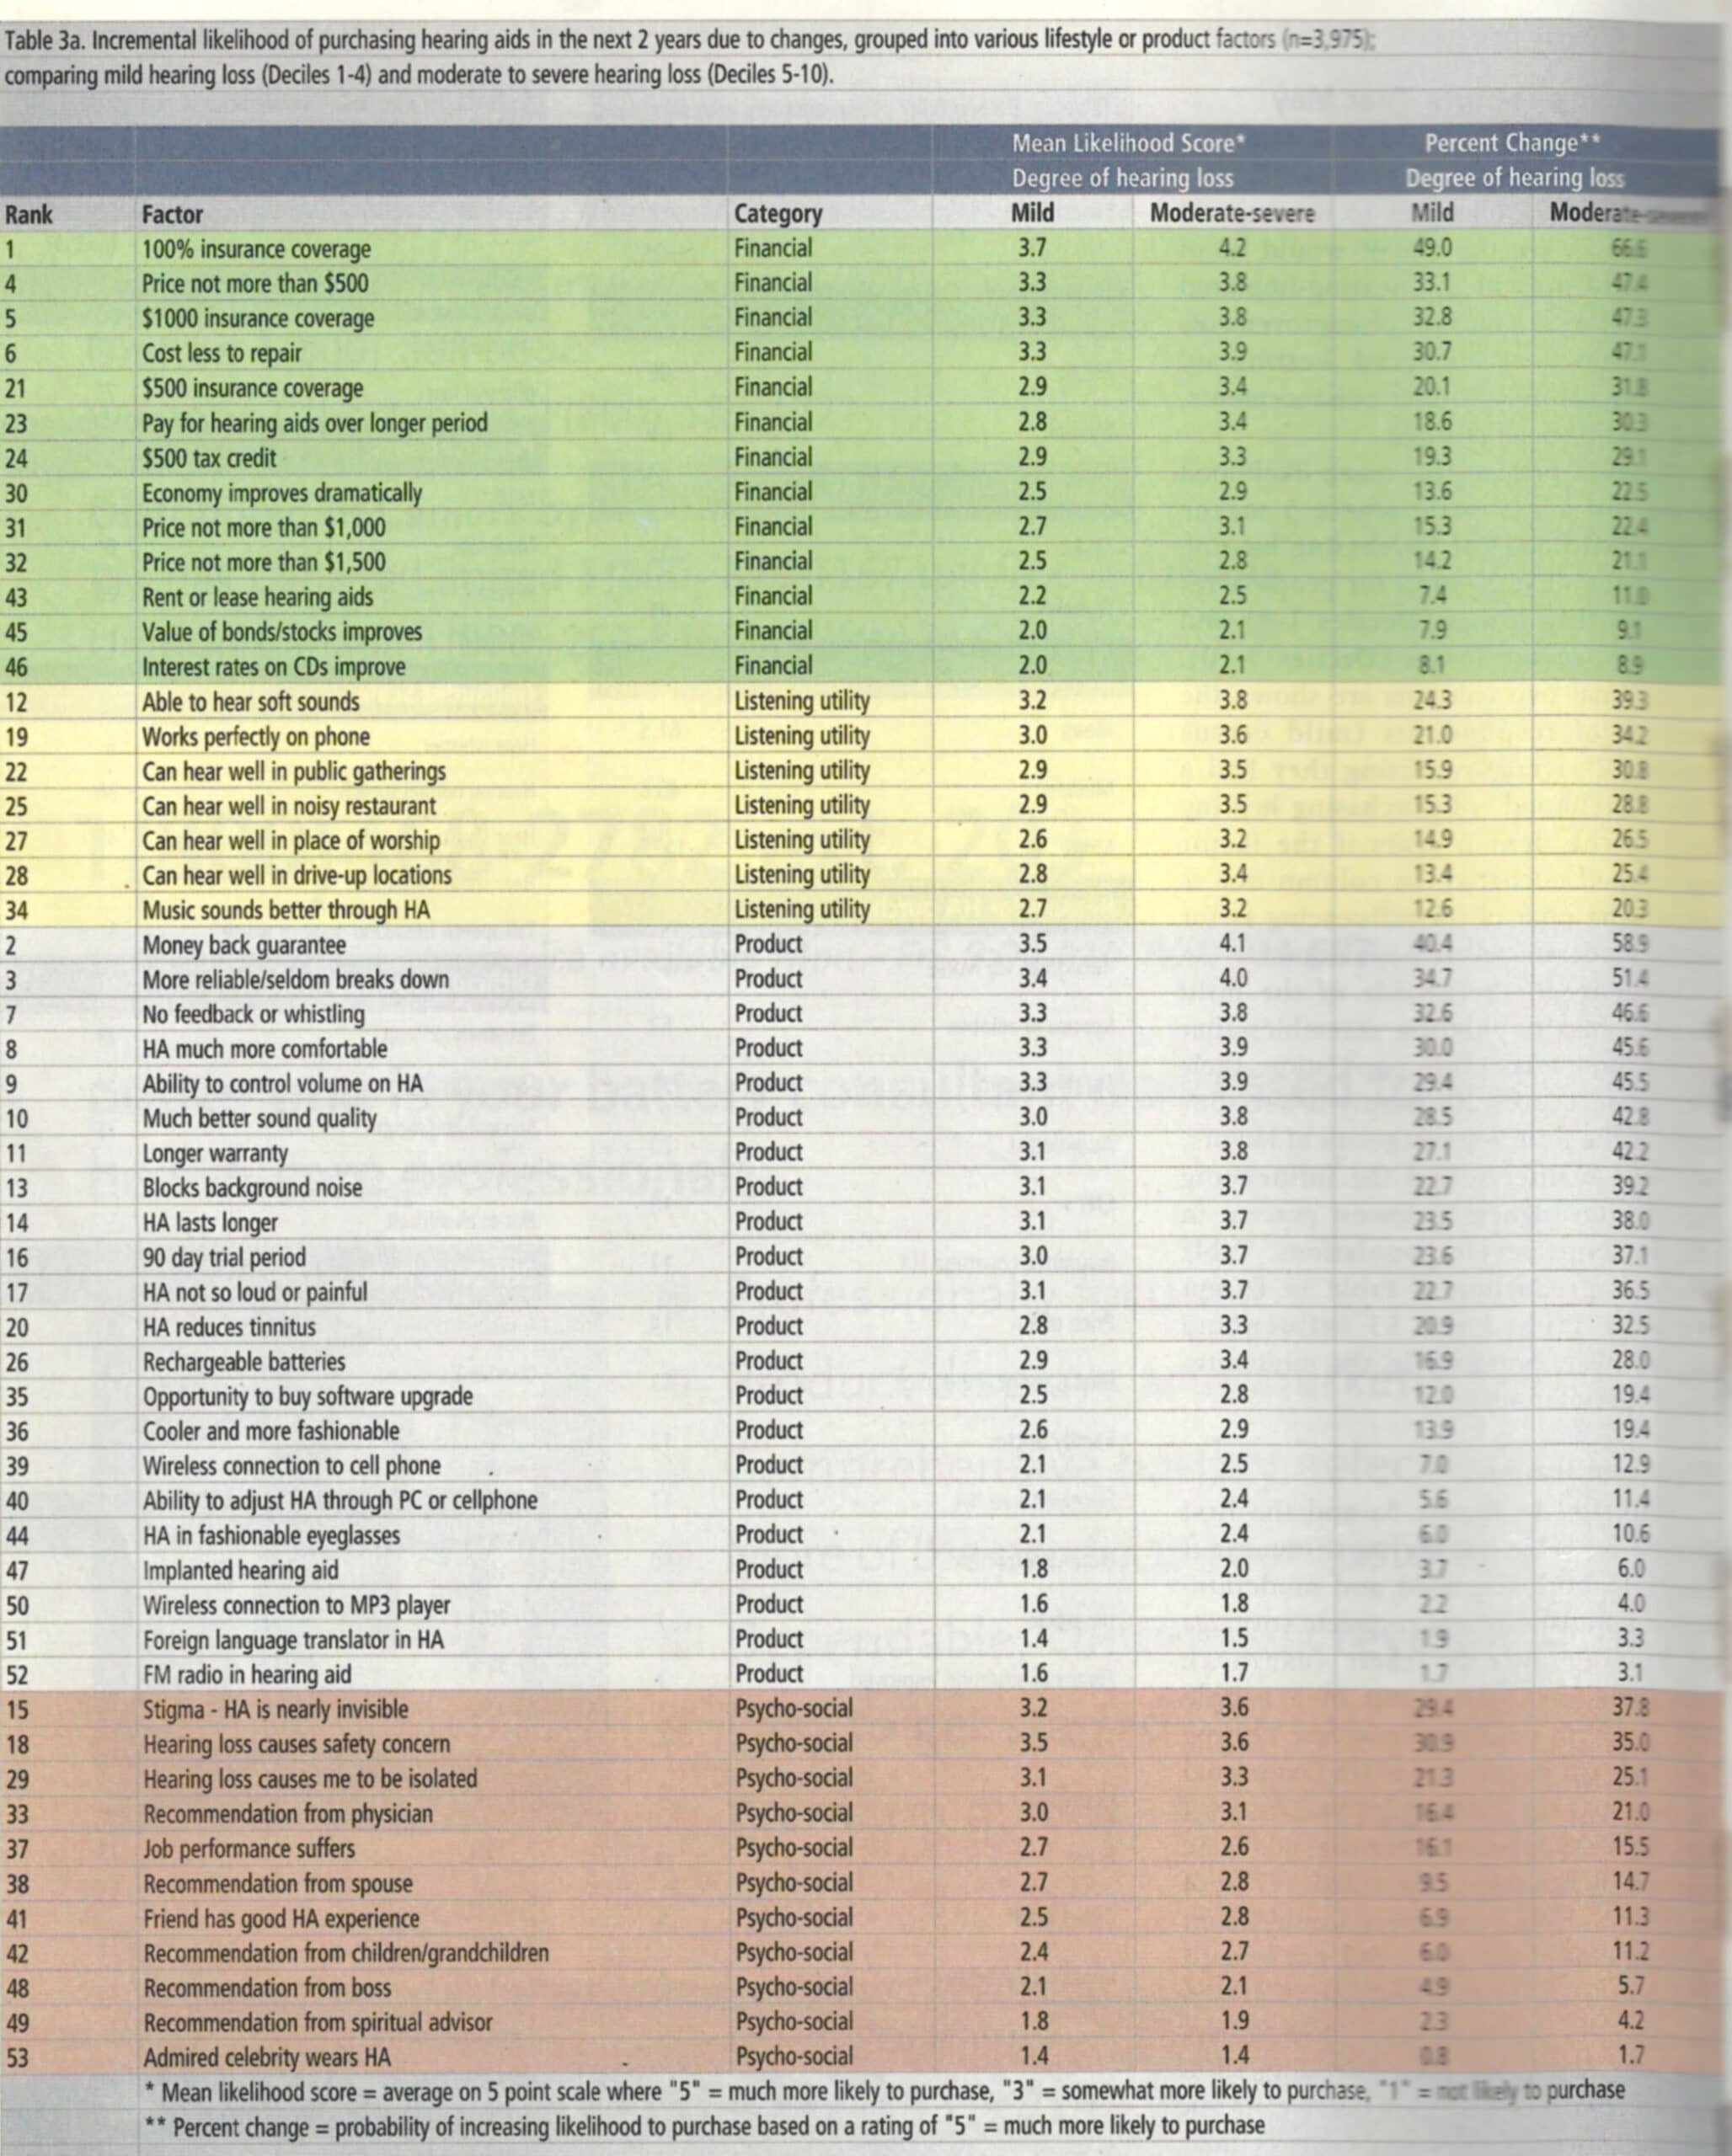
Table 3a [opens as a pdf in a new window] presents the mean likelihood score (on a 1-5 scale where 5 means “high likelihood” of purchasing hearing aids in the next 2 years) for people with mild hearing losses (Deciles 1-4) and moderate-severe losses (Deciles 5-10). In the final two columns are shown the percent of respondents (mild versus moderate-severe) reporting they had a “high likelihood” of purchasing hearing aids in the next 2 years if the factor mentioned occurred. In column one is shown the rank of the influencing factor to the moderate-severe population.
In general, the profile of the mild hearing loss population resembles that of the moderate-severe population; their likelihood scores are simply lower. For each of the four key categories of factors, we have further sorted the influencing factor from highest to lowest percent in the moderate-severe populations. Table 3b [opens as a pdf in a new window, second page] is a reproduction of Table 3a, except we have ranked the 53 influencing factors by importance in the moderate-severe populations.
Financial Issues
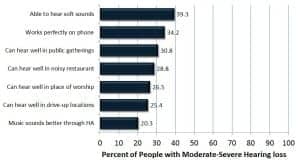
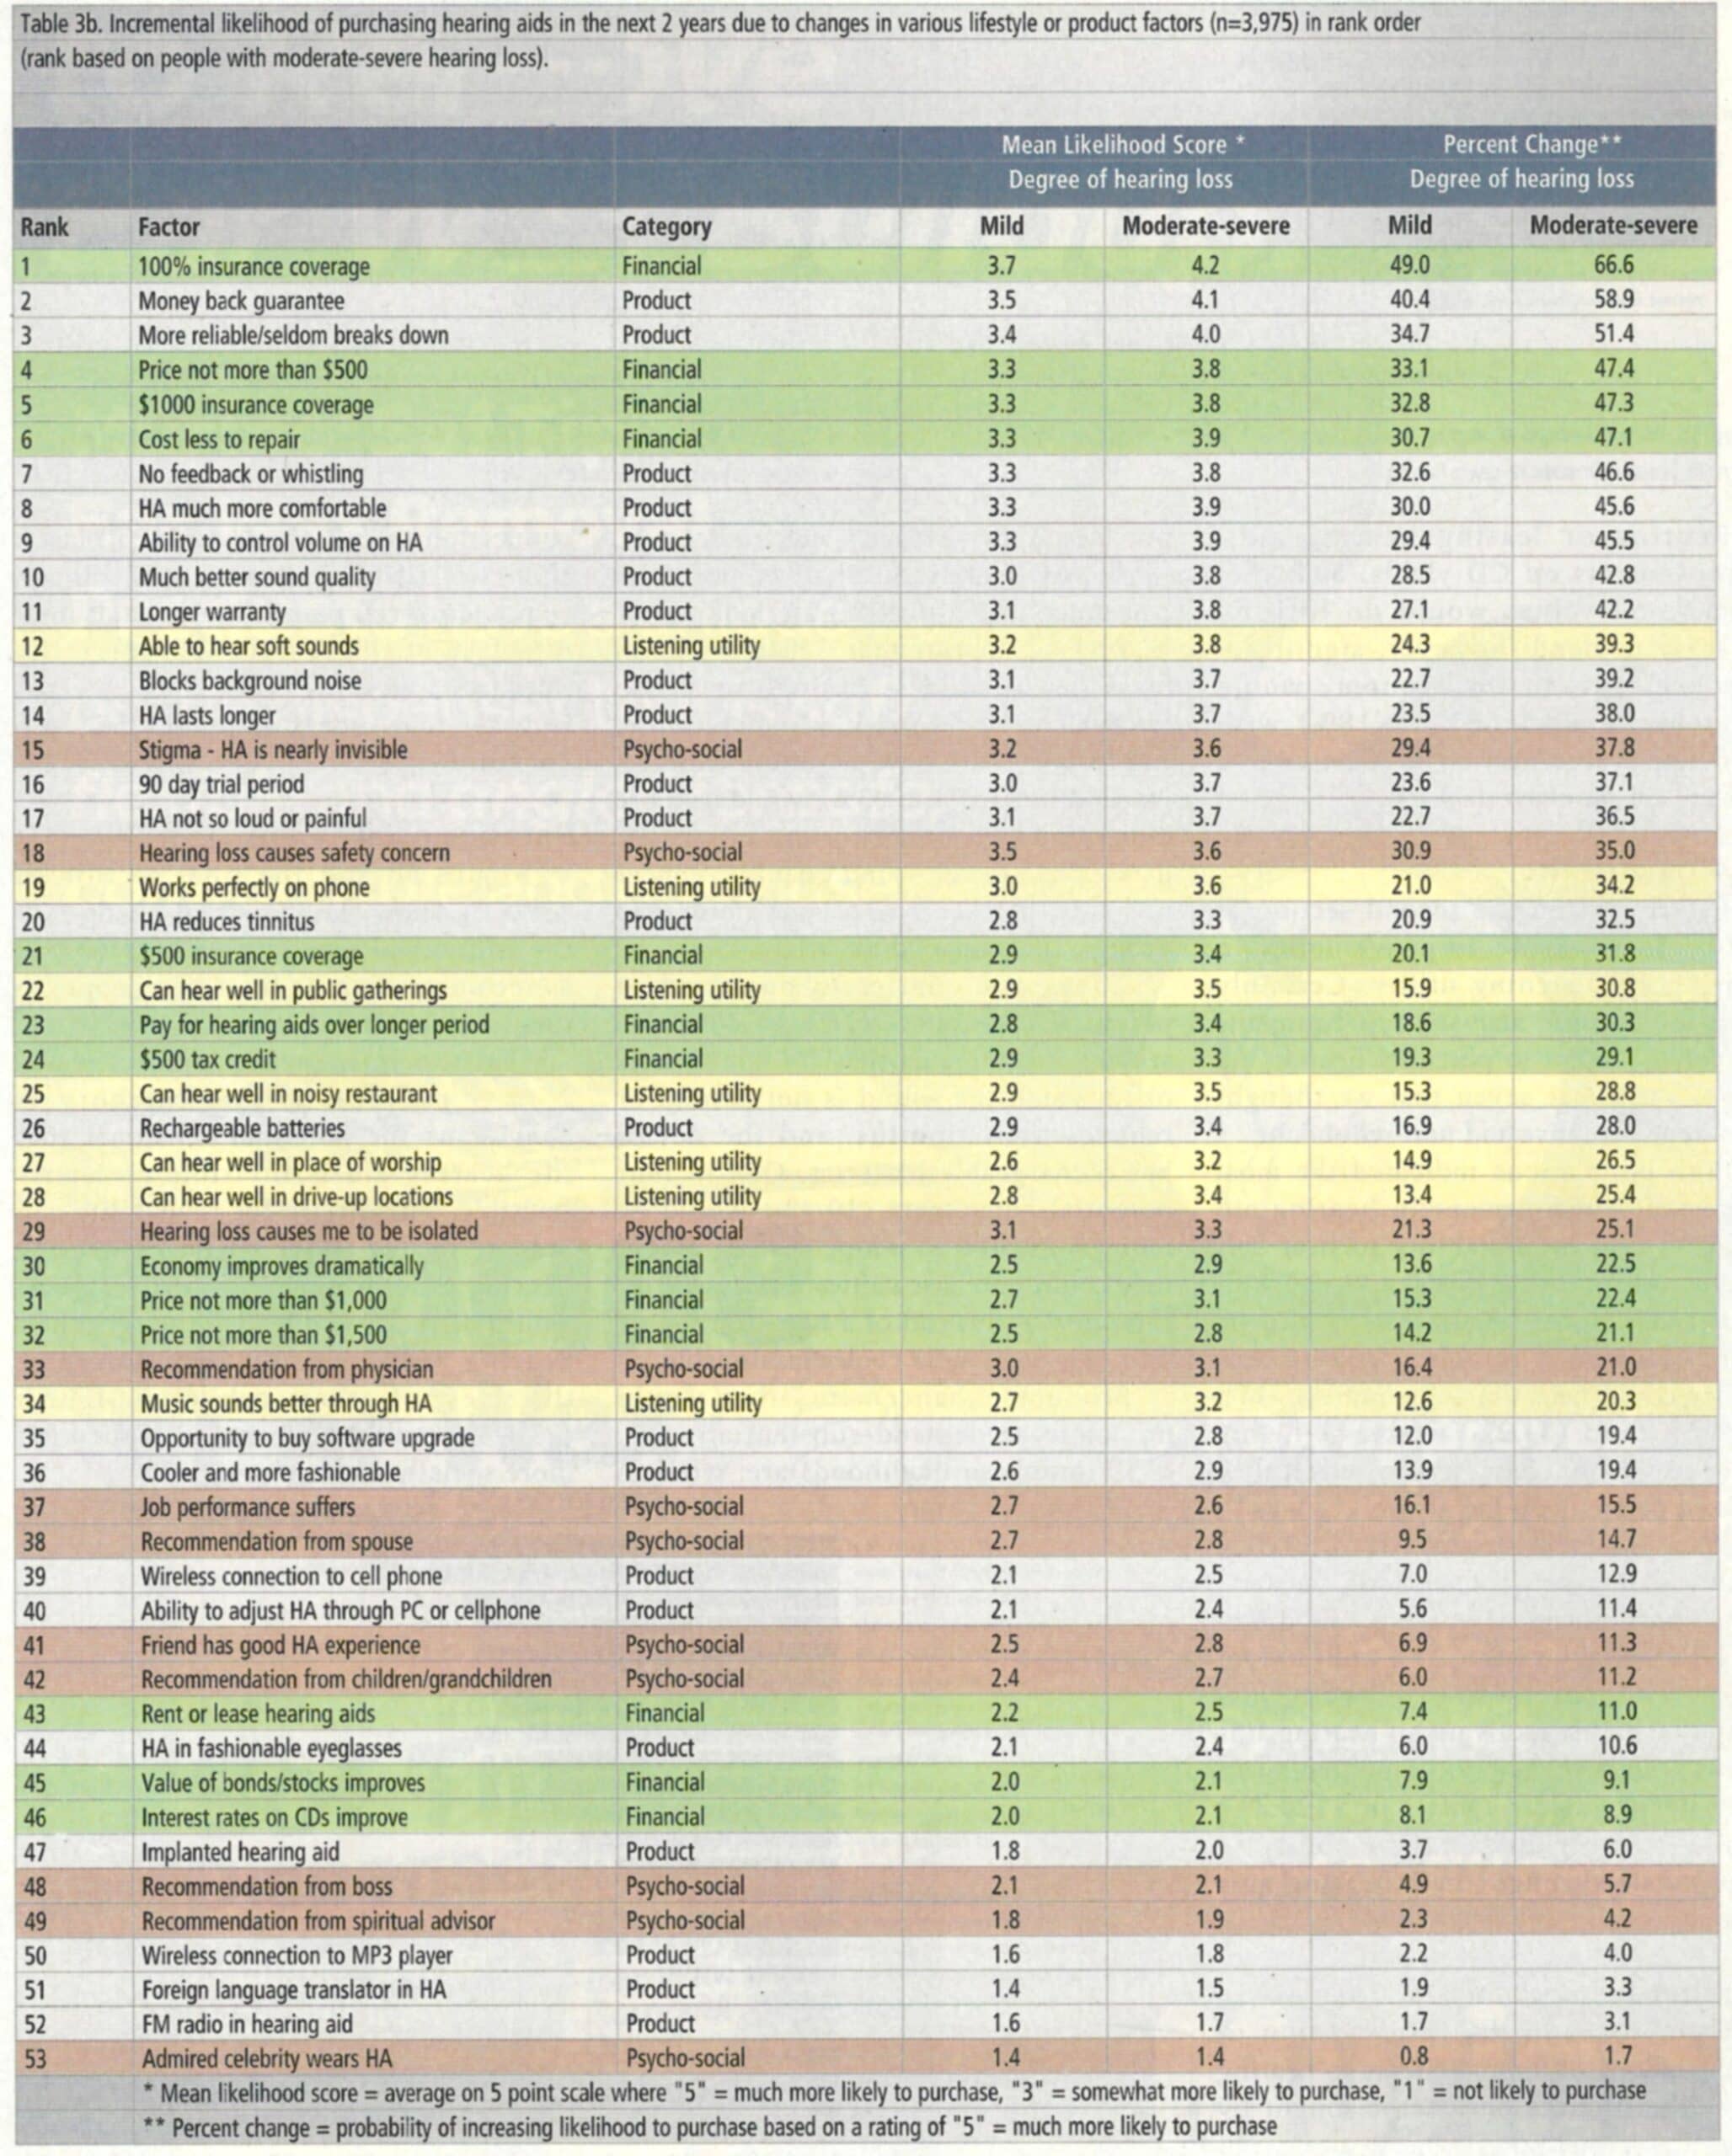
Figure 5b. Percent likelihood of adopting hearing aids within 2 years based on changes in hearing aid utility for people with moderate-severe hearing loss.
Referring to Figure 5a and the first section of Table 3a, the most important factor to both the mild and moderate-severe populations was complete coverage of hearing aids by their insurance programs. In total, 2 out of 3 people (66.6%) with moderate-to-severe hearing loss and half of people (49.0%) with mild hearing loss reported a high likelihood of hearing aid adoption if hearing aids were covered by insurance. About half (47%) of moderate-severe consumers would adopt hearing aids if the price did not exceed $500 or if their insurance contributed $1,000 per hearing aid toward the purchase of hearing aids. Providing $500 insurance coverage or $500 hearing aid tax credit per hearing aid would cut expedited demand by more than half. Offering hearing aids costing not more than $1,500 or $1,000 apiece would reduce demand to about a third of full insurance coverage.
Renting or leasing hearing aids, improvements on CD yields, or higher stock/bond values would do little to increase demand; however, significant improvements in the economy would influence 1 in 5 people (18%) with moderate-severe hearing loss closer to a hearing aid purchase decision.
Listening Utility
Figure 5b and the second section of Table 3a examine improvements in hearing aid listening utility. Certainly there are infinite acoustic environments we could present to potential hearing aid users. We chose seven that we thought were representative and non-redundant.
Both populations indicated the most important improvement in hearing aid utility would be the ability to hear soft sounds. About 2 in 5 people (39.3%) with moderate-severe hearing loss would be highly motivated to adopt hearing aids if they could hear the soft sounds of life. About a third (34.2%) would be highly motivated to purchase hearing aids if they worked perfectly on the phone.
With respect to far-field utility (public gatherings, conventions, theaters, restaurants, places of worship, and drive-up locations), between 25% and 30% of people with moderate-severe hearing loss would be highly motivated if hearing aids allowed them to function much better in these environments. Only 1 in 5 (20.3%) would be motivated if their ability to hear music through their hearing aids was improved.
Product Enhancements
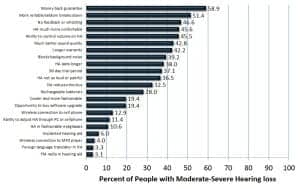
Figure 5a. Percent likelihood of adopting hearing aids within 2 years based on financial or pricing changes for people with moderate-severe hearing loss.
Figure 5c and the third section of Table 3a look at improvements to hearing aids. The number-one factor sought by potential consumers is a money back guarantee if their hearing aids do not provide them enough benefit. In fact, 3 in 5 people (58.9%) with moderate-severe hearing loss would be motivated to purchase if they had such a guarantee.
Approximately one-half of potential consumers (45% to 51%) are looking for hearing aids that are more reliable (seldom break down), are less costly to repair, do not whistle or feedback, are much more comfortable, and have a volume control. About 2 in 5 (37% to 43%) would be more motivated to adopt hearing aids if the devices had better sound quality, a longer warranty, blocked background noise, had a longer life, and a 90-day trial period.
About one-quarter to one-third of potential consumers (28% to 36%) are seeking hearing aids that are not so loud or in which the sound is not painful or reduces their tinnitus, and the device has rechargeable batteries. One in four potential consumers (19.4%) would be more motivated to adopt hearing aids if they could purchase software upgrades for their devices instead of a new hearing aid or if they were more cooler/fashionable.
Product enhancements that would not increase demand substantially (eg, <13% purchase likelihood) are: wireless connection to cell phone or MP3 player, ability to self-adjust hearing aids through computer or cell phone, hearing aids built into fashionable eyeglasses, surgically implanted hearing aids, and foreign-language translator or FM radio built into the hearing aid.
Psycho-social Factors
Figure 5a. Percent likelihood of adopting hearing aids within 2 years based on financial or pricing changes for people with moderate-severe hearing loss.
Figure 5d and the final section of Table 3a show the impact of changes in the individual’s quality of life, as well as recommendations from key people in their social network.
The top influencing factor (nearly 2 in 5 people) in this category is convincing the potential consumer that the hearing aid is invisible or nearly invisible. This desire for invisibility can only be related to the stigma of wearing hearing aids. About one-third (35.0%) would be motivated if they thought their hearing loss impacted their safety or the safety of others, while one-fourth (25.1%) would be motivated if they felt more socially isolated.
The most important social network influence is the family doctor; in fact, 1 in 5 people (21.0%) indicated they would be highly motivated to get hearing aids if their family doctor recommended hearing aids. Only about 15% would be highly motivated if they thought their job performance suffered or if their spouse recommended they get hearing aids.
Factors least likely to influence a consumer (11% or less) are: a friend has a good hearing aid experience, and recommendations from children/grandchildren, bosses, or spiritual advisors. The lowest-ranked influencer is if a celebrity they admired wore a hearing aid.
Ten Points for Industry and Professional Consideration
In reflecting on the non-adopter population and factors that would, from their viewpoint, expedite the hearing aid adoption decision, the following issues stand out:
- Dearth of hearing testing opportunities. Close to half of non-adopters have not had their hearing tested in the last 10 years, had it last tested as a child, or never had their hearing tested. This finding is in line with previous publications on barriers to non-adoption of hearing aids.1 We hypothesize that, while they may be aware of their hearing loss, they have insufficient information to further pursue the journey to hearing help. The wide-scale availability of precursor online hearing checks, such as at www.hearingcheck.org (the BHI validated hearing check), could influence more people with unaided hearing loss to visit hearing health professionals sooner.
- Reducing out-of-pocket cost. Insurance coverage for hearing aids, as well as less than $500 hearing aids, rank high (#1 and #4, respectively) and significantly higher than a $500 tax credit (#24). In previous publications,7-10 it was shown that hearing aids were price-inelastic, meaning that reductions in retail price would not be offset by increases in volume.
While we are in agreement with this finding, the use of third-party payments for hearing aids can increase demand without damaging the financially stability of retailers. Would the availability of lower-price hearing aids or more wide-scale insurance coverage influence more lower-income people to come forward to treat their hearing loss? We can make an inference by observing the average incomes of people wanting hearing aids costing no more than $500 and those looking for 100% insurance coverage. Their median incomes are, respectively, $46,300 and $48,800. When we compare their income to the typical user of hearing aids ($41,300),5 in all likelihood these initiatives would influence more affluent people to adopt hearing aids. Further exploration also shows it would drop the median age of hearing aid users from age 74 to 61, bringing forth many more people who are in the workforce.
In a 1978 study of non-adopters,8 it was determined that only 35% of the non-adopter market would use hearing aids if they were free. It is encouraging in this study that, if hearing aids were free via third-party payments, 56% of the non-adopters would become hearing aid users. - Guarantees. Being offered a money-back guarantee (#2) is the top product feature sought by potential consumers of hearing aids, and a 90-day trial period (#14) also ranks high. Given the number of new hearing aids in the drawer,4 it would be worthwhile for the hearing health industry to understand from the consumer’s perspective what a money-back guarantee means, how it is related to a reasonable trial period for hearing aids, and whether the use of enhanced protocols employing verification and validation contributes to consumer perceptions of benefit as shown in an earlier paper in this series.11
- Increasing reliability and reducing repairs. Making hearing aids more reliable (#3) and reducing the cost of repairs (#6) would influence significantly more people to adopt hearing aids.
- Perceived product shortcomings. We can only surmise that the image of hearing aids among non-adopters comes from the literature and the media, as well as talking to or observing people who use hearing aids. Non-adopters rate the following product features very high: No feedback or whistling (#7), much more comfortable to wear (#8), ability to control the volume on the hearing aid (#9), and much better sound quality (#10). Previous research has demonstrated that a significant number of people desire a volume control on their hearing aids and that it is used only “occasionally” or “seldom” in those environments where more gain is desired.12-14
- Physicians as significant influencers. The most important social influencer of those presented in the consumer’s life is the family physician (#33); the least important influencer is an admired celebrity who wears a hearing aid (#53).
- Reducing perceived stigma. The top psycho-social issue is the stigma of wearing aids (#15), and thus the desire that they be invisible. This high rating is consistent with previous research15 showing that the less visible a hearing aid is, the more the product is rated higher on every conceivable dimension. Given this high rating, continued reinforcement that hearing aids are nearly invisible is an effective method for influencing adoption of hearing aids.
- Audibility of “soft sounds” and telephone conversation. When presented with seven listening situations, potential consumers rate the ability to hear soft sounds first (#12), followed by hearing aids working perfectly on the phone (#19).
- Less-important factors. Product enhancements with very low ratings are: built into fashionable eyeglasses (#44), an implanted hearing aid (#47), wireless connection to MP3 player (#50), foreign language translator in hearing aid (#51), and FM radio built into hearing aid (#52).
- Financial well-being. Finally, improvements in the value of stock and bond valuation would not improve demand. However, significant improvements in the economy would.
Acknowledgement
This study was made possible by a special grant from Knowles Electronics, Inc, Itasca, Ill.
Correspondence can be addressed to HR or Sergei Kochkin, PhD, at [email protected].
References
- Kochkin S. MarkeTrak VII: Obstacles to adult non-user adoption of hearing aids. Hearing Jour. 2007;60(4):27-43.
- Kochkin S. MarkeTrak IV: Correlates of hearing aid purchase Intent. Hear Jour. 1998;51(1):30-41.
- Kochkin S. MarkeTrak III: Why 20 million in US don’t use hearing aids for their hearing loss. Hear Jour. 1993;46(1):20-27;46(2):26-31; 46(4):36-37.
- Kochkin S. MarkeTrak VIII: 25-year trends in the hearing health market. Hearing Review. 2009;16(11):12-31. Available at: www.hearingreview.com/issues/articles/2009-10_01.asp. Accessed February 1, 2012.
- Kochkin S. MarkeTrak VIII: Utilization of PSAPs and direct-mail hearing aids by people with hearing impairment. Hearing Review. 2010;17(6):12-16. Available at: www.hearingreview.com/issues/articles/2010-06_01.asp. Accessed February 1, 2012.
- Kochkin S, Bentler R. The validity and reliability of the BHI Quick Hearing Check. Hearing Review. 2010;17(12):12-28. Available at: www.hearingreview.com/issues/articles/2010-11_01.asp. Accessed February 1, 2012.
- Amlani, A.M. How patient demand impacts pricing and revenue. Hearing Review. 2008;15(3):16-19. Available at: www.hearingreview.com/issues/articles/2008-03_01.asp. Accessed February 1, 2012.
- Aaron MJ. An Economic Study of the United States Hearing Aid Industry: A Demand- and Supply-Side Examination [dissertation]. Chicago: University of Illinois; 1987.
- Amlani AM, De Silva DG. Effects of business cycles and FDA intervention on the hearing aid industry. Am J Audiol. 2005;14(1):71-79.
- Kochkin S. MarkeTrak IV: Correlates of hearing aid purchase intent. Hear Jour. 2000; 51(1):30-38.
- Kochkin S, Beck DL, Christensen LA, et al. MarkeTrak VIII: The impact of the hearing healthcare professional on hearing aid user success. Hearing Review. 2010;17(4):12-34. Available at: www.hearingreview.com/issues/articles/2010-04_01.asp. Accessed February 1, 2012.
- Kochkin S. MarkeTrak VI: Isolating the impact of the volume control on customer satisfaction. Hearing Review. 2003;10(1):26-35. Available at: www.hearingreview.com/issues/articles/2003-01_02.asp. Accessed February 1, 2012.
- Kochkin S. MarkeTrak VI: Consumers rate improvements sought in hearing instruments. Hearing Review. 2002;9(11):18-22. Available at: www.hearingreview.com/issues/articles/2002-11_01.asp. Accessed February 1, 2012.
- Surr RK, Cord MT, Walden BE. Response of hearing aid wearers to the absence of a user-operated volume control. Hear Jour. 2001;54(4):32-36.
- Kochkin S. MarkeTrak IV: Impact on purchase intent of cosmetics, stigma, and style of hearing instrument. Hear Jour. 1994;47(9):29-36.
Citation for this article:
Kochkin S. MarkeTrak VIII: The Key Influencing Factors in Hearing Aid Purchase Intent Hearing Review. 2012;19(03):12-25.
TABLES 2 a & b
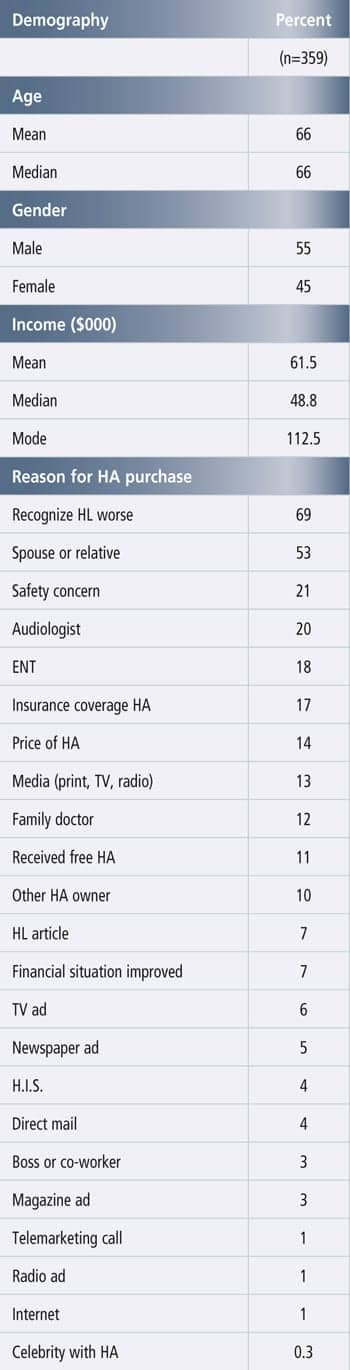
Table 2a. Demography of non-adopters with short term hearing aid purchase intent (6 months – 1 year).
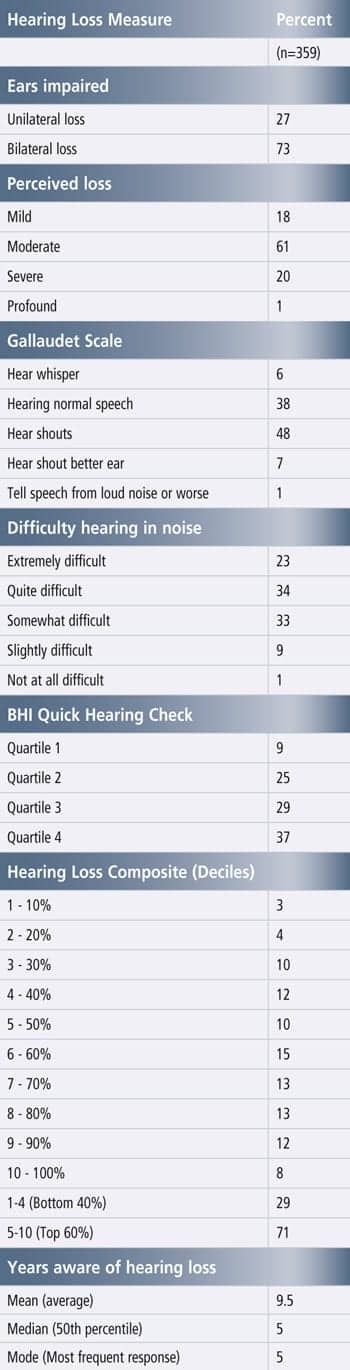
Table 2b. Hearing loss characteristics of non-adopters with short term hearing aid purchase intent (6 months – 1 year).