
Tech Topic | August 2017 Hearing Review
Real-ear verification is considered a “best practice” when fitting hearing aids. In this study, a clinical verification approach was applied to verify the implementation of the NAL-NL2 rationale in the Widex Unique hearing aids.
Today, most hearing-aid manufacturers offer a choice of different prescription rules, or fitting rationales, that the hearing care professionals (HCPs) can choose from when fitting hearing aids. A fitting rationale can be defined as an approach to hearing aid fitting in which some audiological characteristics of a person are measured and used to calculate the required amplification characteristics (the fitting target).1 The aim is to provide an optimal “first fit” for a given hearing loss configuration that meets the listening needs for as large a group of hearing aid wearers as possible. From this starting point, the HCP may then fine-tune the hearing aid based on the listening needs and sound preferences of the individual wearer.
Apart from the manufacturers’ own proprietary prescription rules, the most commonly used “generic” fitting rationales today are the National Acoustic Laboratories’ non-linear procedure (NAL-NL2),2 and the Desired Sensation Level Multistage Input/Output algorithm, also referenced as DSL version 5.3 Each of these generic fitting rationales are based on theoretical and empirical work, and they put forward a number of fitting objectives for how the gain, output, and compression should be set to optimize audibility, speech intelligibility, loudness sensation, etc, for a given hearing loss.
HCPs who fit hearing aids according to NAL-NL2 or DSL v5 may wish to objectively verify that the gain and output requirements prescribed by the fitting rationale have been met. The verification may be done by use of a clinical real-ear measurement (REM) system, where the actual gain and output of the hearing aid is measured with a probe microphone positioned close to the eardrum. REM verification is recommended by the American Speech-Language-Hearing Association4 (ASHA) and by the American Academy of Audiology (AAA).5 It is considered a “best practice” by many clinicians, and it is also a mandatory requirement by some hearing care providers around the world.
Previous investigations have shown that hearing aid manufacturers’ implementations of generic fitting rationales do not always produce the gain and output prescribed by these rationales when verified systematically with a clinical REM setup.6,7 For example, Sanders et al7 in 2015 measured the real-ear aided response (REAR) produced by hearing aids from five manufacturers fitted to NAL-NL2 in 8 adults with sloping sensorineural hearing losses. The results showed that in 4 of the 5 hearing aids evaluated, the average REAR was more than 10 dB below the prescribed target at 3000 Hz, and for three of the hearing aids, the average REAR at 500 Hz was at least 8 dB below target. Other general findings included a gain roll-off at frequencies above 2000 Hz, and a reduced gain for soft input levels compared to the prescribed NAL-NL2 target. It was also shown how the reduced gain resulted in a significant reduction in the Speech Intelligibility Index (SII) relative to the SII provided by the target gain—with the most substantial reduction being observed at low input levels. Based on these results, the authors concluded that hearing care professionals cannot rely only on the manufacturers’ first fit to generic fitting rationales, and they emphasized the importance of clinical real-ear verification to ensure target match and end-user benefit.
The study by Sanders et al7 investigated the deviations between target and measured responses, which may be explained by inaccuracies in the manufacturer’s implementation of the given generic rationale in the fitting software (ie, the manufacturer’s precision). However, in a clinical setting, other factors may contribute to such deviations. One factor may be that the chosen hearing aid model, receiver, and earmold types are not adequate to provide the necessary gain for the specific hearing loss (ie, hearing aid-related). Another factor may be inaccurate REM measurements, for example, caused by incorrect placement of the probe tube in the ear canal, excessive ear wax in the ear canal, etc (ie, procedure-related). A final factor may be a mismatch between the settings on the REM system and the settings in the fitting software, which may cause deviations between the targets from the two sources (ie, REM settings-related).
This article has two key objectives:
1) To examine the current practice of measuring REM in the clinic, and discuss the important steps in setting up a REM system for valid measurements, and
2) Because a Widex hearing aid was not included in the study by Sanders et al7 described above, we would like to verify the precision of the first fit with a Widex hearing aid to a generic fitting target ( NAL-NL2).
Unique to the Widex fitting protocol is that it includes in-situ measurements of the hearing loss8 and fitting algorithms that compensate for individual differences caused by the ear-canal volume differences and vent effects.9 These precisions are designed to enable improved control of the sound pressure at the eardrum and a more accurate fitting and gain specification. The result is that any deviations between the measured real-ear response of Widex Unique and the fitting target are small and lower than observed for hearing aids in general, as in the Sanders et al7s study.
The Speech Mapping Display
A popular way of displaying the results of real-ear measurements is the SPL-O-gram or Speech Mapping display, where all entities are shown in dB SPL at the hearing-aid wearer’s eardrum:
- The reference normal hearing threshold;
- The wearer’s hearing threshold curve;
- The wearer’s uncomfortable loudness levels;
- The target curve, and
- The aided Long Term Average Speech Spectrum (LTASS). The aided LTASS is essentially the real-ear aided response (REAR) averaged over time.
When adding the aided 30th percentile and 99th percentile curves to the display, the HCP can more easily assess the degree of audibility (ie, the Sensation Level) of the speech signal relative to the client’s hearing threshold curve. Figure 1 shows a typical Speech Mapping display on a commercial real-ear measurement system.
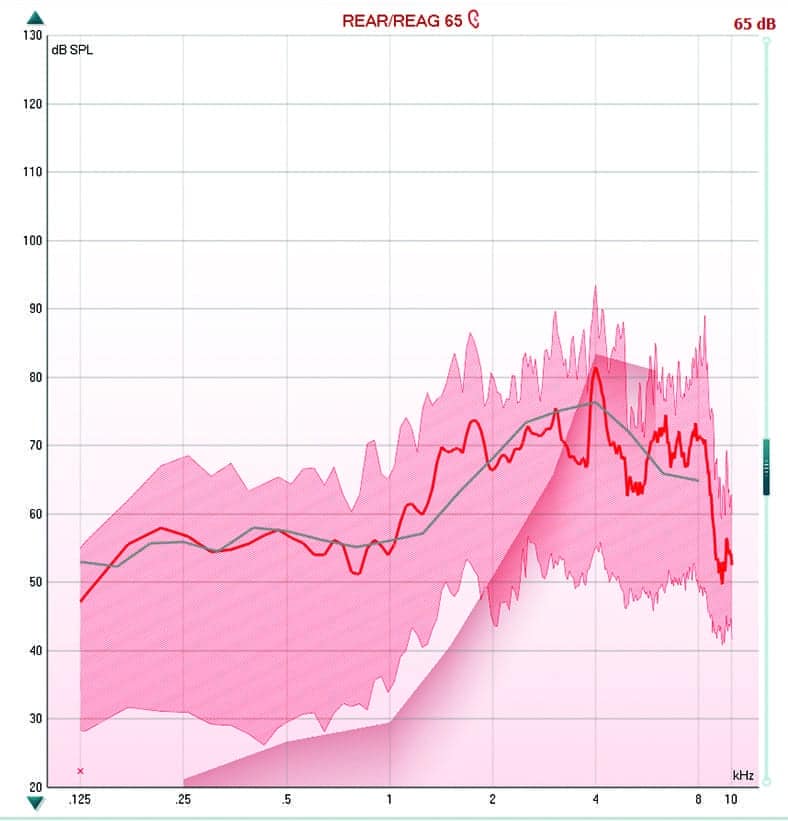
Figure 1. Example of a real-ear measurement, shown in a Speech Mapping display (Interacoustics Affinity). The aided Long Term Average Speech Spectrum (red curve) shows a relatively good match to the NAL-NL2 target (grey curve), prescribed for the moderate-to-severe hearing loss in this case. The red shaded area shows the dynamics of the speech signal, defined by the 30th and 99th percentile levels across frequencies. The input signal is the International Speech Test Signal (Holube et al, 2010) at 65 dB SPL (free field).
What Affects the Accuracy of ”Match to Target”?
As described earlier, the goal for the HCP is to verify that there is a “match to target” when comparing the aided real-ear gain or output to the targets prescribed by the selected fitting rationale. If deviations occur at some frequencies, the hearing aid gain should be adjusted in the fitting software, and the measurement procedure should be repeated until an acceptable match is made.
Real-ear measurements are generally considered valid up to about 6 kHz, if the probe-tube microphone has been positioned correctly within 5 mm from the eardrum. Beyond this frequency, the accuracy of the measurement decreases due to reduced high frequency sensitivity of the probe microphone and due to the actual distance between probe tip and eardrum.
Similarly, in the low- and mid-frequencies (eg, 125-1000 Hz), the response may be altered due to leakage in the earmold, either via the vent or due to leakage from a loose fit in the ear. Likewise, some leakage caused by the probe tube beneath the earmold will also affect the measurement, causing a decrease in the measured low-frequency response.10
The clinicians who routinely make real-ear measurements in the clinic will be able to perform the procedure consistently with good test-retest reliability. They will know how to spot potential measurement errors when looking at the recorded responses, correct these errors, and then perform the measurement again.
Variations in the REM-system Setup
When performing real-ear measurements, it is important to look at how the fitting target is defined—both in the software used for fitting the hearing aid, and in the REM system used for verifying the fitting. Some common parameters are shown in Table 1.
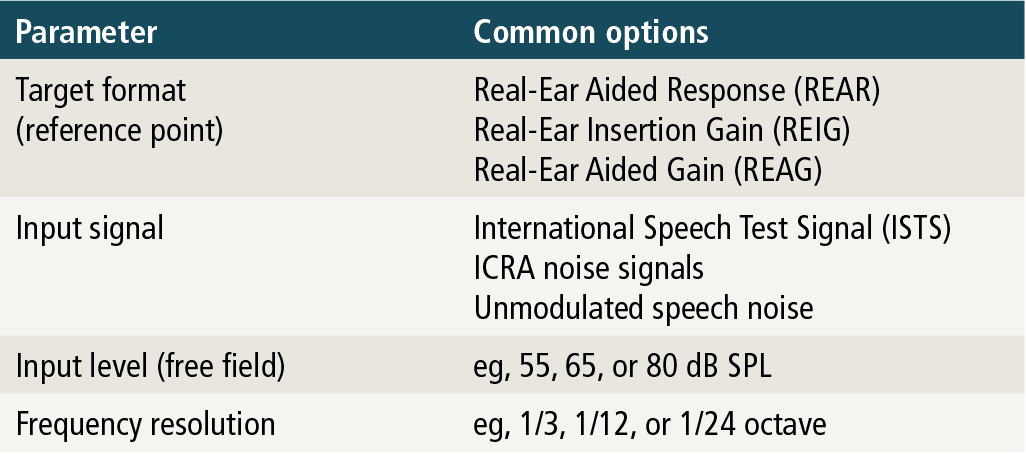
Table 1. Commonly used parameters for defining a fitting target.
For the real-ear measurement to be valid, and in order to have consistency between the target applied by the REM system and in the fitting software, it is important that the type of input signal and the frequency resolution are the same in both systems. Today, when measuring the performance of non-linear hearing aids, the recommendation is to use a modulated speech stimulus (eg, the International Speech Test Signal (ISTS)).11 Regarding the frequency resolution, it is common to use a 1/3-octave resolution when specifying target and response curves in fitting software and REM systems.
In a similar way, some specific information concerning the hearing aid wearer, the selected hearing aid, and the type of fitting being made may also need to be entered into the REM system. For example, the NAL-NL2 rationale requires information on that person’s age, gender, hearing aid experience, and language type (tonal/non-tonal). Based on this information, the NAL-NL2 rationale will modify the target curve to take the individual user characteristics into account.2 The NAL-NL2 rationale will, for instance, provide up to 10 dB more gain for an experienced hearing aid user, compared to an inexperienced user. Thus, if fitting a person with more than one year of hearing aid experience, the HCP may select the NAL-NL2 “experienced” setting in the fitting software, and should then make sure that this setting is also selected in the target settings on the REM system. If the REM system does not include the option to enter the level of experience, the “experienced” gain setting may be used for all wearers, but the calculated NAL-NL2 target will thus not be correct for new users.
In addition to this, the fitting rationale may also require specification of the type of transducer used for establishing the pure-tone audiogram, whether a behind-the-ear (BTE), in-the-ear (ITE), or receiver-in-the-ear (RITE) device is being fitted, the number of channels in the hearing aid, its compression speed, if the fitting is binaural or monaural, and the size of vent in the earmold. All these settings (and several more) are used by the rationales to incorporate the acoustical properties of the threshold procedure, the acoustics of the hearing aid, as well as its sound processing into the calculation of the fitting target. These settings should optimally correspond to the selections made in the fitting software, and to the characteristics of the actual hearing aid being fitted. An overview of information (required and optional) applied by the NAL-NL2 and DSL v5 rationales is provided in Table 2.
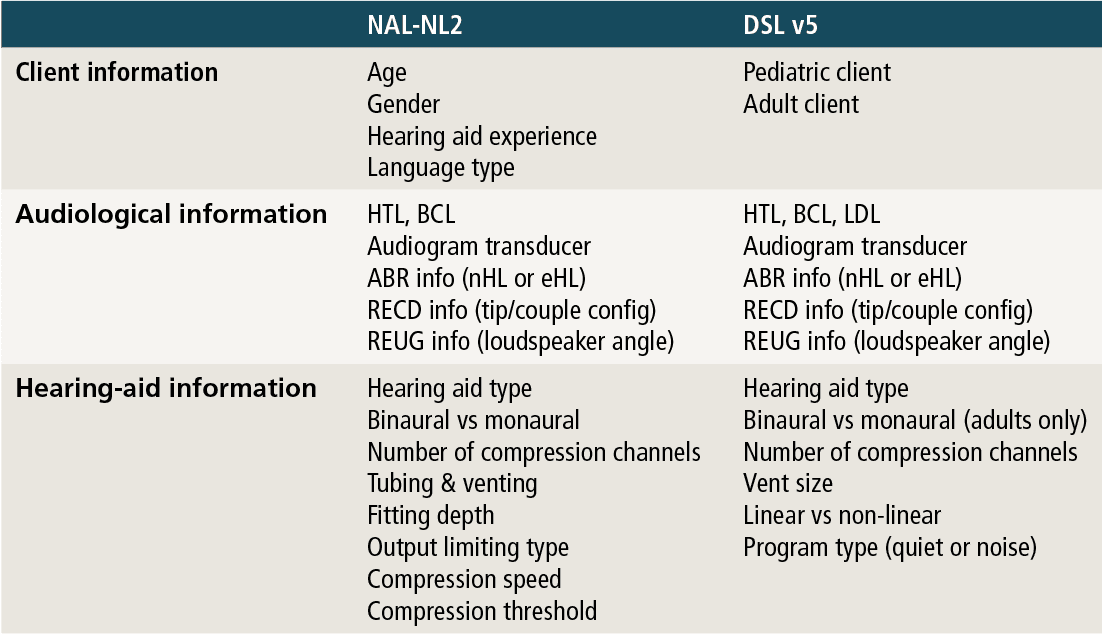
Table 2. Overview of information used by the NAL-NL2 and DSL v5 fitting rationales to prescribe the fitting target.
Figure 2 shows examples of the differences in the NAL-NL2 targets for real-ear insertion gain (REIG) when fitting an experienced versus a new hearing aid user, and when performing a binaural versus a monaural fitting. The difference in REIG target between a monaural and a binaural fitting is 4 dB, and the difference between fitting a new user and an experienced user is up to 3 dB (for the hearing loss used in the example). If the HCP performs a “match to target” verification of a NAL-NL2 fitting set to reduce gain for a “new user,” while the setting in the REM system is defaulted to “experienced user,” the hearing aid may end up providing more gain than needed. Even though the HCP may fine-tune the hearing aid after completion of the real-ear measurement, the starting point for the remainder of the fitting would provide a greater loudness perceived by the user than prescribed by the rationale.
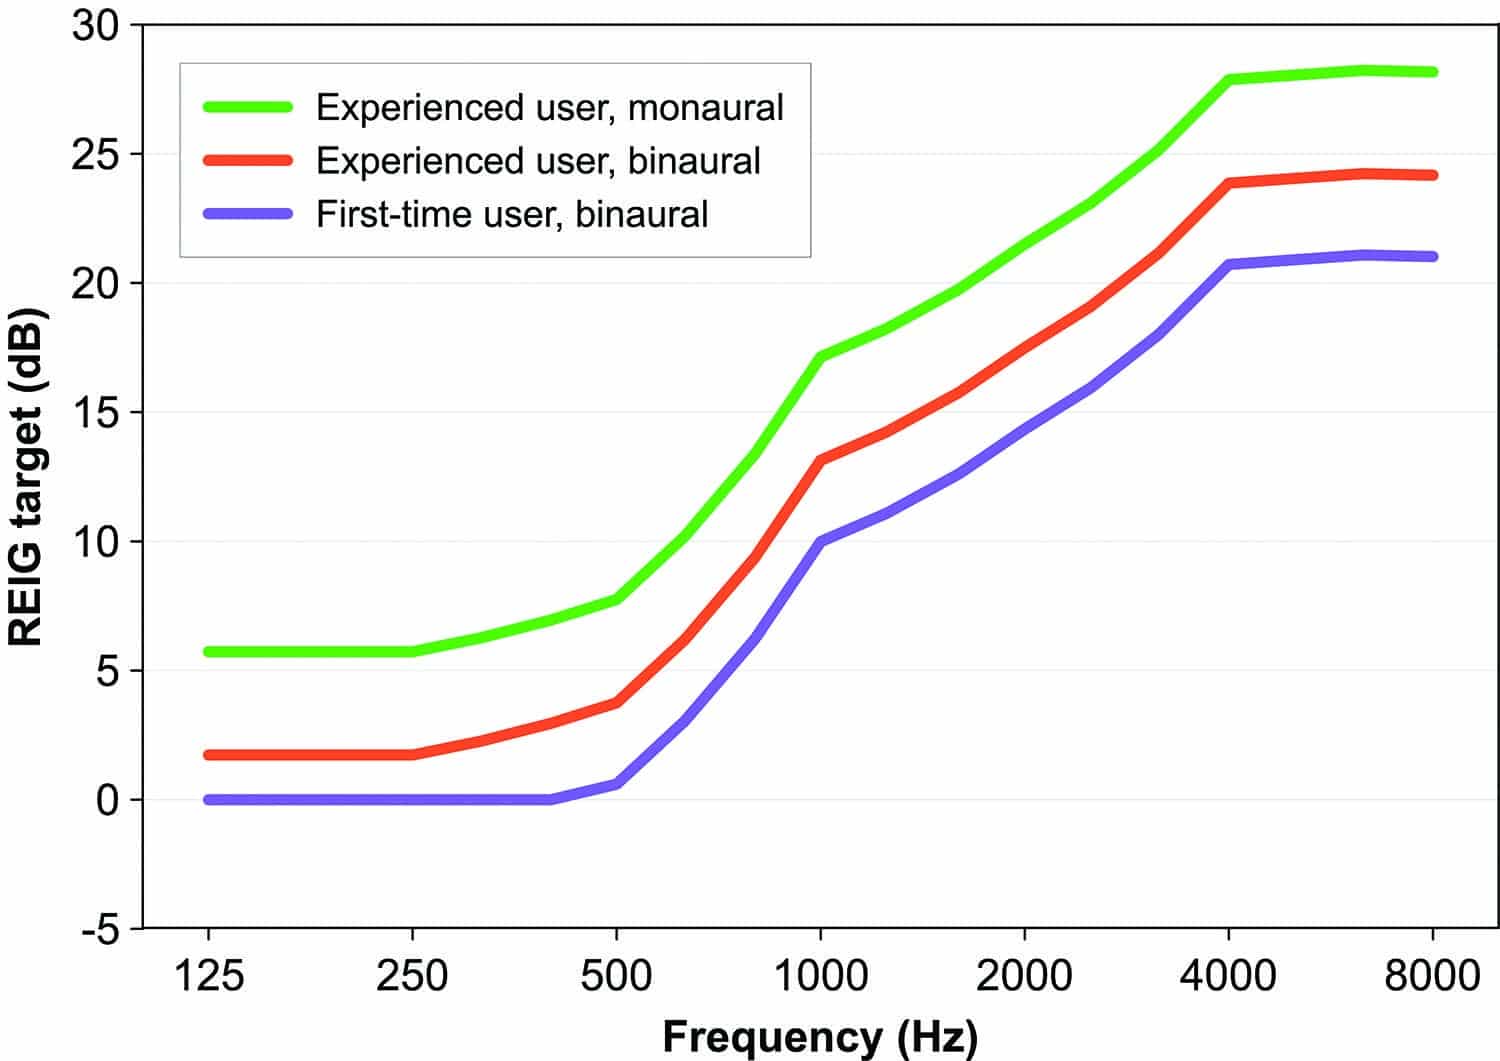
Figure 2. NAL-NL2 REIG targets for experienced users fitted monaurally and binaurally, and for first-time users fitted binaurally.
Variations in Probe-tube Placement
An important prerequisite for making valid real-ear measurements is that the probe-tube microphone is appropriately calibrated and positioned correctly in the ear canal. Ideally, the probe tip should be placed at the eardrum, which is the position where the rationales prescribe gain and output. However, due to the physical discomfort created when the probe tip touches the eardrum, it is necessary to position the probe tip at some safe distance from the eardrum.
The distance sets an upper limit of the frequencies at which valid measurements can be made. This is due to standing waves in the ear canal caused by the interaction between incident and reflected sound waves. At a distance 1/4 wavelength from the eardrum, the two waves will be 180° out of phase (assuming no phase shift occurs when the sound is reflected at the eardrum). This will give rise to a dip in the frequency response at the frequency corresponding to the wavelength. For example, a 6 kHz sound has a quarter-wavelength of 14.8 mm, and a probe tip therefore has to be much closer to eardrum in order to provide a correct estimate of the 6 kHz sound pressure at the eardrum. The 1/4-wavelength effect may be used to estimate the distance from probe tip to eardrum.12,13 When implemented in a REM system, this type of method may assist the clinician in finding the right position of the probe tip.
Implications for Using Generic Rationales
From the discussion above, it follows that there are many potential errors that can occur when setting up a REM system before performing hearing aid verification. The HCP needs to know the REM equipment very well and needs to be aware of the relevance of the many settings available—both in regard to the chosen fitting rationale and the measurement parameters of the system.
Additionally, all REM systems are different and give the HCP access to different numbers of settings. Some REM systems have fewer settings and focus more on providing a simple user-friendly interface with a fixed measurement setup. Other systems focus on flexibility and have all the options described above in their settings.
All this also points toward the need for hearing aid manufacturers to provide a first fit that is as precise as possible. If the HCP selects a generic fitting rationale in the fitting software, this should always be followed up by verifying the fitting using clinical REM. But there may be situations where the HCP does not have the time for REM, or does not have access to a REM system in their clinic—and therefore needs to rely on the precision of the fitting provided by the hearing aid fitting software itself. Therefore, it is the manufacturer’s task to implement the fitting rationale such that a “match to target” is achieved in the majority of cases, without the need for excessive fine tuning.
Verification of Match to Target
The Widex fitting protocol aims at providing the best possible precision of the first fit relative to the chosen fitting target. To achieve this, the fitting procedure includes two vital in-situ measurements obtained with the hearing aid:
1) The feedback test,9 and
2) The Sensogram or in-situ threshold measure.8
Taken together, these two measurements help improve the fitting precision in three different ways. The feedback test optimizes the online feedback canceling system and thereby increases gain stability of the hearing aid in the ear. The feedback test also provides data for the Assessment of In Situ Acoustics (AISA) systems that compensate for the vent effect from the earmold. Finally, the Sensogram measurement takes the individual acoustical properties of the hearing aid’s coupling to the ear into count, when establishing the hearing thresholds used for the target gain calculations.
To investigate how well the Widex Unique hearing aid matches the target when fitted to the NAL-NL2 rationale, we performed REM measurements on 30 adult ears with various degrees of hearing loss and then compared them to the target. The distribution of hearing losses across the test ears are shown in Figure 3.
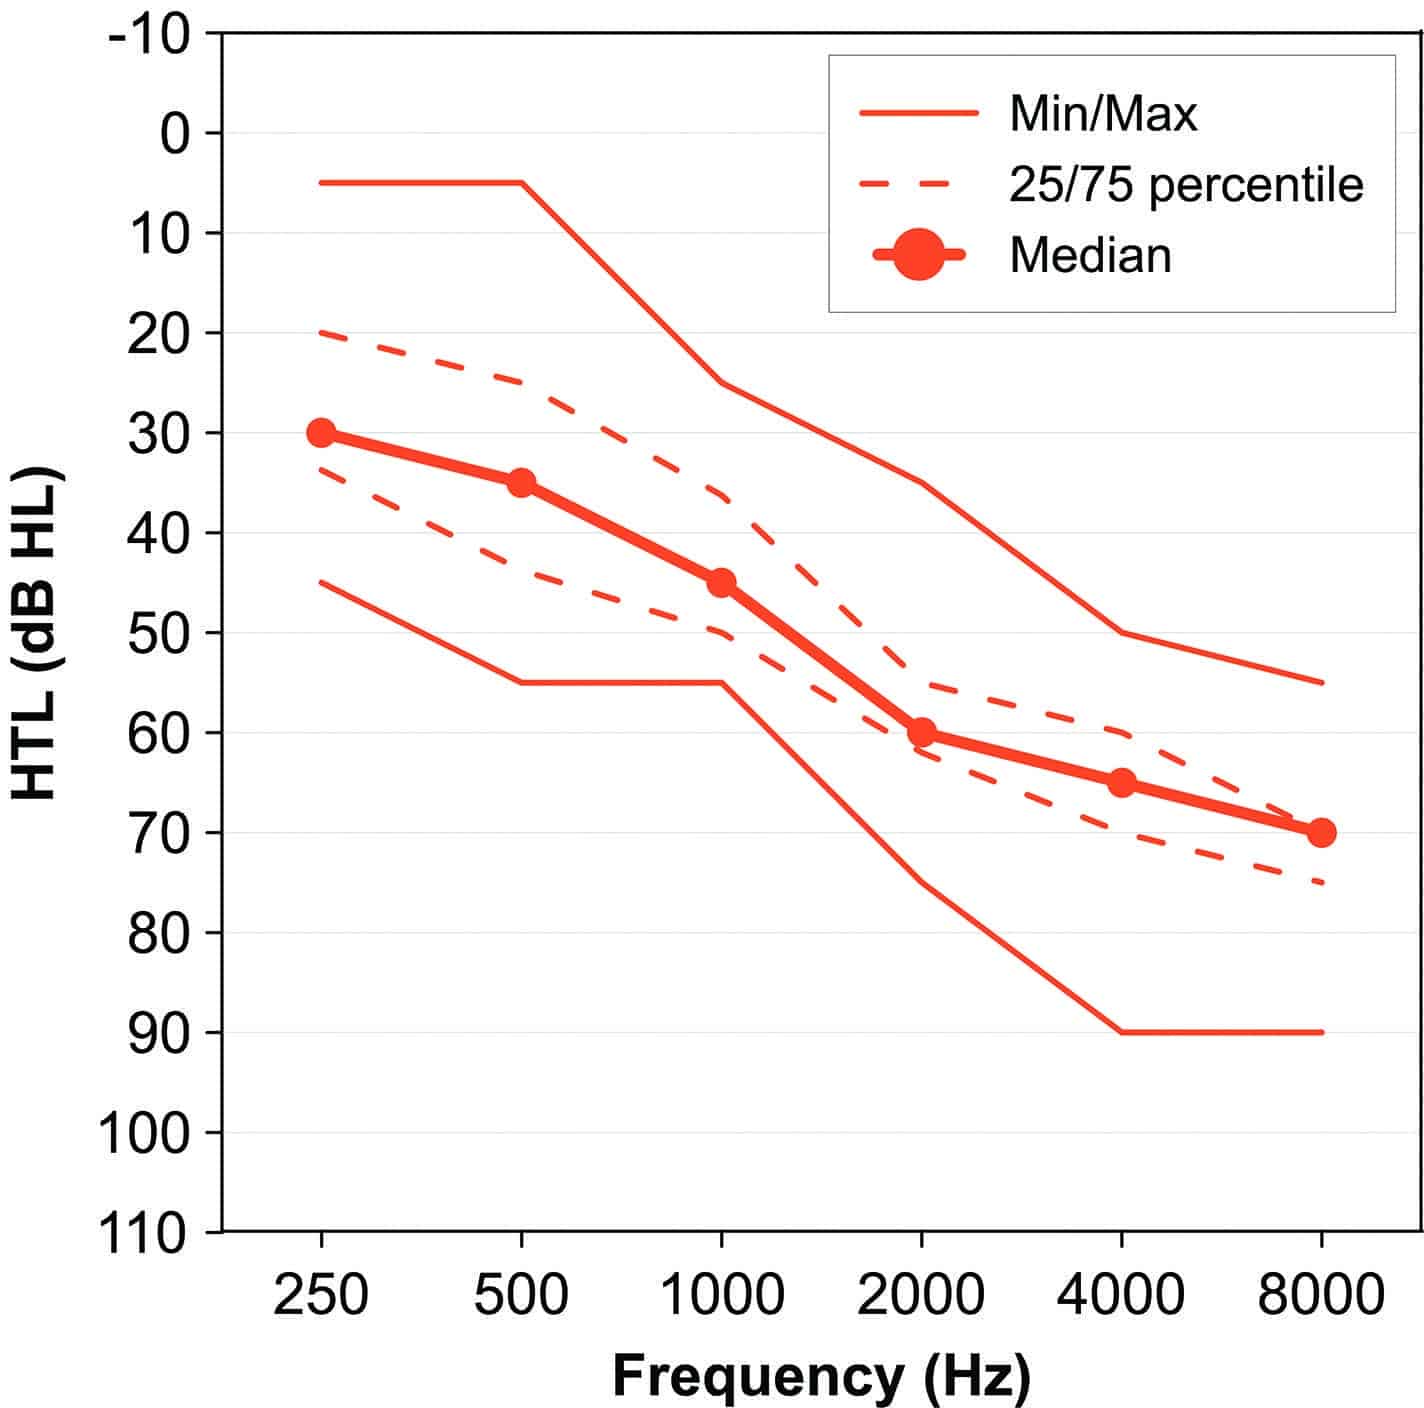
Figure 3. Hearing threshold levels measured using TDH-39 headphones. The curves show minimum, 25th percentile, 50th percentile (median), 75th percentile, and maximum HTL across the 30 test ears.
The test ears were fitted with different models of Widex Unique hearing aids. In total, 22 ears were fitted with Unique Fusion RIC BTEs, 4 ears with Unique Fashion BTEs, and 4 ears with Unique XP ITEs. The RIC hearing aids were fitted with different types of ear-tips: 14 were fitted with instant ear-tips (4 open, 6 tulips, and 4 double dome) and 8 were fitted with custom soft ear-tips. Likewise, the 4 BTE hearing aids were fitted with custom-made earmolds. Based on the audiometric configurations of the test ears, loss-appropriate vent diameters were applied in the individual fittings.
In the Widex Compass GPS (v2.3) fitting software, we conducted the feedback test and obtained an in-situ Sensogram with the hearing aids in the subject’s ears. After measuring the Sensogram, we then selected the NAL-NL2 rationale in Compass GPS, including the selections of gender, hearing aid experience, and language type of the test subjects. We then performed a first fit with this prescription based on the Sensogram thresholds. No further fine-tuning of hearing aid gain settings was made.
Based on the available data, Compass GPS calculates the NAL-NL2 targets and estimates the REAR at three different input levels (55, 65, and 80 dB SPL). The targets and estimated responses can be seen in the Output-vs-frequency graph in the fine-tuning screen in Compass GPS (see example in Figure 4).
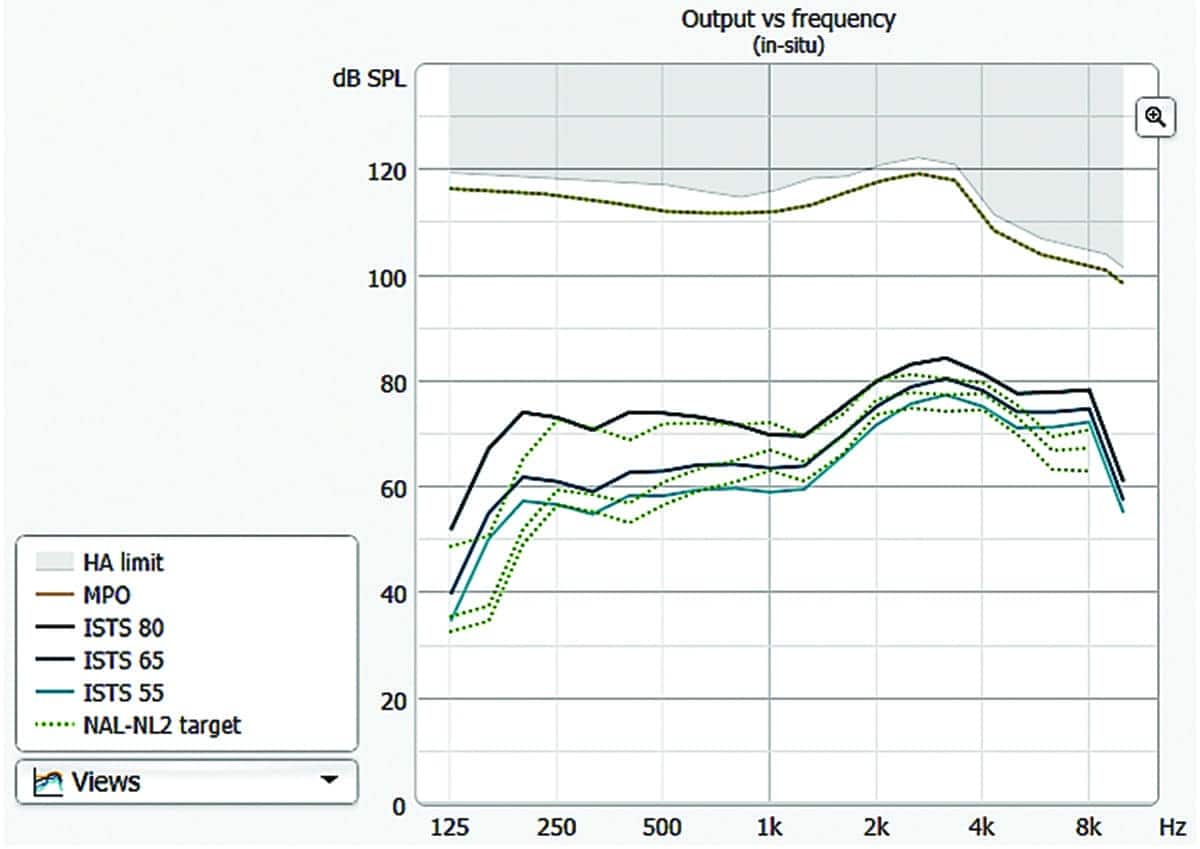
Figure 4. Example of a NAL-NL2 fitting in Widex Compass GPS. The Output vs. frequency graph display the NAL-NL2 target (green dotted curves) together with the estimated aided responses (solid curves) for the ISTS signal presented at 55, 65, and 80 dB SPL input level (free field).
The Interacoustics Affinity clinical REM system was used for verification in this study. The built-in loudspeaker in the Affinity system was used to present the sound stimuli. The Affinity headset, including reference and probe microphones, were connected to the test box. The Affinity system is controlled via a software suite running on a Windows PC.
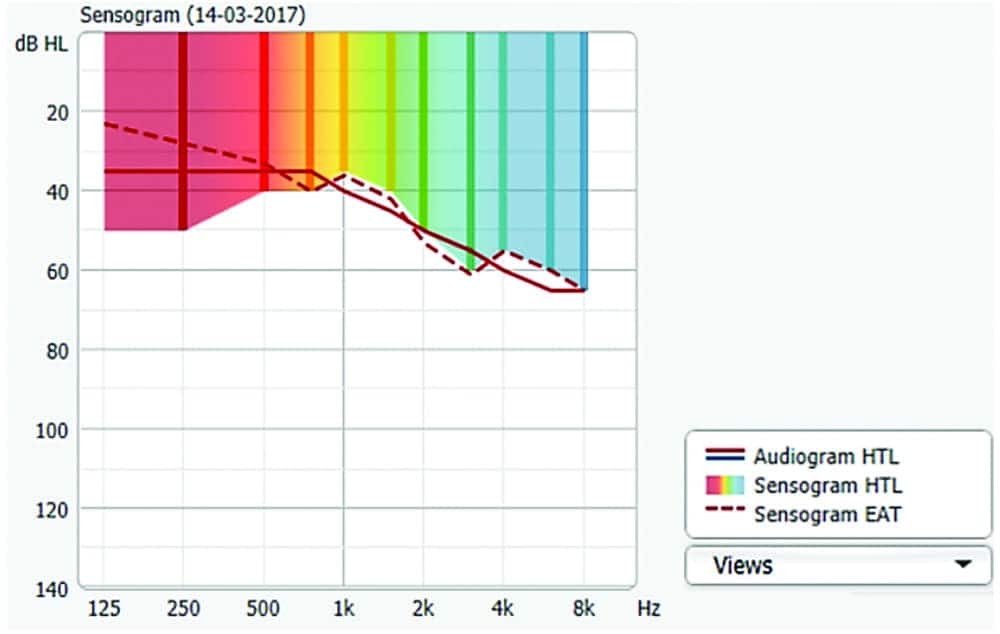
Figure 5. Example of the Sensogram display in Compass GPS (v2.3). The vent-corrected Sensogram thresholds (dotted curve) is shown by selecting the “Sensogram EAT” option in the “Views” menu.
Prior to the real-ear measurements, the vent-corrected Sensogram thresholds measured in Compass GPS were entered into the audiogram module in the Affinity software suite. The vent-corrected thresholds can be found in the Sensogram screen in Compass GPS by selecting the “Sensogram EAT” option in the view menu (Figure 5). When selected, a dotted curve appears in the Sensogram graph, showing the Sensogram thresholds corrected for the vent effect. By entering the vent-corrected thresholds into the Affinity system, the NAL-NL2 targets in the Affinity would be calculated from the same in-situ Sensogram thresholds applied for the NAL-NL2 fitting in Compass GPS.
In the Affinity software suite (v2.8), the settings shown in Table 3 were selected for the NAL-NL2 fitting prescription. This was to be consistent with the settings applied for the NAL-NL2 fitting in Compass GPS and for the hearing aid type selected for the given test subject.
Note that NAL-NL2 target calculation depends on whether the compression speed is fast, slow, or dual (combination of slow and fast). The NAL-NL2 target curve for speech is modified (up to 5 dB) depending on the selection of compression speed; the slow setting will, for example, prescribe a more linear fitting. The implementation of NAL-NL2 in Widex hearing aids applies the slow speed option. Therefore, this setting should be selected in the Affinity fitting prescription screen. This is an example of a REM setting where the HCP is required to know exactly what compression speed is applied in the hearing aid. This information may not always be available—either in the fitting software or provided from the hearing aid manufacturer. In these cases, the HCP will need to ask the manufacturer for this information in order to select the correct setting.

Table 3. NAL-NL2 prescription settings applied in the Affinity software suite (v2.8) for the measurements in the present study.
After setting up all parameters in the Affinity as described above, the resulting NAL-NL2 targets prescribed in the Compass GPS software and in the Affinity software should ideally be identical for the 30 test ears in this study. Figure 6 shows the average difference between the NAL-NL2 targets shown in Compass GPS and the NAL-NL2 target displayed in the Affinity software for the ISTS signal at 55 and 65 dB SPL.
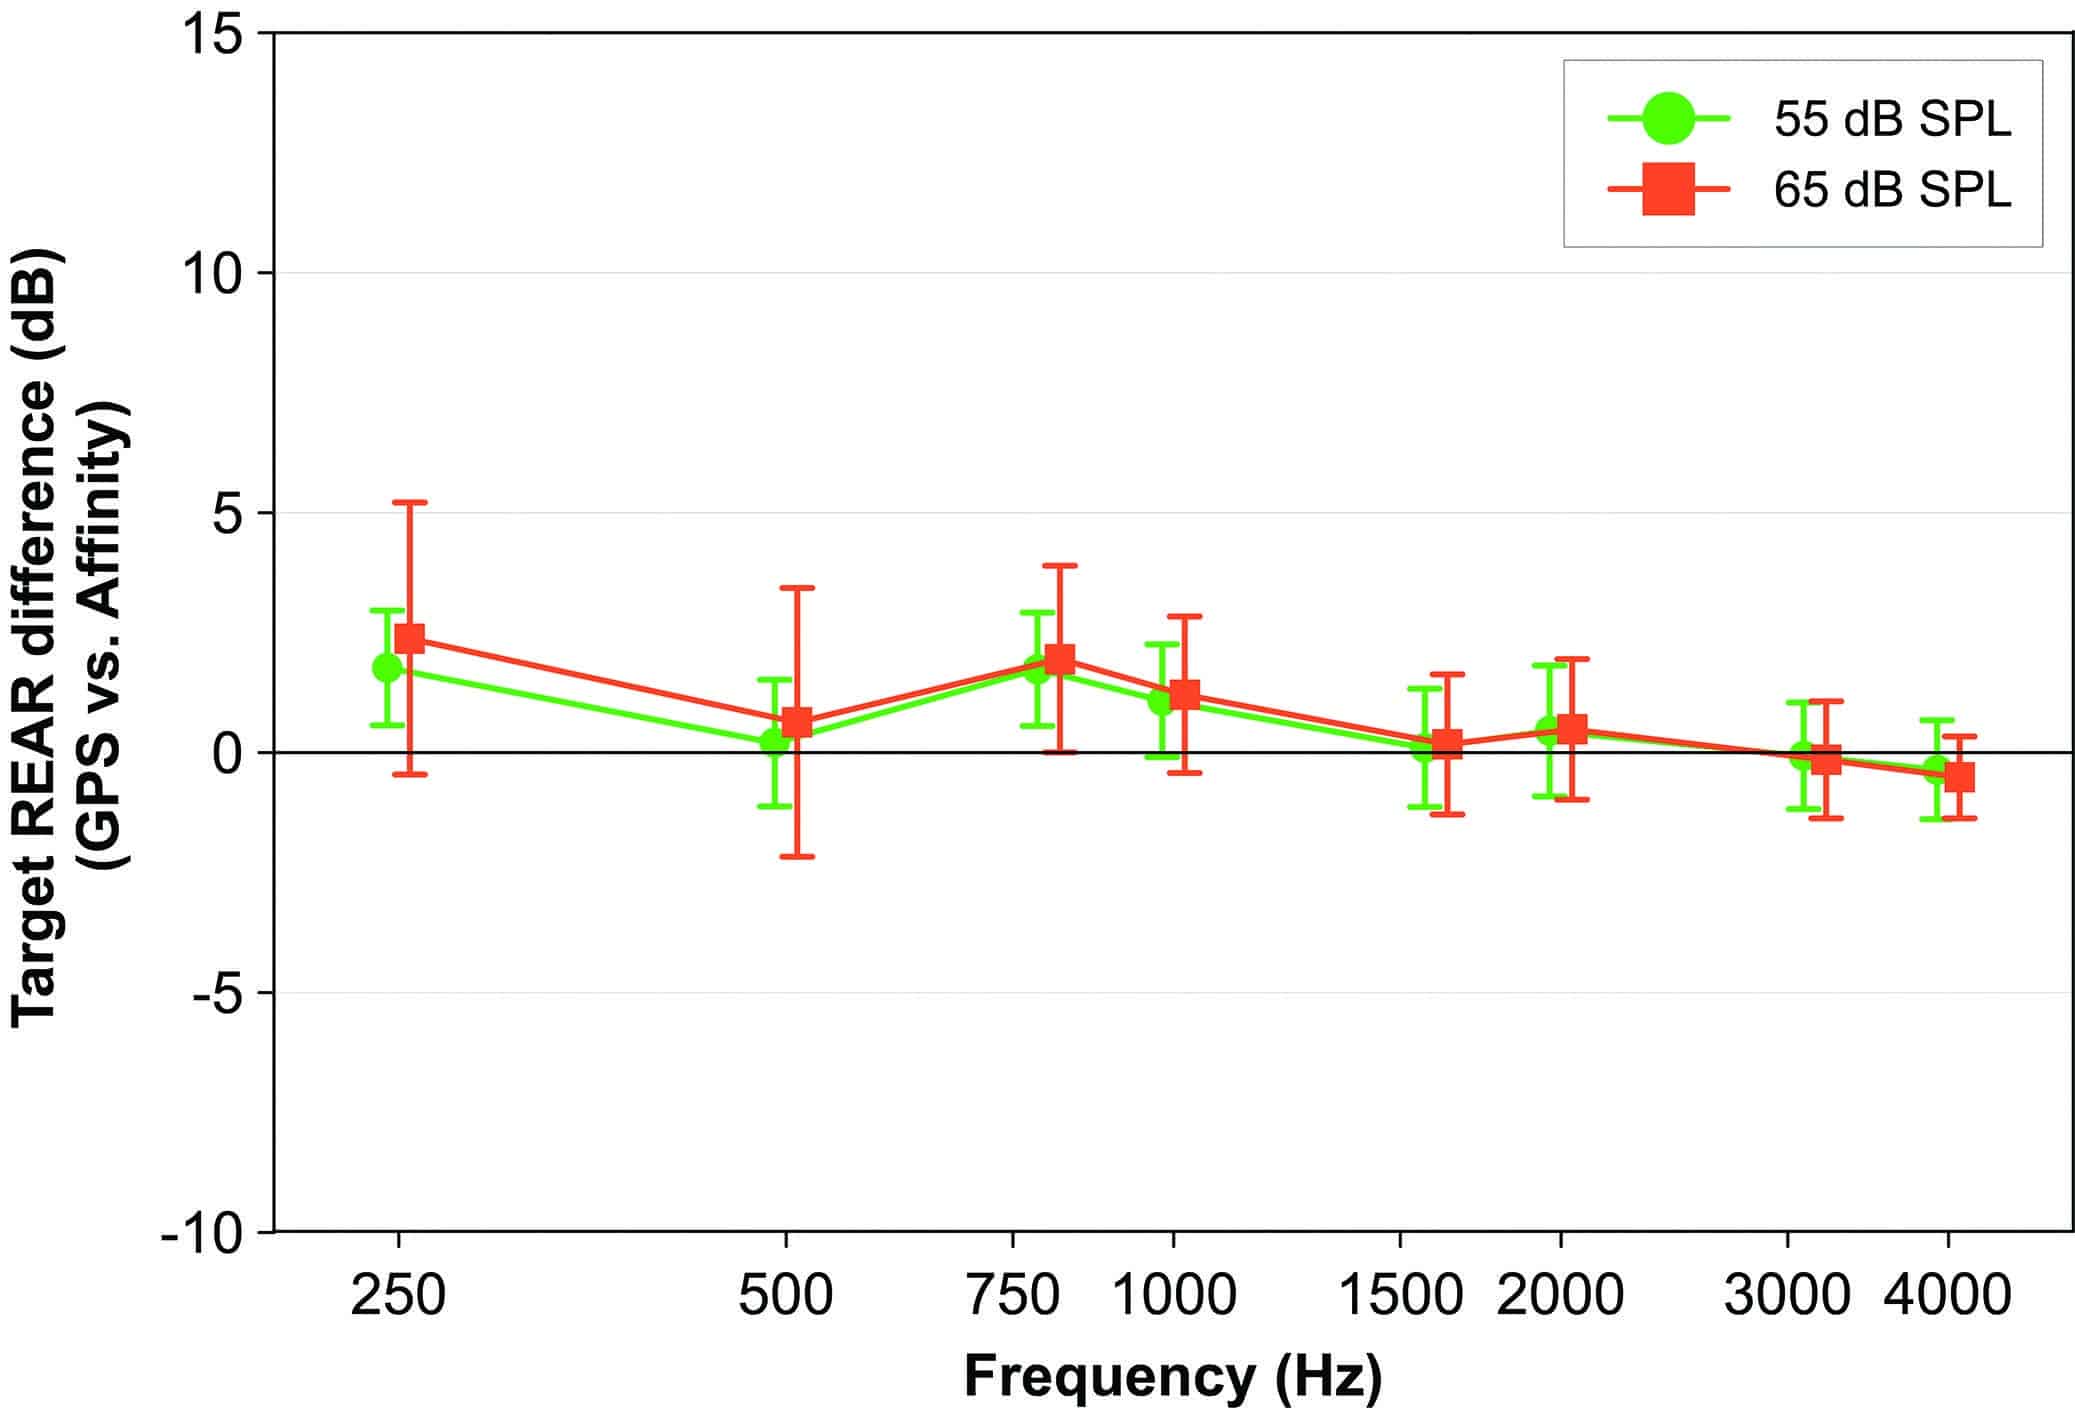
Figure 6. Average difference across 30 fittings between NAL-NL targets prescribed by Compass GPS and Affinity at 55 and 65 dB SPL input, at the 1/3-octave frequencies closest to the audiometric frequencies. Error bars indicate one standard deviation.
It can be seen that, on average, the Compass GPS and the Affinity system agrees with the NAL-NL2 target within 2 dB for the fittings made in this study. The observed deviations are expected to be caused by a combination of various differences in the two systems (eg, in the acoustic transformations used in the target calculations, rounding of values, etc).
For each of the 30 test ears, a measurement of the REAR was obtained with the ISTS signal presented at 55 and 65 dB SPL. The Affinity system was set to measure the REAR with a resolution of 1/3 octave, which is consistent with the resolution used for displaying target and estimated response curves in Compass GPS. The preconditioning time was set to 10 seconds and the averaging time was 20 seconds. Thus, each measurement had a total duration of 30 seconds.
As mentioned previously, the validity of a real-ear measurement requires a correct positioning of the probe tube in the ear canal. In this study, the probe tube was inserted into the ear canal such that the tip of the tube was no more than 5 mm from the eardrum. The position of the probe tube was verified with otoscopy inspection without the hearing aid in place. The hearing aid was then inserted into the subject’s ear, while maintaining the position of the probe tube (Figure 7).
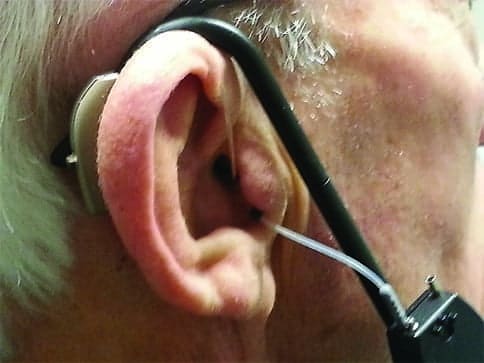
Figure 7. Measurement set-up with test hearing aid and probe tube in place.
Figure 8 shows the average difference between the measured REAR and the NAL-NL2 target shown on the Affinity display, for the ISTS signal at 55 and 65 dB SPL. Positive and negative values indicate that the average REAR was higher or lower than the prescribed target, respectively.
For both soft (55 dB SPL) and average (65 dB SPL) input levels, the REAR averaged across all 30 ears is within 4 dB of the target. The largest deviation is observed for the soft input signal at 3000 Hz where the measured output is 3.9 dB below the target. This indicates a substantially better match than the general pattern observed in the study by Sanders et al,7 where the average REAR of 4 out of 5 hearing aids was 10 dB or more below the target at 3000 Hz. At 500 Hz, the Unique REAR is around 2-3 dB above target. This is also in contrast to the study by Sanders et al where all 5 hearing aids had an average REAR below target, and where the deviation was 8-10 dB for 3 of the devices.
While the most common guidelines for hearing-aid fitting recommend the use of REM verification,4,5 they do not provide the exact guidelines on what an acceptable deviation between target and measured outcome values should be. In order to assess whether the deviations shown in Figure 8 are of an acceptable magnitude, a comparison was made to the real-ear verification guidelines suggested by the British Society of Audiology (BSA). These guidelines14,15 prescribe acceptable deviations of ±5 dB between 250-2000 Hz and ±8 dB at 3000-4000 Hz. Thus, if the measured real-ear response is within these limits, relative to the target, a satisfactory “match to target” is obtained.

Figure 8. The difference between measured REAR and NAL-NL2 target, averaged across 30 measurements, at the 1/3-octave frequencies closest to the audiometric frequencies, at 55 and 65 dB SPL input. Error bars indicate one standard deviation.
The data in Figure 8 show that the average deviation between target and measured REARs is well within the BSA tolerance limits. As indicated by the error bars in the figure, some individual measurements were outside the limits. In the low-mid frequencies, the reason for this is typically a larger vent in the earmold or an open earmold, allowing direct sound to enter the ear canal, and at the same time creating a Helmholtz resonance in the mid-frequency region.
Likewise, at the higher frequencies, some individual measurements were below the BSA limit of -8 dB. This is likely caused by gain limitations set by the feedback test due to a larger vent or leakage caused by the earmold/eartip pressing against the probe tube.
Overall, the average deviations from the NAL-NL2 target in Figure 8 indicate a good “match to target” for the NAL-NL2 fittings performed in this study. This is the case both at the soft input levels (55 dB SPL) where the gain in the hearing aid is highest, and at the level of normal vocal effort (65 dB SPL). The average deviation from the fitting target is within the limits suggested by the BSA,14,15 and it is smaller than the average deviations reported for the hearing aids included in the study by Sanders et al.7
Comparing Actual REARs with Estimated Curves in Compass GPS
As discussed earlier, the complexity in setting up the REM system poses a challenge for the HCP. Several settings related to the fitting rationale and the hearing aid chosen for the given person need to be set correctly in the REM system. Any error or inconsistency may result in the “wrong” target being matched to invalidate the measurement. Therefore, it is of great value if the estimated response curves shown in the hearing aid fitting software provide an accurate estimate of the actual hearing aid gain and output in the ear canal.
Figure 9 shows the average difference between the estimated REAR curves shown in the output-vs-frequency graph in Compass GPS (v2.3) and the REAR measured in this study with the Interacoustics Affinity system. A positive dB-value indicates that the average estimated REAR in Compass GPS was higher than the average measured REAR, while a negative value indicates that the estimated REAR was lower than the measured REAR.
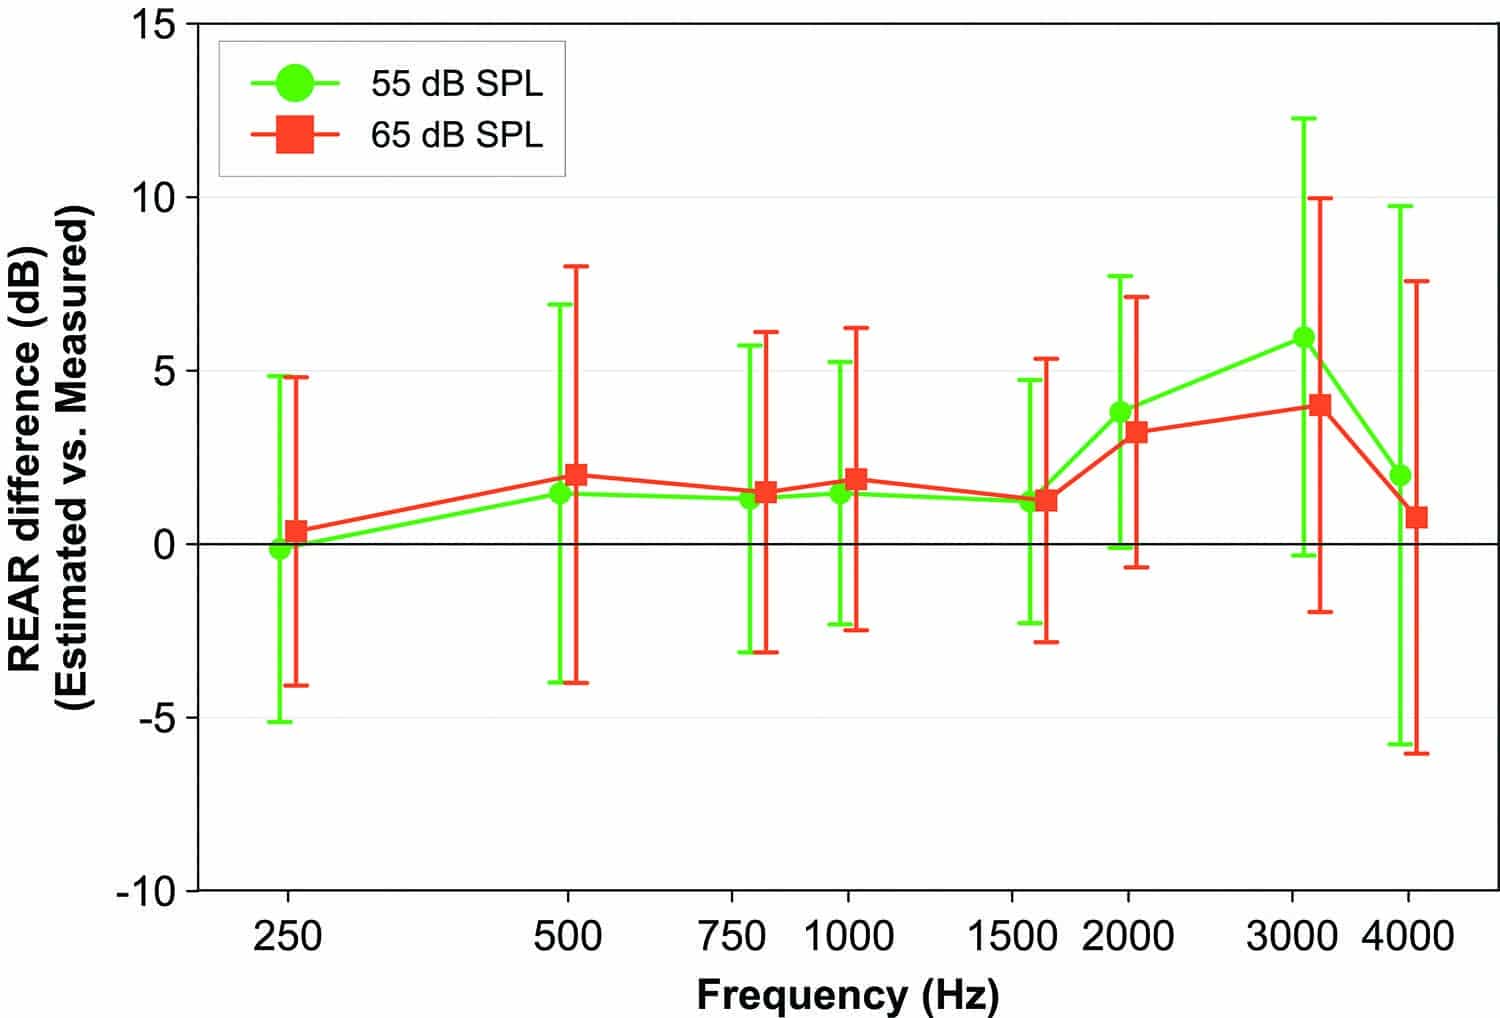
Figure 9. Difference between estimated REAR in Compass GPS and the REM-measured REAR, averaged across 30 measurements, at the 1/3-octave frequencies closest to the audiometric frequencies, at 55 and 65 dB SPL input. Error bars indicate one standard deviation.
It can be seen that the deviation is no greater than 2 dB in the frequency region from 250-1500 Hz, and no greater than 6 dB from 1500-4000 Hz. Thus, based on the results in this study, the estimated REAR curves shown in the Compass GPS software are on average within 5-6 dB of the response that would be measured if REM verification was carried out in the real ear. It should be noticed that the variation (as indicated by the error bars in Figure 9) increases at the highest frequencies due to the combined effect of increasing variation in individual real-ear acoustics and decreasing reliability of the real-ear measurement. This may explain part of the deviation between estimated and measured REAR. Another reason may be systematic differences between quantities (eg, acoustic transformations) used in the GPS software to estimate the REAR and the similar quantities in the actual REM system. Such differences will not be removed by an appropriate choice of REM-system settings.
The results shown in Figure 9 indicate that, in cases where the HCP does not have access to a REM system in the clinic, or does not have the time to perform real-ear measurements, the target and estimated response curves in Compass GPS offer an alternative for the HCP to evaluate the degree of match to target and the need for fine-tuning of the hearing aid. Similar findings on the consistency between real-ear measures and the performance displays in Compass GPS have been shown by Oeding and Valente16 who found that nearly 85% of the differences between the estimated sensation levels shown in the Compass SoundTracker display and sensation levels measured with the Audioscan Verifit and Frye 6500 systems were within 2 dB of each other.
Conclusion
Real-ear verification is considered a “best practice” when fitting hearing aids. However, factors related to both the fitting rationale and the hearing aid chosen for a given wearer need to be considered when setting up the REM system for verification measurements.
In this study, a clinical verification approach was applied to verify the implementation of the NAL-NL2 rationale in the Widex Unique hearing aid. The average deviation between the aided response and the NAL-NL2 target output was found to be within the tolerance limits suggested by the BSA at all frequencies, with the greatest average deviation being -3.9 dB at 3000 Hz. This is a much smaller deviation from the target than that seen in a previous study7 where it was reported that the average REM-target REAR difference for 4 out of 5 hearing aids was more than 10 dB at 3000 Hz.
A comparison of the REAR estimated in the fitting software and the REAR measured with the REM system showed that, on average, the aided response curves shown in Widex Compass GPS are within 5-6 dB of the response that would be measured if a REM were carried out in the listener’s ears.
Correspondence can be addressed to HR or Dr Schmidt at: [email protected]
Citation for this article: Schmidt E, Caporali S, Jensen NS. Match to target: how to get accurate first fits. Hearing Review. 2017;24(8):16-27.
Biography: Erik Schmidt, PhD, is Technical Audiology Specialist, Sueli Caporali, PhD, is Technical Audiology Specialist, and Niels Søgaard Jensen, MSc, is Senior Audiological Affairs Specialist at Widex A/S, Lynge, Denmark.

References
-
Dillon H. Hearing Aids. 2nd ed. New York City: Thieme;2012.
-
Keidser G, Dillon H, Carter L, O’Brien A. NAL-NL2 empirical adjustments. Trends Amplif. 2012;16: 211-223.
-
Scollie S, Seewald R, Cornelisse L, et al. The Desired sensation level multistage input/output algorithm. Trends in Amplif. 2005;9(4):159-197.
-
Valente M, Bentler R, Kaplan HS, Seewald R. Guidelines for hearing aid fitting for adults. Am J Audiol. 1998;7:5-13.
-
Valente M, Abrams H, Benson D, et al. Guidelines for the audiologic management of adult hearing impairment. Audiology Today. 2006;18:32-37.
-
Hawkins DB, Cook JA. (2003) Hearing aid software predictive gain values: How accurate are they? Hear Jour. 56: 26-34.
-
Sanders J, Stoody T, Weber J, Mueller H. Manufacturers’ NAL-NL2 fittings fail real-ear verification. Hearing Review. 2015;22(3)[Mar]:24-32. Available at: https://hearingreview.com/2015/02/manufacturers-nal-nl2-fittings-fail-real-ear-verification/
-
Kuk FK, Ludvigsen C, Sonne M, Voss T. Using in-situ thresholds to predict aided soundfield thresholds. Hearing Review. 2003;10: 46-51. Available at: https://hearingreview.com/2003/05/using-in-situ-thresholds-to-predict-aided-soundfield-thresholds
-
Kuk F, Nordahn M. Where an accurate fitting begins: Assessment of In-Situ Acoustics (AISA). Hearing Review. 2006;13(7):60-68. Available at: https://hearingreview.com/2006/07/where-an-accurate-fitting-begins-assessment-of-in-situ-acoustics-aisa
-
Mueller HG, Hawkins DB, Northern JL. Probe Microphone Measurements: Hearing Aid Selection and Assessment. San Diego: Singular Publishing;1992.
-
Holube I, Fredelake S, Vlaming M, Kollmeier B. Development and analysis of an international speech test signal (ISTS). Int J Audiol. 2010;49:891-903.
-
Searchfield GD, Purdy SC. Probe microphone placement for real ear measurement update on a simple acoustic method. Am J Audiol. 1997;6: 49-54.
-
Storey L, Dillon H. Estimating the location of probe microphones relative to the tympanic membrane. J Am Acad Audiol. 2001;12:150-154.
-
British Society of Audiology. Guidance on the use of real ear measurement to verify the fitting of digital signal processing hearing aids. 2007. Available at: http://www.thebsa.org.uk/wp-content/uploads/2014/04/REM.pdf
-
Gatehouse S, Stephens SDG, Davis AC, Bamford JM. Good practice guidance for adult hearing aid fittings and services. BAAS newsletter. 2001; Issue 36.
-
Oeding K, Valente M. Differences in sensation level between the Widex SoundTracker and two real-ear analyzers. J Am Acad Audiol. 2013;24:660-670.


Spot on. I have used fitting software for Oticon, Siemens and Phonak for over ten years and am a frequent user of coupler measures to test hearing aid gain. It has been pretty clear to me that (for at least the last 2 years) the fitting software estimated gain values are pretty accurate. Accurate enough to mean that there is now more time available in a session to work together with the patient on meeting their needs.