
Research | January 2018 Hearing Review
We do not have a symmetrical auditory system, and this poses some interesting questions.
For good reasons, the auditory system of humans evolved with a right-ear advantage (or left-ear disadvantage) as speech processing required more of the brain. This article takes readers on an extraordinary journey of the auditory system and looks at some of the interesting implications of right-ear advantage in terms of binaural processing, speech understanding, and amplification.
Many people find it difficult to believe that the auditory system is not in perfect symmetry. They cannot accept that one ear may be in any way different from the other. But that is, indeed, the case. It is well established that speech recognition is accomplished somewhat differently for right-ear input than for left-ear input. This is the story of the “right-ear advantage” (REA). It will take us on an extraordinary journey within the auditory nervous system.
Blame It on Evolution
We can imagine that, at an earlier point in evolutionary time, the total auditory system was pretty much symmetric in primates, other mammals, and various lower forms of animal life. Indeed, a symmetric system was ideal for the uses to which their auditory systems were tasked, mainly azimuth directionality and the creation of auditory space—the “stereophonic effect.” For animals in the wild, the name of the game has always been survival: eat and avoid being eaten. The two-eared system is exquisitely designed to handle this issue. For directionality purposes, the two ears provide the necessary information in the form of interaural time and intensity differences. These data from the two ears are compared in the brainstem, leading to a calculation of the azimuth in the horizontal plane from which the sound of interest appears to be located. After visual analysis of the nature and size of the intruder, it is usually a question of fight or flight.
An Evolutionary Modification
In the case of humans, the originally symmetric auditory system has been considerably modified. Over the past 50 million years, we humans have evolved the ability to produce and perceive speech sounds; initially syllables, which could then be combined into words, and the words into sentences, all forming a vehicle for the human crown jewel: spoken language. Not surprisingly this took a bit of doing. Speech production is a complex phenomenon. You can think of it as a stream of acoustic energy that changes over time in two ways:
1) Very rapid (in the range of milliseconds) changes in amplitude and frequency, and
2) Relatively slower (in the range of seconds) changes in the overall energy envelope.
The former conveys information defining vowel and consonant sequences; the latter conveys the prosodic features of phrases and sentences.
And here is where we diverge from the original symmetry of the total auditory system. Portions of the auditory cortex in the left hemisphere evolved to process the rapid amplitude and frequency changes in the acoustic stream. Similarly, portions of the auditory cortex in the right hemisphere evolved to process the slower changes in the overall acoustic envelope.
The finer details of these processes are, inevitably, somewhat more complex than this simple picture would suggest, but for our present purposes—the analysis of the right-ear advantage—they will do. Since it is the rapid changes in amplitude and frequency that carry most of the basic intelligibility information in the speech waveform, the left hemisphere became the dominant hemisphere for speech recognition, whereas the right hemisphere became the dominant hemisphere for the processing of slower changes over time (eg, the stress patterns of ongoing speech).
Dichotic Listening and REA
The bulk of audiological research in speech understanding has involved measures of recognition of single-syllable words. Typically a word, usually a consonant-vowel-consonant (CVC), is presented; the listener’s response is scored as either correct or incorrect. Since it is difficult to impart prosody to single-syllable words, successful repetition of the word requires only a phonological analysis of the very rapidly changing events that determine which two consonants, initial and final, and which vowel were heard. These are precisely the features for which the left hemisphere has become specialized. It is a very successful phonological processor.
Now it happens that both ears are ultimately connected to the left-hemisphere processor, but because of the way the ears are connected to the brain hemispheres, the input from the right ear reaches the left hemisphere slightly earlier than the left-ear input. This gives the right ear a slight advantage when both ears are stimulated simultaneously (dichotically).
This REA was first described in a test of dichotic listening. The dichotic listening paradigm was pioneered by an English psychologist, Donald Broadbent (1926-1993). He presented pairs of digits dichotically, that is a different digit to each ear simultaneously. For example the word “three” to one ear and, simultaneously, the word “eight” to the other ear. He employed this procedure to study attention and short-term remembering, but did not compare the accuracy of the two ears.
Doreen Kimura (1933-2013) was a graduate student in the neuropsychology laboratory of Brenda Milner at the Montreal Neurological Institute in the early 1960s. Kimura and Milner recorded their own dichotic digits’ test with the aim of applying it to patients with temporal lobe epilepsy. But, as students of brain injury, they were aware of the need to separate data by ear. They instructed the listener to repeat back everything heard in both ears, but then separated right-ear from left-ear responses. However, before embarking on the testing of epileptic patients, Kimura1 tested a group of young normal controls to establish norms. Surprisingly, she found that, in the normal group, correct responses to the dichotically-presented digits were, on average, slightly better for digits presented to the right ear than for the same digits presented to the left ear. This small REA—also known as “left-ear disadvantage” or LED—has been studied extensively over the last half-century. It has been demonstrated with nonsense syllables, digits, CVC words, and even artificial sentences.
The Structural Model of Dichotic Listening
In order to explain the REA/LED, Kimura1 suggested what has come to be called the “structural model” of the auditory system. The model is based on the fact that there are both crossed and uncrossed pathways from each ear to each hemisphere, and that when both ears are stimulated simultaneously, the uncrossed paths are suppressed; only the crossed paths are active. This means that input to the right ear travels directly to the left-hemisphere processor via the crossed path from right ear to left hemisphere, but the input to the left ear must travel first to the right hemisphere, then cross over to the left hemisphere speech processor via the corpus callosum, the neural bridge between the two cerebral hemispheres. This introduces a very slight delay and loss of efficiency of the left ear input—not much, but enough to account for the small REA/LED noted above. Note that the problem resides in neither hemisphere, but in the bridge between them, the corpus callosum.
An Electrophysiological Demonstration of Left–Hemisphere Specialization for the Processing of Rapid Temporal Changes in Words
Although the specialization of the left hemisphere for the processing of speech was long evident from the study of many individuals with brain injury, it is actually possible, by means of auditory event-related potentials (AERPs), to quantify the difference in time between the arrival of the right and left ear speech inputs at the left hemisphere speech processor. In a simple experiment with complicated data analysis, my colleague Jeffrey Martin and I (2004)2 collected AERP data in 10 young adults with normal hearing. It was a dichotic-listening study in which the listener monitored a continuous story about the adventures of a young lady named Pam. Instructions to the listener were simply to count and report the number of times the target word “Pam” had been heard in a given block of time. The same story was presented simultaneously to the two ears, but the narrative was delayed by 60 seconds in one ear relative to the other. Over the course of the experiment, the listener heard the exact same story in both ears but, at any one time, it was a different part of the story in the two ears. In half of the blocks, the listener was instructed to count only targets heard from the right side, in the other half only targets heard from the left side. The auditory stimuli were presented from loudspeakers located directly to the right and left ears of the listener at a distance of one meter. This was a classical “oddball” AERP study in which the duration of each target, “Pam”, was short compared to the duration of ongoing speech between targets (ie, low a priori probability of a target).
The AERP is typically manifested as a waveform spanning the latency interval (time after onset of the word “Pam”) from 0 to 750 msec. Figure 1 shows an example of a typical AERP waveform. It is characterized by three easily identified peaks: an initial negative peak (N1) at a latency of about 100 msec, followed by a positive (P2) at a latency of about 200 msec, and the late positive component (LPC, also known as P3 or P300), a positive peak at a latency somewhere in the range of 300 to 900 msec, depending on the nature and difficulty of the oddball task generating the positive-going peak. We were interested in two time intervals within the total latency range, the region from 0 to 250 msec, spanning the N1-P2 complex, and the latency region from 250 to 750 msec, spanning the LPC measured in the present study.
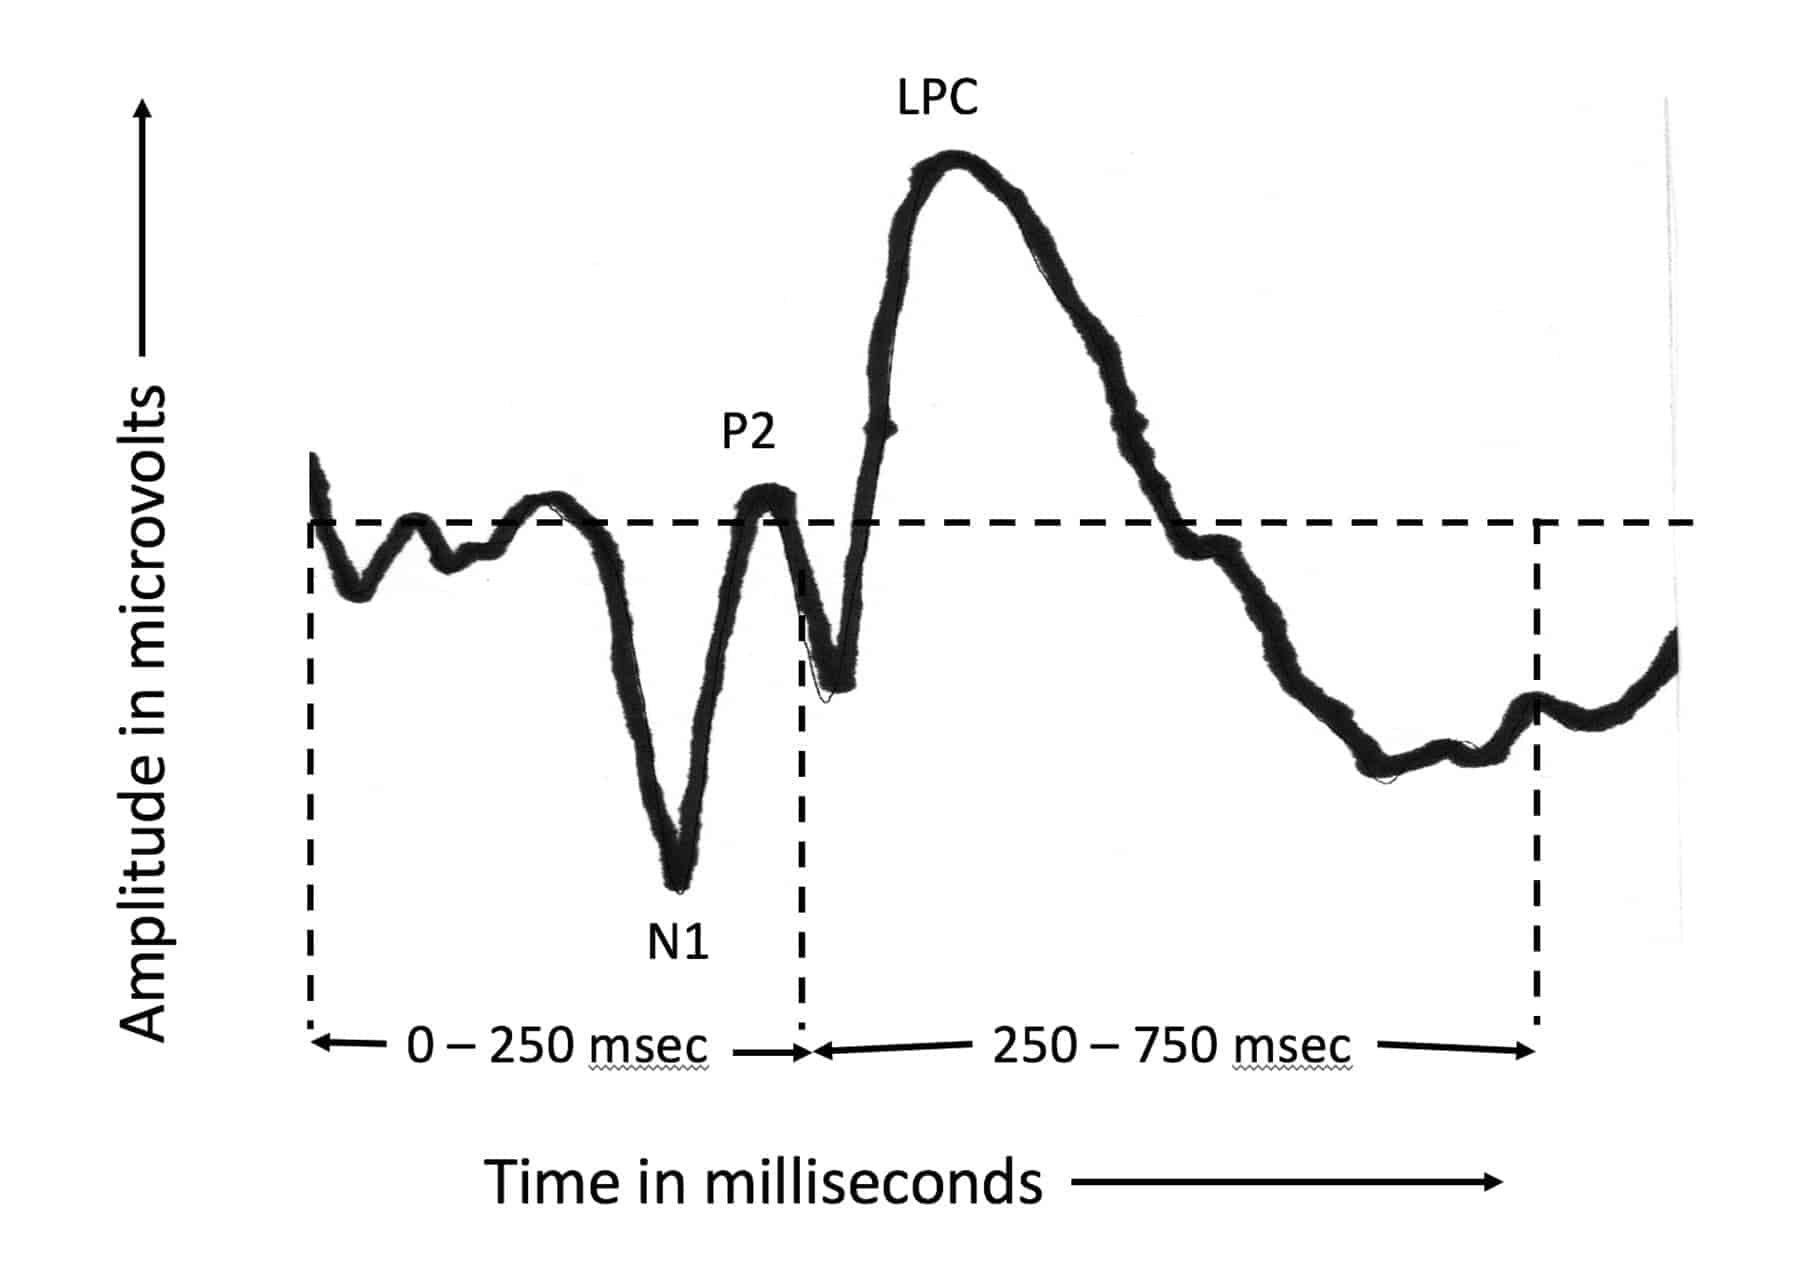
Figure 1. An example of how a typical auditory event-related potential (AERP) appears at a single electrode. The N1 and P2 peaks occur within the first 250 msec after word onset; the LPC peak usually within the 250-750 latency interval.
The N1-P2 complex reflects the fact that the onset of a sound has been detected. There is no processing of linguistic content during this first 250 msec. It is simply the brain’s response to the onset of each word. In contrast, the LPC component reflects the fact that a linguistic target has been detected from among linguistic non-targets. In this experiment, therefore, the N1-P2 response serves as a control condition in which no significant ear difference in arrival time would be expected in the left hemisphere since there is no linguistic analysis. In the case of the LPC component, however, we can measure, at each electrode, the difference in time of arrival of the inputs from the two ears at any given electrode.
This concept can be visualized by a simple thought experiment (Figure 2). Imagine a line drawn from one of your ears, across the top of your head in the vicinity of the parietal region of your brain, then on to the other ear. Vertically, this defines a coronal plane across the head. On that line, imagine five electrodes, extending from just above your left ear, across the top of your head, to just above your right ear. The electrode at the top of your head, in the midline, is labelled Pz (P for parietal, z for midline). The one closest to your left ear is labelled P7. The one closest to your right ear is labelled P8 (odd numbers over left hemisphere, even numbers over right hemisphere). The electrode halfway between P7 and Pz is labelled P3. The electrode halfway between Pz and P8 is labelled P4. These labeling conventions derive from the International 10-20 system for placement of EEG electrodes. For our purposes, however, all we need to remember is that P7 and P3 are located over the left hemisphere, P4 and P8 are located over the right hemisphere, and Pz is in the middle between the two hemispheres. This arrangement is illustrated in Figure 2 for both the 0-250 msec interval (left panel) and the 250-750 msec interval (right panel). In both cases we are viewing the head from behind. The reason that we are particularly interested in the parietal coronal plane is that this is a good electrode location to view both the N1P2 complex and the LPC.
At each of these 5 electrodes our dichotic experiment provided two AERPs, one from right-ear stimulation, the other from left-ear stimulation. Our particular interest is the difference-in-arrival-time at each of these 5 electrodes. We can derive this time difference by a technique called cross-correlation of the AERP waveforms. It tells us two things about each right-ear versus left-ear difference: 1) which AERP arrived first at any given electrode, and 2) by how much time. Here we follow the convention that earlier arrival by the right-ear input is designated by red numbers; earlier arrival by the left-ear input is designated by blue numbers. Note that nowhere in any of this are we talking about actual absolute transmission times in the brain. The only numbers in Figure 2 are differences between arrival times in msec. We have no way of knowing from these data how much absolute time actually elapsed in the process.
In Figure 2, there are two heads. The head on the left panel shows differences in arrival time at the five parietal electrodes for the N1P2 complex. Rounded to the nearest millisecond, they are all zero. That is, the N1P2 waveform portions for right ear and left ear stimulation show no differences in arrival time at any of the 5 electrodes across the parietal electrode array. Through the first 250 msec of the AERP waveform, there was no asymmetry in the evoked electrical activity. All interaural arrival differences were less than 1.0 msec. This result is consistent with the interpretation that the N1 and P2 peaks reflect essentially pre-attentive, automatic responses to the recognition of the onset of any auditory event.
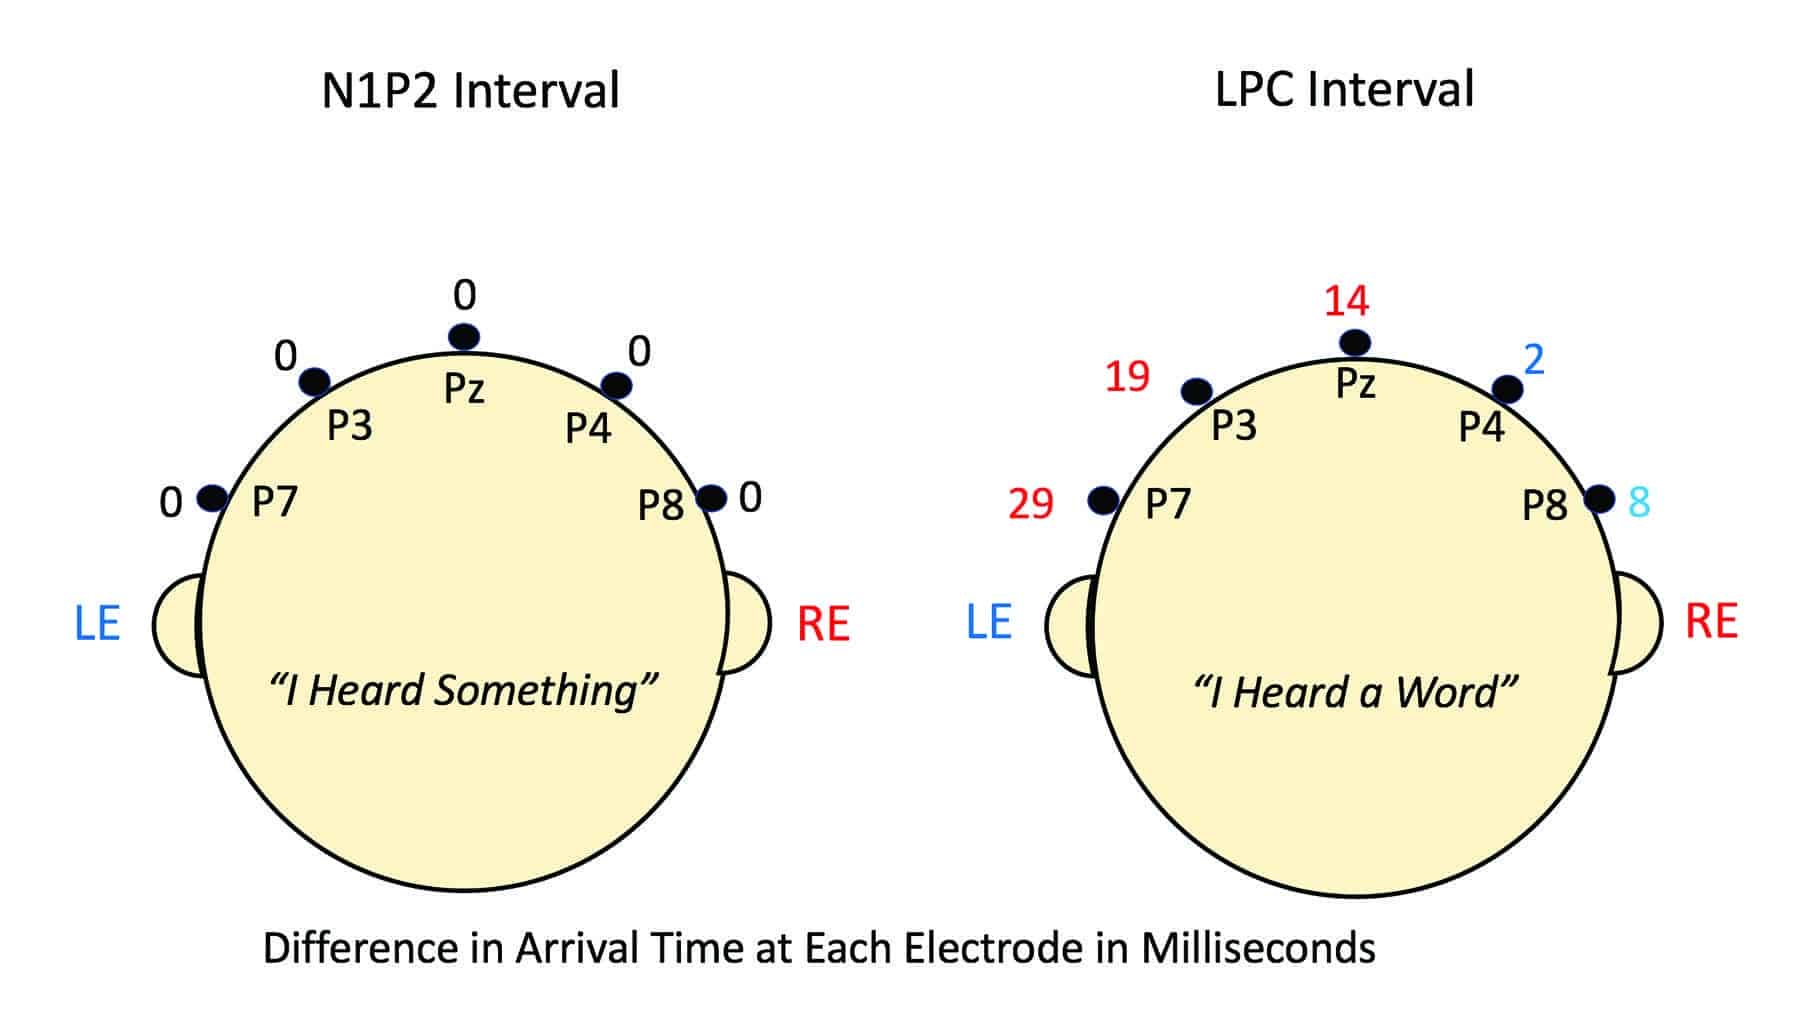
Figure 2. Difference in msec between arrival times of right- and left-ear AERP inputs at five parietal electrode sites viewed from behind the head. All numerals are arrival time differences only. They are not absolute transmission times. Here we follow the convention that earlier arrival by the right-ear input is designated by red numbers; earlier arrival by the left-ear input is designated by blue numbers. No difference in arrival time is designated by black zeros. In the case of the N1P2 interval (0-250 msec), there were no arrival-time differences. All five electrodes showed zero arrival differences. In the case of the LPC component, however, arrival-time difference systematically changed from favoring the left-ear input at electrodes P8 and P4 (right hemisphere) to favoring the right-ear input over electrodes Pz, P3, and P7 (left hemisphere). At electrode P7, over the left parietal electrode region, the right-ear input arrived at electrode P7 a full 29 msec before the left-ear input. Here is graphic illustration of the basis for the right-ear advantage so consistently revealed by behavioral dichotic testing.
In the case of the LPC component (right panel), however, the arrival-time difference between right-ear and left-ear inputs increased systematically as the electrode site moved from the extreme right side of the head (electrode P8) to the extreme left side (electrode P7). Not unexpectedly, at electrode P8 (ie, over the right hemisphere) the difference (blue numbers) favored the left-ear input by about 8.1 msec, but at electrode P4 (still over the right hemisphere) the difference favoring the left-ear input had declined to 2 msec. Moving leftward across the parietal plane (red numbers), the ear difference at electrode Pz (midline) favored the right ear by 14 msec, at electrode P3 by 19 msec, and at electrode P7 by 29 msec. This systematic change in arrival-time difference from across the parietal electrode array as we move from right hemisphere to left hemisphere, reflects the fact that the right-ear input enjoys direct access to the left hemisphere, whereas the left-ear input must follow a longer path via the right hemisphere and the corpus callosum.
The asymmetry in this evolved auditory system is evident. Note that to detect the onset of a word you need only the primitive symmetric auditory system common to all animals who need to know that a sound has occurred and from which direction it is coming. To recognize an actual word, however, you need a much more complicated asymmetric auditory system.
Figure 3 plots the same data as Figure 2 but in a more conventional graphic format. This function, relating difference in time of arrival to electrode position over the two hemispheres, provides strong support for Kimura’s structural model of dichotic listening. It graphically demonstrates the time delay encountered by the left-ear word input as it completes its journey to the right hemisphere, then over the corpus callosum to the left hemisphere. Here we see a graphic illustration of the actual basis for the right-ear advantage.

Figure 3. A more traditional way of visualizing the differences in arrival time at each of five parietal electrodes across the head that are shown in Figure 2, with P7 (farthest left), P3, Pz (median plane), P4, and P8 (farthest right). Black zeros are results for N1P2 interval. Red and blue circles are results for LPC interval. Modified from Figure 7 of Jerger and Martin (2004).2
Aging Complicates the Picture
Well, if it had all ended there, the slight REA/LED would have remained a laboratory curiosity, a small effect of little consequence. Like so much research carried out in university settings, however, dichotic listening research was extensively studied only on the subjects readily at hand: young adult college students in the age range from 18 to 26 years with normal hearing. And, in young people with normal hearing, the REA/LED is small—in the range of 3-5% for a 50-word test list.
Eventually, however, audiologists broadened the scope of dichotic-listening research to include persons with hearing loss. And it is unavoidable, when studying people with impaired hearing, that many will be elderly. It soon became clear that the seemingly minimal REA/LED in young adults increased with age. In one dichotic sentence-identification study conducted by the author and colleagues,3 the average REA/LED progressed from 3% in 20 year olds to 37% in 80 year olds. Figure 4 illustrates these results, which are based on 356 listeners with either normal hearing or symmetric sensorineural loss (and conducted in the directed-report mode to avoid age-related attentional effects often present in the free-report mode).
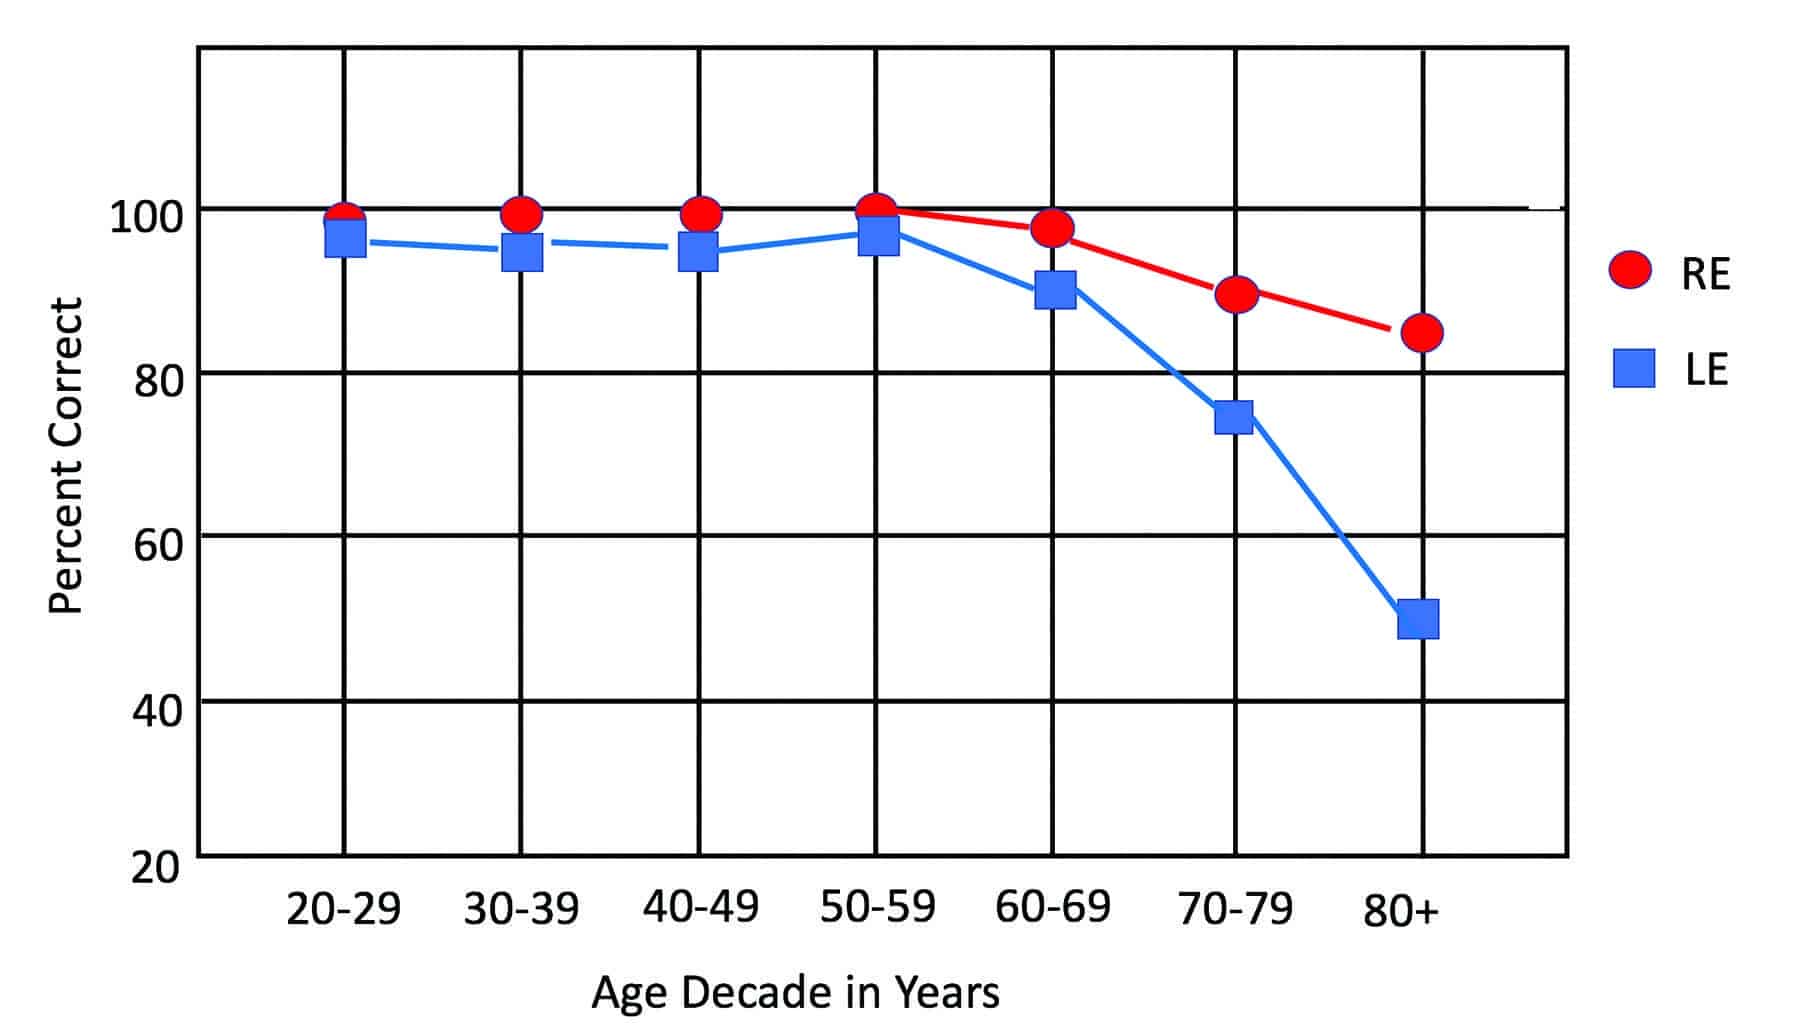
Figure 4. Mean percent-correct scores for right ears (red circles) and left ears (blue squares) as functions of age group on the Dichotic Sentence Identification (DSI) test (n=356; Directed Report-Mode). Modified from Figure 2 in Jerger, et al.3
Unilateral disadvantages of this magnitude cannot be easily dismissed. They suggest a profound aging affect somewhere in the auditory system. How can one explain the progressive increase in the left-ear disadvantage?
The Corpus Callosum Again
A likely suspect is the corpus callosum, the bridge between the brain’s right and left hemispheres. A progressive deterioration of this bridge could provide the answer. And it is a fact that the corpus callosum does, indeed, undergo age-related changes, including size, fiber composition, white matter, and metabolism. Thus, the net effect of aging is a substantial increase in the disparity between right and left ears in speech recognition under simultaneous stimulation of the two ears.
Binaural Interference
Such interaural disparities in elderly persons with hearing loss inevitably bring to mind the phenomenon of binaural interference, the tendency of the input from one ear to interfere with binaural processing.4 Many clinicians have observed that some elderly persons with hearing loss reject binaural hearing aids in favor of a monaural fitting. Researchers who have studied the phenomenon in detail usually report that the preferred ear for the monaural fitting is the right ear. Indeed, when speech recognition scores are compared across the three conditions of monaural right, monaural left, and binaural in persons demonstrating binaural interference, the monaural condition that outperforms the binaural condition is almost always the monaural-right condition. It has been suggested that severe deterioration of speech processing through the left ear may actually interfere with binaural processing, leading to a binaural interference effect. All of this has important implications for the successful use of amplification.To summarize:
1) When different words are presented to both ears simultaneously, the left ear is, on average, at a slight disadvantage in speech recognition.
2) The average difference, or “right-ear advantage/left-ear disadvantage,” is small, perhaps 3-5%, in young adults with normal hearing.
3) This REA/LED increases systematically as some persons age and develop hearing loss. The effect may be due to aging effects on the corpus callosum, the bridge between the two cerebral hemispheres.
4) When elderly persons with hearing loss are evaluated for possible use of amplification, some reject binaural fittings in favor of monaural amplification, suggesting the possible presence of binaural interference.
5) The favored fitting, in this case, is usually for the right ear.
Well, that is the saga of the REA/LED—another innocent victim of aging.
References
-
Kimura D. Cerebral dominance and the perception of verbal stimuli. Can J Psychol. 1961;15(3):166-171.
-
Jerger J, Martin J. Hemispheric asymmetry of the right ear advantage in dichotic listening. Hear Res. 2004;198(1-2)[Dec]:125-136.
-
Jerger J, Chmiel R, Allen J, Wilson A. Effects of age and gender on dichotic sentence identification. Ear Hear. 1994;15(4)[Aug]:274-286.
-
Jerger J, Silman S, Lew HL, Chmiel R. Case studies in binaural interference: Converging evidence from behavioral and electrophysiological measures. J Am Acad Audiol. 1993;4(2)[Mar]:122-131.

Correspondence can be addressed to HR or Dr Jerger at: [email protected]
Original citation for this article: Jerger J. The remarkable history of right-ear advantage. Hearing Review. 2018;25(1):12-16.


I was curious if the REA/LED comes into play with deciding which ear to implant (cochlear implant)first if both ears have an equal hearing loss? Usually it is the right ear that is chosen.
Very interesting article. Does the preferred right ear only that is preferred when binaural is rejected apply even if the hearing is worse in the right ear?