Tech Topic | July 2018 Hearing Review
When new users were fitted with Own Voice Processing (OVP), increased communication was self-reported in 75 of the 96 communication settings (78%) they nominated (via COSI). Only 4 of the 32 participants did not report increased communication in at least 1 of the 3 situations selected.
A friend phones to invite you for dinner with a group of old friends, and you would certainly like to see all of them. But, instantly, your pessimism starts to kick in. You know it will be noisy. From your previous experiences in that room, even with all your concentration, it will be difficult to understand what’s being said—especially that one friend with her very soft voice. Whenever there is a sudden outburst of laughter, you’ll pretend to understand the joke and smile, but you’ll have little clue what was so funny. Ultimately, you’ll resort to leaning back and giving up, becoming more of a “non-player character” than an active participant in the dynamic discussions. Then a headache will creep in from all your mental effort, and you’ll feel alone among what are truly good friends. “No thanks, but I can’t that night,” you hear yourself say as you come up with a quick excuse to the invitation. Soon, many of the friendships start to fade and the invitations become less frequent. You find yourself doing more solitary things and convincing yourself that it’s better to watch TV or read a good book.
The above was adapted from a poignant description of a person with hearing loss,1and it illustrates the relationship between hearing loss and socialization. Hearing loss has been reported to be the cause of reduced communicative relationships, which often lead to reduced emotional and social interactions.2 At times, poor communication strategies coupled with the hearing loss can reduce self-esteem. The overall result can be loneliness, isolation, and dissatisfaction with family life.2We also need to consider research from the past few years suggesting the presence of a link between hearing loss and dementia and general cognitive decline. This link also may be partially related to social isolation.3,4
Does the use of hearing aids help prevent social isolation? Some research suggests that they do. For example, in a study commissioned by the National Council on Aging (NCOA),5 surveys examining the relationship between hearing aid use and quality of life were sent to 3,000 individuals with hearing loss and their family members. The results from the hearing aid users revealed that the use of hearing aids improved confidence (39%), participation in group activities (34%), and overall social life (34%). The observations from family members tended to be 10% or so higher than that of the users themselves. More recently, the EuroTrak 2015 (ET 2015) and MarkeTrak 9 (MT9) studies about hearing loss and hearing aids also have examined the non-auditory benefits of amplification.6 They did not specifically comment on socialization, but did report that a significant percent of hearing aid users state that hearing aids improve their relationships at home: 44% in the US, and an average of 51% for five European countries (Italy the highest at 71%).
A big part of socialization is communication participation. Participation means not just listening, but also talking. So when people start using hearing aids, do they just start participating more in a passive manner, or are they actually taking a more active role in the communication setting?
In his 2017 article, Høydal7 noted that one of the goals of the hearing aid fitting is “getting people talking.” He postulates that a barrier to this, especially with new hearing aids users, is that with amplification, the patients’ own voice often sounds unnatural to them. He proposes that a solution to this problem is the use of a special own voice processing (OVP) algorithm, introduced in 2017 by Signia. This feature is designed to detect the user’s own voice, and then, instantaneously, alter the gain and output to make the voice sound more natural to the user (see Høydal7 for details).
Since the report by Høydal,7 two clinical studies have been conducted to evaluate the efficacy of the Signia OVP algorithm.8,9 In the first of these, satisfaction of the user’s own voice was studied for both a closed and open fitting with OVP-On and OVP-Off.8 A clear advantage of OVP was noted. With closed fittings, 78% of the participants who were not satisfied with their voice with OVP-Off reported satisfaction with OVP-On, and overall satisfaction for the entire group was 85%. Even with open fittings, a significant improvement in satisfaction was observed when OVP was activated. The positive impact of OVP was best illustrated by comparing the satisfaction of own-voice for Signia OVP-On with a closed fitting, to two competitive products with open fittings—group satisfaction was 86% for Signia compared to only 58% and 37% for the two competitors.
In a companion study, the naturalness of the user’s own voice with OVP-On vs OVP-Off was studied. With OVP-Off, with closed ear tips, only 29% gave a rating higher than “neutral,” and importantly, 42% rated the naturalness of their voice negatively. With OVP-On, there were no negative ratings for naturalness, and only 14% of the participants gave the rating of “neutral.” The remaining 86% had positive ratings (above 4.0) with the majority at the 5.5 or 6.0 category; the desired rating of “natural.” The authors report that no participant had a lower rating for OVP-On compared to OVP-Off. These findings are summarized in Figure 1. The studies show that OVP is successful in increasing the perceived naturalness of the user’s own voice, and as a result, satisfaction also is substantially increased.
Voice Activity Tracker
An area of interest in this research was the use and effectiveness of the Signia Voice Activity Tracker, which is part of the myControl™ App. This app is designed to provide hearing aid users a convenient way to control their Signia Bluetooth® hearing aids, as well as to monitor their hearing performance. The myControl App 2.0 is available for Apple® (iOS 9.3 and onwards) and certain Android™ devices, and can be downloaded free of charge from Apple iTunes’ or Google Play™ stores.
The app serves three primary functions: remote control, streaming, and “fitness tracker” for hearing and communication. One of the components of the fitness tracker is the data logging of own voice activity; that is, the percent of time that the hearing aid user is talking, which we presume is in conversations with others. This is summarized on a daily basis for the hearing aid user. An example for a one-week period is shown in Figure 2.

Figure 1. Individual distribution of own-voice naturalness ratings for OVP-Off vs OVP-On. The participants were fitted using closed ear tips with hearing aids programmed to the NAL-NL2 prescriptive algorithm. The naturalness of their own voice was rated on a 1-7 point scale, with mid-points (1=Very Unnatural, 4=Neutral, and 7=Very Natural). Adapted from Froehlich et al, 2018.9
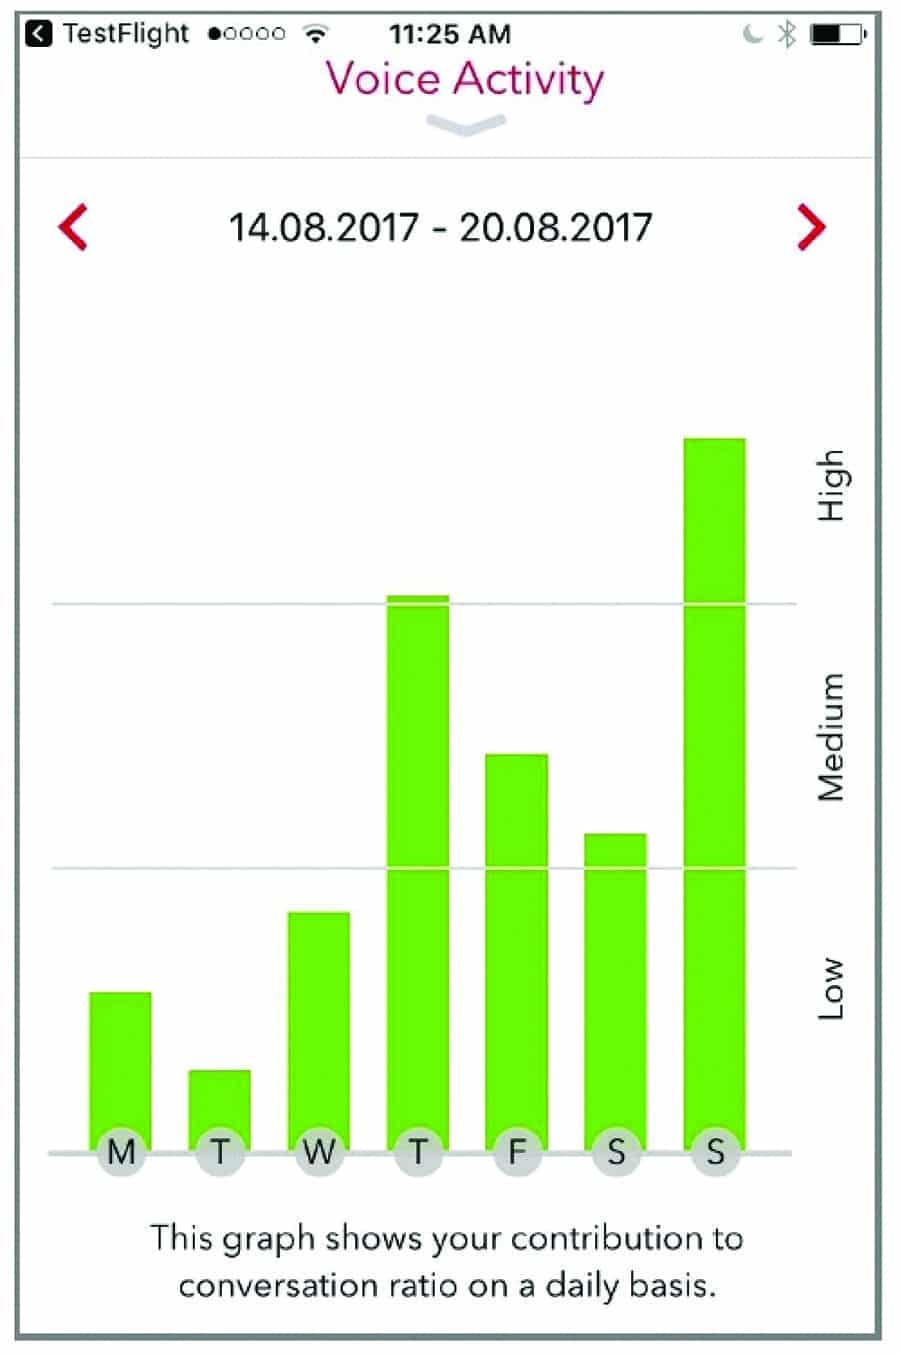
Figure 2. Smartphone screenshot of the of the Signia Voice Activity Tracker, which is part of the Signia myControl™ App.
The purpose of the present study, therefore, was to expand on the previous clinical studies, and determine if, in real-world settings, the Signia products equipped with OVP would serve to increase communication for new hearing aid users. Additionally, the influence and usefulness of the Voice Activity App also was evaluated.
Research Methods
The present research investigation was conducted at the Department of Audiology and Speech Pathology, University of Arkansas at Little Rock/University of Arkansas for Medical Sciences. All participants had mild-to-moderate bilateral sensorineural hearing loss, and they were all new hearing aid users. Because of the use of the Voice Activity app, all participants were required to own, and be familiar with, the use of a smartphone. A total of 32 individuals participated in the study, and they were randomly assigned to either Group 1 (did not use Voice Tracker app) or Group 2 (used Voice Tracker App). They ranged in age from 26 to 94 years (mean age: 61.1), with 18 males and 14 females.
All subjects were fitted bilaterally with the Pure7 312 Nx RIC hearing aids. Gain and output was selected using the Nx-fit prescriptive algorithm. Signia click-sleeve couplings were selected to be appropriate for the degree of low-frequency hearing loss. All standard special features were activated, including the OVP algorithm.
At the time of the fitting, each participant filled-out a modified Client Oriented Scale of Improvement (COSI) form.10 The original COSI was designed to measure hearing aid benefit for listening situations nominated by the hearing aid user. Users select specific listening situations that are important to them in which they would like to improve their hearing and speech understanding. Following hearing aid use, they then rate their degree of change as: “Worse,” “No Difference,” “Somewhat Better,” “Better,” or “Much Better.”
The modified COSI that we used in the present study only indirectly related to hearing aid benefit. Rather, the participants were asked to nominate three different communication settings that were important to them, where they believed that they could participate more in the conversation. After hearing aid use, they then rated their degree of conversation participation as: “Less,” “Same,” “Slightly More,” “More,” or “Much More.” The participants used the hearing aids in the home trial for a total of 6 weeks. The COSI ratings were obtained after 2 to 3 weeks of hearing aid use, and then again at the end of the study.
At the initial fitting, none of the participants were made aware of the Signia myControl App. After 2 to 3 weeks of hearing aid use, the participants in Group 2 were instructed on the app, and shown how to download it on their smartphone. They specifically were schooled on the use of the Voice Activity tracker, and were encouraged to view it at least once a day, if possible.
Are People Talking More?
The primary purpose of this research was to determine if the use of hearing aids with OVP encouraged individuals to participate more in communication settings. A secondary area of study was to examine if the Voice Activity app influenced their communication participation in any way.
Recall that, at the initial fitting, participants were asked to list three settings where they might be able to participate more in the conversation. These situations were rank-ordered according to importance to each individual. In total, there were 96 specific situations mentioned. We were able to group 90 of these into 8 general communication categories, summarized in Table 1. The two most common situations (ie, around the house and at work) are not surprising, as this is where many people have the majority of their conversations. And, like our opening vignette, a restaurant (#3 on the list) might be a place where the participants usually sit back, listen, and smile, knowing that they should be more engaged in the conversation.
For our analysis, however, we did not group scores relative to situation, but rather what each participant believed was the most important, 2nd most important, and 3rd most important. We believed that most new users would focus on the situation that was the most important to them, which could be obscured if we grouped by listening category.
The mean data for this analysis is shown in Figure 3. We do not see large differences between COSI items that were of #1 importance, compared to those that were #2 or #3. In general, we see average improvement for all 96 items of 3.6, roughly mid-way between the ratings of “Slightly More” and “More.”
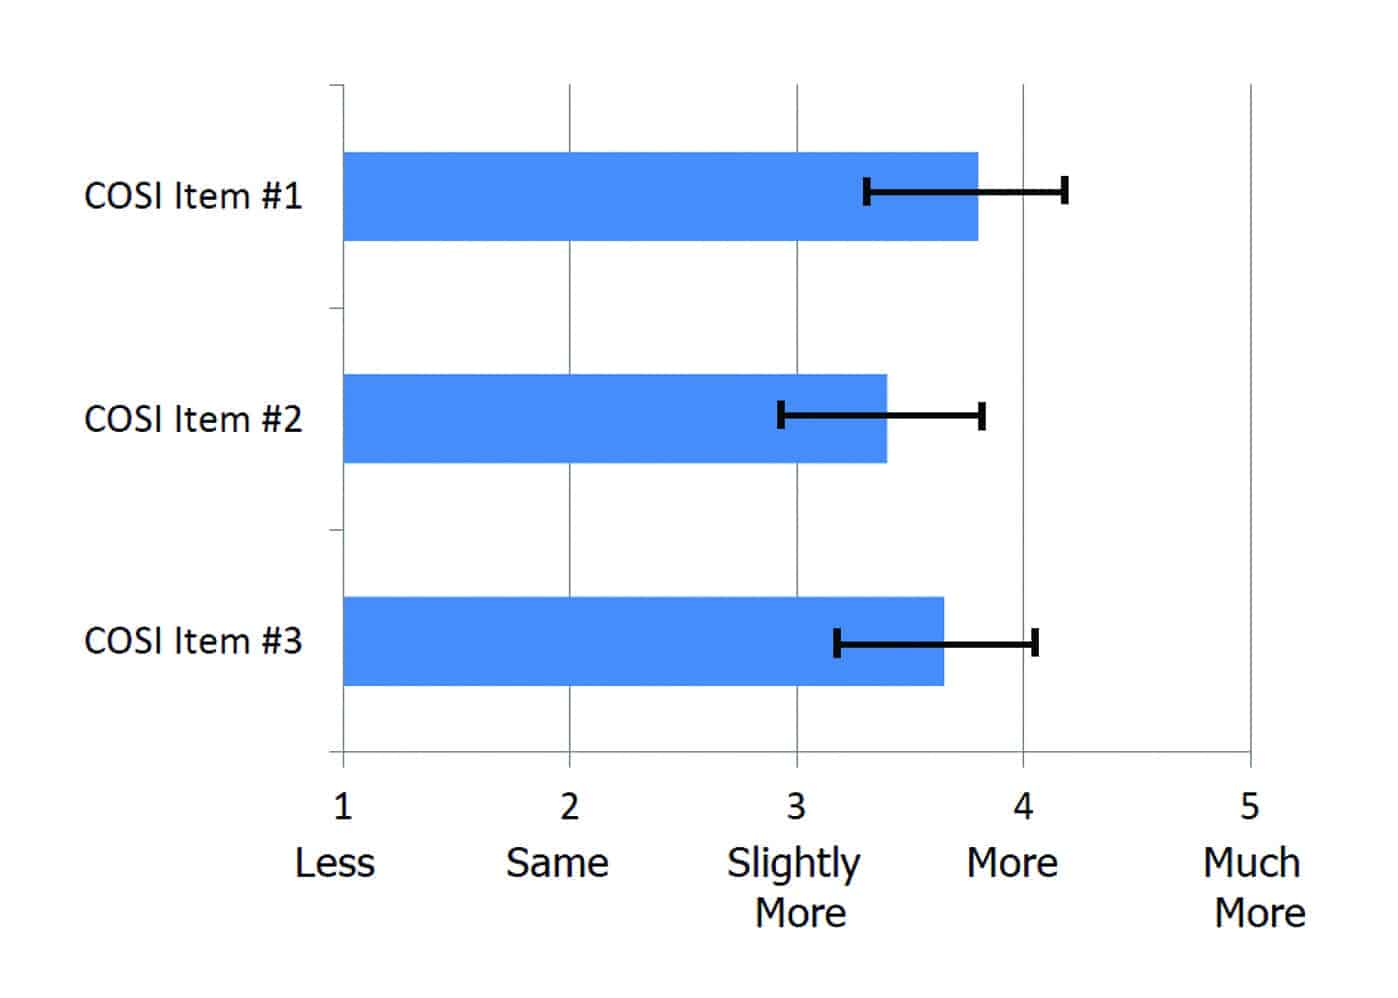
Figure 3. Mean COSI ratings for the three items nominated by each participant, ordered by degree of importance. Error bars represent 95th confidence interval. Ratings (1 to 5 scale) are for change in communication participation since the participant started using hearing aids.
Perhaps more meaningful than the mean data is to observe the individual distribution. Shown in Figure 4 are individual COSI ratings for the 96 items, categorized relative to the individual importance rating given to each item. Shown in the figure are the percentages for “Less Participation,” “Same Participation,” and “More Participation.” Observe that there was no instance for any of the participants where the use of hearing aids resulted in less communication participation, and for 78% of the total communication settings, participation increased.
To further examine these data, we can look at the distribution of the COSI ratings where improvement was reported, which are shown in Figure 4. When displayed in this manner, we see that the COSI item selected as most important is also the item with the most positive improvement: 84% of the ratings were either “More” or “Much More,” and 42% of the ratings were in the “Much More” category. In other words, the communication setting where individuals most believed that they needed to communicate more is the area where the most improvement was noted—an encouraging finding.

Figure 4. Distribution in percent of the COSI ratings for the three items nominated by each participant, ordered by degree of importance. Responses divided into three categories: Less Communication Activity, Same Communication Activity, and More Communication Activity.
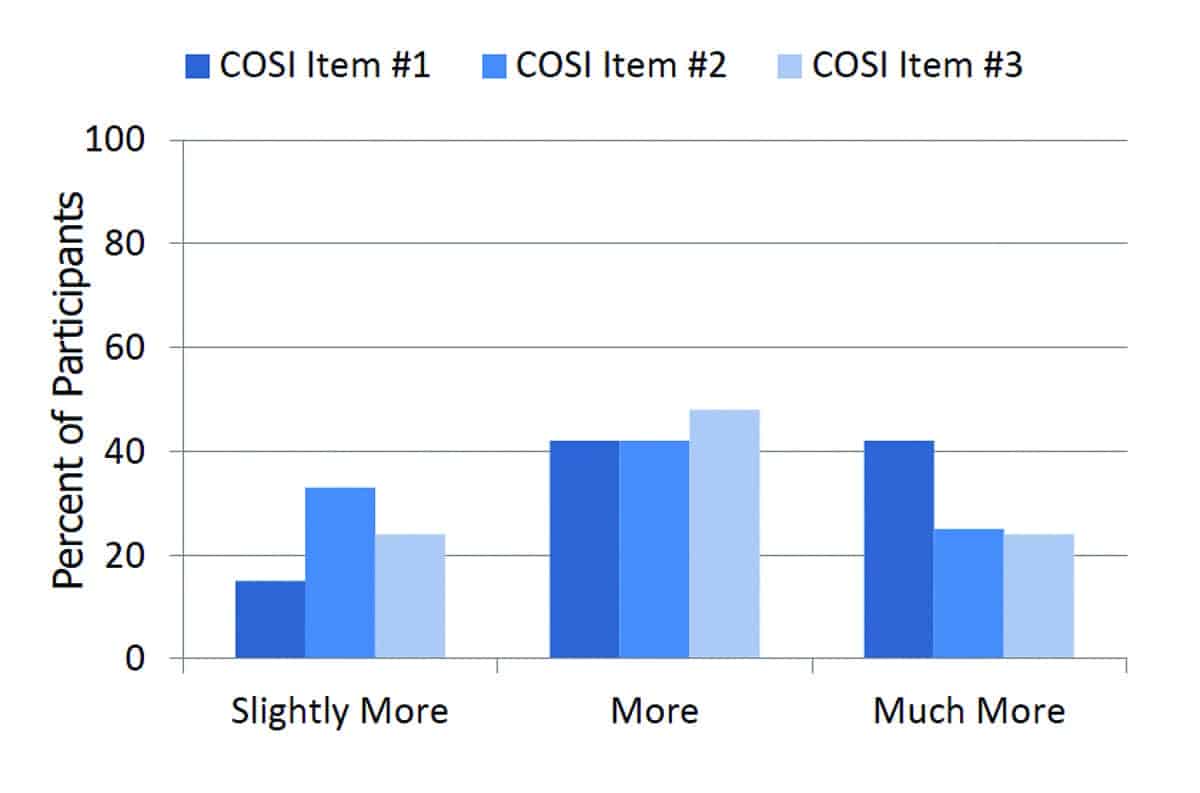
Figure 5. Distribution in percent of the COSI ratings for the three items nominated by each participant, ordered by degree of importance. Distribution shown for the three different categories of improvement. Ratings (1 to 5 scale) are for change in communication participation since the participant started using hearing aids.
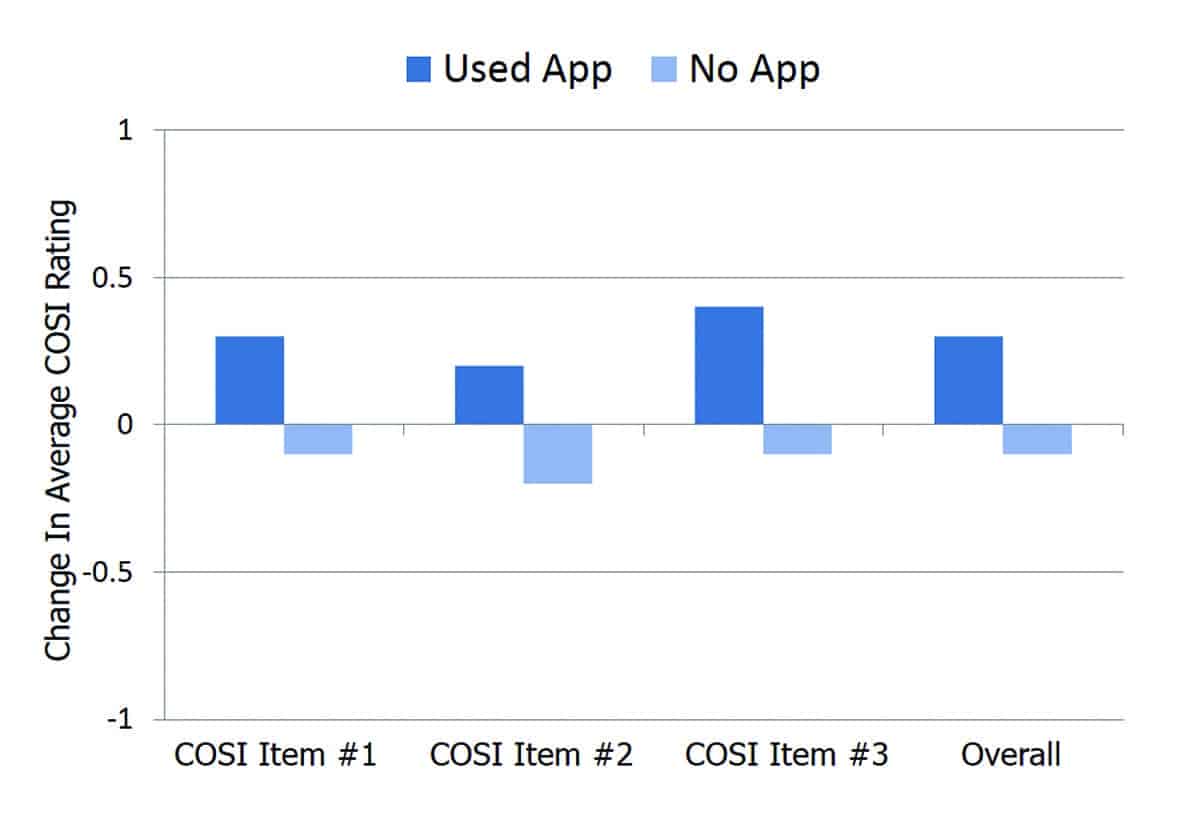
Figure 6. Mean difference values for COSI ratings that were reported at 2-3 weeks and those reported at the end of the study (6 weeks) for Group 1 vs Group 2; Group 2 used the Voice Activity Tracker App in the second half of the study. Differences are shown for each COSI item, ordered by importance.
Use of the Voice Activity App
To this point, we have discussed the findings for all 32 subjects based on the data obtained at the end of the 6-week field trial. Recall, however, that the participants in Group 2 were given the Voice Activity Tracker App after the first 2-3 weeks of hearing aid use. All participants for both groups completed the COSI at 2-3 weeks following the fitting, and therefore, it was possible to compare these earlier COSI findings to the final COSI findings for both groups. The mean differences between the two COSIs for both groups are shown in Figure 6. Note that, in general, the no-app group had mean group scores that were essentially the same, reduced very slightly. The trend for the app-use group (Group 2), however, was improved COSI scores. While these differences are not large, they do suggest that the use of the Voice Activity Tracker App may have encouraged some of the participants to engage more in conversations. The participant’s viewing of the Voice Tracker App ranged from once/week to 14 times/week, with the median viewing 7 times/week. The majority (74%) of the participants reported that the app was “easy-to-use,” with nearly 50% agreeing that it also was fun to use.
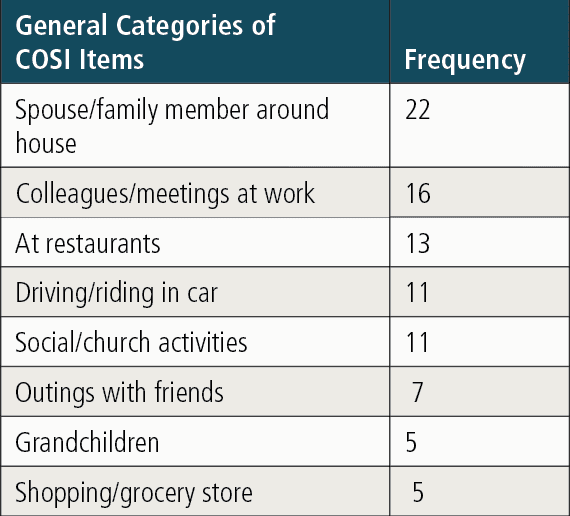
Table 1. Nominated COSI items in response to “Situations where I could participate more in the conversations.” Individual items grouped into 8 different general categories, which account for 90 of the total 96 communication situations selected by the participants.
Summary
While increased communication does not necessary mean increased socialization, it is reasonable to believe that they are highly correlated. As we reported earlier, past research has shown the use of hearing aids to increase self-reported participation in group activities and increase social life for 34% of the respondents.
Our findings revealed that, when these new users were fitted with Signia with OVP, increased participation was noted in 75 of the 96 communication settings nominated (78%). Only 4 of the 32 participants did not report increased communication in at least one of the three situations that they selected. Stated otherwise, 88% (28 of the 32) of these new hearing aid users experienced increased communication. If we assume that, for most, this also equates to increased socialization, the overall benefit for the user could have long-term positive effects.
The results of this study clearly show that Signia’s OVP indeed can get people talking. Importantly, these encouraging findings were for new hearing aid users, during their first 6 weeks of hearing aid use. It’s certainly possible that, as they further adjust to hearing aid use, communication participation would increase even more. In addition, the Voice Activity Tracker proved to be a useful easy-to-use companion to the OVP feature.

Biographical Information: Thomas A. Powers, PhD, is Chief Audiologist Consultant at Signia, Piscataway, NJ; D. Bradley Davis, AuD, is an educator and clinical audiologist at the University of Arkansas at Little Rock/University of Arkansas for Medical Sciences; Dirk Apel, BA, is the Head of Enhanced Consumer Experience, a team within the Sivantos Group; and Amyn M. Amlani, PhD, is Professor and Chair in the Department of Audiology and Speech Pathology in the consortium program between the University of Arkansas for Medical Sciences and the University of Arkansas at Little Rock.
Correspondence can be addressed to Dr Powers at: [email protected]
Citation for this article: Powers TA, Davis B, Apel D, Amlani AM. Own voice processing has people
talking more. Hearing Review. 2018;25(7):42-45.
References
-
Wyatt C. Staying active with hearing loss. September 25, 2012. Available at: https://www.saywhatclub.org/socializing-with-hearing-loss/
-
Ciorba A, Bianchini C, Pelucchi S, Pastore A. The impact of hearing loss on the quality of life of elderly adults. Clin Interv Aging.2012;7:159-163.
-
Dawes P, Emsley R, Cruickshanks KJ, et al. Hearing loss and cognition: The role of hearing aids, social isolation and depression. PLOS One. 2015;10(3):e0119616.
-
Dawes P. 20Q: Hearing loss and dementia—association, link or causation? January 9, 2017. Available at: https://www.audiologyonline.com/articles/20q-hearing-loss-and-dementia-19111
-
Kochkin S. Rogin CM. Quantifying the obvious: The impact of hearing instruments on quality of life. Hearing Review. 2000. Available at: http://www.betterhearing.org/sites/default/files/hearingpedia/Hearing_aids_and_quality_of_life_NCOA.pdf
-
Hougaard S, Ruf S, Egger C, Abrams H. Hearing aids improve hearing–and a lot more. Hearing Review. 2016;23(6):14.
-
Høydal EH. A new own voice processing system for optimizing communication. Hearing Review. 2017;24(11):20-22.
-
Powers T, Froehlich M, Branda E, Weber J. Clinical study shows significant benefit of own voice processing. Hearing Review.2018;25(2):30-34.
-
Froehlich M, Powers TA, Branda E, Weber J. Perception of own voice wearing hearing aids: Why “natural” is the new normal. April 30, 2018. Available at: https://www.audiologyonline.com/articles/perception-own-voice-wearing-hearing-22822
-
Dillon H, James A, Ginis J. Client Oriented Scale of Improvement (COSI) and its relationship to several other measures of benefit and satisfaction provided by hearing aids. J Am Acad Audiol. 1997;8(1):27-43.