Tech Focus: CIC Hearing Instruments
The latest in completely-in-the-canal hearing instrument technologies.
Read MoreThe latest in completely-in-the-canal hearing instrument technologies.
Read More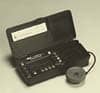
Events and information from the fifth annual Audiology Summer Camp sponsored by Oticon.
Read More
Virtually everyone agrees that hearing screening tests are underutilized by professional referral sources (eg, family doctors). A new CD/computer-based screener is designed to make hearing screening more accessible, thereby increasing professional referrals
Read More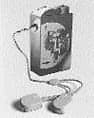
Cell phone interference with hearing aids remains problematic. However, while the telecom industry works out these problems, there are current devices that can help patients use cell phones—and, importantly, other listening devices—through the use of a telecoil.
Read MoreIf hearing care professionals are serious about reaching the 80% of consumers who have a significant hearing loss and who choose to do nothing about it, then there needs to be a counseling strategy by professionals that involves both genuine curiosity and courage.
Read More
An often-heard audiological axiom is “A good fitting begins with the impression-taking process.” The use of more viscous impression materials, long canal lengths, and open-jaw impressions are critical in producing impressions that work. Case studies and perspectives reveal why.
Read More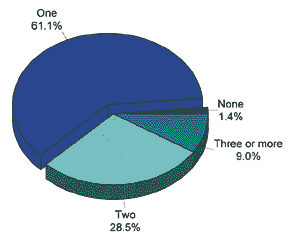
What factors are involved when a potential client is trying to choose where to seek help for his/her hearing problem? How are ALDs and computers being used by consumers? These answers and more are offered in this latest study of 3,000 hearing instrument users.
Read More