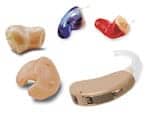
Issue StoriesLooking Back to Move Forwardby Karl E. Strom Hearing instrument sales in the US during 2002 fell by 1.3%. However, thats far from the entire story. Learn what happened last year and what might be expected in 2003. Hearing instrument unit sales in the US fell for the second year in a row while average revenues at the retail level continued to increase. In 2002, digital instruments sales grew to make up 45% of all dispensing activity, and today more than one-half (52%) of all instruments sold are digital. Pricing pressures within the digital segment are starting to chip away at revenue growth, and it appears that this trend will continue unless unit sales growth commences. Find out what happened in the market during 2002, and what might be expected in 2003-04. With a few important exceptions, the 2002 hearing instrument market looked a lot like the 2001 hearing instrument market. That is to say, it didnt look very good from a units sold or marketing penetration perspective, and there are few indications that its going to get any better in this area anytime soon. According to Hearing Industries Association (HIA) statistics1, a total of 1.90 million hearing instruments were dispensed in the US during 2002a 1.3% decline from 2001. In a word, when measured by unit volume, the market is FLAT, and has not moved up or down by more than 2% or varied by more than 52,000 units in the last five years (Figure 1). When exports are included, the number of hearing instruments dispensed equalled 1.98 million units, a decrease of -2.3%.
Dispensing Sources For only the second time in 25 years, HIA statistics indicate that the Department of Veterans Affairs (VA) experienced a decline (albeit by only -0.15%) in its dispensing activity during 2002. However, it should be that the VA still dispensed more than 236,000 aidsor 12.4% of all the hearing aids. Additionally, as last years HR market survey2 pointed out along with MarkeTrak VI3 statistics, this decline follows four years of very rapid unit volume growth due to a loosening of eligibility requirements passed by Congress in 1996.3 Its possible that the VA finally caught up with the backlog of veterans who were eligible for receiving these new benefits. Lucille Beck, PhD, director of the VA audiology division, says that the organization actually increased its unit volume by about 5% during its 2002 fiscal year which ended in September. However, like most government entities, the VA has been tightening its belt and it has even closed enrollment to certain groups (eg, individuals with high incomes who have disabilities with little service-related connection).
The slump in sales was fairly well distributed throughout the country (Table 1). Thirty-nine of the 50 states experienced unit volume losses, with noteworthy sales shortfalls in the Mid-Atlantic states of Pennsylvania (-24.8%) and New Jersey (-13.2%, New York escaped relatively unscathed, -0.53%). The particularly hard-hit states were mostly those with smaller populations: Maine, Connecticut, Vermont, Delaware, Maryland; Oklahoma, Louisiana and Alabama; and Oregon, Idaho and Colorado. Possible Reasons Some bonds and CDs, traditionally a large staple of seniors portfolios, have also yielded lackluster returns. And currently, the Bush Administration has proposed plans that would allow businesses to reformulate pensions on a cash-basis which some argue is good for businesses but might ultimately jeopardize the accounts of retirees. Other factors that may be negatively impacting hearing industry sales:
n Demographics: When looking at the per-annum increases in the seniors population, there has been a slight speed bump in the growth of the age-65+ populationthe age group to which 69% of hearing instruments are sold.6 According to the US Census Bureau, growth in the age-65+ group actually dipped below 1% per annum from 1995-2003, while the 55+ population group (read Baby Boomers) surged from a per-annum growth of 1.5% to 2.5-3.0% during the same period. Digital Domination
The popularity of digital aids is putting a squeeze on analog products. For the first time since their introduction in the late-80s, analog programmable sales fell significantly (by 18.6%) in market share. Approximately one-quarter (26.2%) of the hearing aids sold in 2002just under a half-million unitswere analog programmable instruments (Figure 2). The predictions of some industry experts in the mid-90s may yet be proven true: while there will almost certainly be a place for analog aids in the market during the foreseeable future, analog programmable instruments may one day be viewed as a transitional technology that allowed for the first widespread use of WDRC and other advanced processing strategies. Similarly, non-programmable analog hearing aids plummeted in market share during 2002 by 29.8%. Its amazing to consider that analog non-programmable aids made up 29.2% of all the units dispensed in the US during 2002, after constituing more than twice (61.0%) that number only four years earlier (Figures 2-3).
Despite stagnant unit volume growth in the overall market, the higher average selling price (ASP) of digital and programmable hearing aids and the growing popularity of these instrument types in 2002 buoyed gross revenues for the average office/practice by 8-12%. According to HR statistics (which do not account for specially priced aids and include the price of most of the associated services related to dispensing), the average sales price of a hearing instrument in 2002 was $1725. HR estimates that retail gross revenues for hearing care professionals were $3.28 billion compared to revenues of $2.91 billion in 2002. Therefore the average gross revenues of a dispensing office were in the neighborhood of $285,000, which corresponds well with the HR Dispenser Survey.2 (Editors note: Estimates by HR of average retail gross revenues are derived by applying the price of each instrument type as reported in the annual HR Dispenser Survey6 and extrapolating them to HIA sales statistics1 for those instruments. It is important to note that considerable variations may exist in these estimations due to the predominant practice of bundling service and testing fees within hearing instrument pricing (i.e., in the HR Dispenser survey, prices for both instruments and services are usually reported as the hearing instrument price). Additionally, third-party discounts, leasing programs, VA sales, and free aids may affect retail values significantly. Thus, the retail dollar figures are offered here only as a useful gauge for the actual value of the market.) According to MarkeTrak VI3, the average sales price of a hearing instrument increased by 35% from 1997 to 2000, and the average sales price of an aid was $1009 in 2000 (this figure includes the effects of free, discounted and third-party reimbursed hearing instruments). However, the retail revenue picture may be changing fast, and it is highly unlikely that office/practice revenues will continue to grow at the 7-12% annual rate experienced in the last five years. This is because average sales prices (ASP) within the digital segment are falling, and in some market segments, falling rapidly. For example, in the 2002 HR Dispenser Survey6, only digital CICs ($2728) and ITEs ($2403) were more expensive than the 2001 baseline value ($2389) for digital instruments, and many other instrument classes/styles fell in price, as well. This is the result of manufacturers who have released more economical digital instruments. What this means is that growth in revenues may come much more difficult to dispensing offices in the near-future. Styles and Return Rates It is interesting to note that four of the six most popular instrument choices are digital. Overall, the six most-popular types of hearing instruments fit by dispensing professionals are: 1) digital BTE ( 10.2% of the market); 2) digital CIC (9.7%); 3) programmable full-shell ITE (9.3%); 4) digital ITC (9.3%); 5) digital full-shell ITE (8.9%); and 6) analog full-shell ITE (8.6%). Hearing instrument returns for credit (RFC) were significantly lower in 2002 (16.4%) than in 2001 (19.1%). Four of the 6 most frequently returned hearing instrument types were digital. In fact, about one-in-four digital instruments dispensed is returned for credit, compared to about one-in-seven non-digital instruments. Coming Your Way to an Industry Near You? n The digital age: The safest wager that anyone can make about the US hearing instrument market is that digital aids will continue to dominate the industry in terms of both unit volume, revenue, and R&D focus. It is altogether possible that digitals will grow in unit volume to consume almost three-quarters of the total hearing instrument market by the Fourth Quarter of 2003. n Directional as standard. Another no-brainer. In the same way that digital is taking the industry, directional systems will become a gold standard on all hearing instrument styles that are large enough to accommodate them. The HR Dispenser Survey6 indicates that 22% of all the hearing instruments currently being dispensed contain some provision for directionality; MarkeTrak VI shows that about 10% of hearing instruments in place are directional.7 There remains no surer way to increase the SNR and reduce background noise than to employ a directional microphone system.
n Continued lower prices for digital aids. The average selling price (ASP) of digital hearing instruments is falling, and in some segments, the ASP is falling rapidly. Although its difficult to think of DSP as a mature hearing instrument technology class, their market penetration (52% in the Fourth quarter) and the introduction of second- and third-generation digital products heralds at least the adolescence of digital products. An argument can be made that, while the various brands of digital aids offer different hardware and processing strategies, most promise the same core benefits for the end-user. Due to this, there have been some fears thatdespite all the high technology and R&D money being poured into the development of these systemsthe digital market could devolve into a lowest price takes all contest. However, there are good reasons why this shouldnt happen. In the last two years, dispensing professionals have shown some resistance to the adoption of the economical DSP aids, instead choosing to focus a good deal of their interest on premium digital products that offer all the bells and whistles to patients (and also yield a more handsome profit). Another reason that commoditization seems unlikely is that considerable resources continue to be dedicated to R&D, resulting in significant variability between product attributes like channels, fitting software, processing and directional microphone strategies, and even company service aspects. In contrast to DSP aids becoming a commodity, a more likely scenario is one of more distinct product categories (eg, good, better, best) for DSP aids via a set of evolving and better-defined product features and capabilities (which have yet to emerge fully). Lastly, there are many more technologies to come that will radically alter what we now call digital aids. Indeed, the description of digital may seem absurdly simplistic 5-10 years from now when digital has become the primary platform for numerous other product classes (analogous to the advanced transistor hearing aids of the mid-50s). Digital technology promises to consume much more of the market, and it will increasingly be viewed less as a product class per se than as a platform for implementing new hearing solutions. And there are new product classes that have a good chance of emerging soon, like... Conjunctive DSP Systems. Although its unlikely to happen this year, it is possible that the first conjunctive digital systems appear in 2003-04. These systems will, in all likelihood, consist of a cellphone-size processing unit clipped to the shirt or belt that transmits digital data in real-time (via Bluetooth or similar technology) to a pair of custom in-the-ear aids. This may prove to be the next big leap in hearing technology, opening the doors to greater power/processing capabilities, true binaural integration and localization, enhanced sampling analysis, separate and/or detachable microphones for improved directionality and noise reduction, and the use of other wireless technologies within an open and integrated communication system (eg, computers, Internet, cellular phones, etc). Consolidation, Phase III. In 1999-2000, the industry saw a transformation, as some of the largest companies came together through mergers and acquisitions to reshape the competitive hearing aid landscape. The second wave of consolidation occurred in 2001, when the hearing industry experienced a wave of forward integration in which several hearing instrument manufacturers (or groups) either purchased, or struck distribution agreements with, chain retailers in an effort to procure larger and more reliable distribution systems. There were few blockbuster deals in 2002 (Amplifons purchase of Sonus being the obvious exception, as the company is now the clear leader in global retail dispensing with an estimated 8% market share). However, there may be a few deals waiting in the wings. The phrase economy of scale has remained on the lips of many manufacturers during the last three years.8 In an industry that is increasingly being influenced by burgeoning R&D, manufacturing, and distribution costs (and, possibly, lower future prices), it makes sense that the larger global companies with greater resources and distribution networks have some key advantages. Indeed, a prominent European company president suggested publicly in February that, in the face of increasing R&D budget pressures, it was in the hearing industrys best interest to continue consolidating.5 eBusiness: The HR 2002 Dispenser Survey indicates that 85% of dispensing professionals are currently online. However, researching products and hearing care topics (62%) and correspondence with colleagues (58%) are by far the predominant online activities for dispensers; only one-fifth have ordered hearing care products via the Internet. This number is expected to rise rapidly in 2003-04. Ordering online will dramatically simplify the ordering process, as new initiatives like eTONA (see Scott Petersons article on page 38) are implemented and, shortly thereafter, hearing instrument manufacturers ordering software modules become available. Although there are sure to be some bumps along the way, this promises to be one of the most important procedural changes in dispensing, with the potiential to save time, reduce redundancy and errors, and increase efficiency for dispensing professionals and manufacturers alike. Renewed Commitment to Process and Quality Care: This years ASHA convention was a noble start (or restart) in recognizing the need for a renewed commitment to counseling and aural rehabilitation. Additionally, a movement that would establish best practices in testing, fitting, verification that could be used by all hearing care professionals might be promulgated to further raise customer satisfaction and word-of-mouth advertising. Conclusion References |
|
|
|
ADDITIONAL ONLINE RESOURCES |
|