Avoiding Practice Burnout
Stress confronts us every day. It is inevitable. Here is what you can do to avoid its harmful effects.
Read More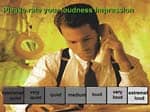
Stress confronts us every day. It is inevitable. Here is what you can do to avoid its harmful effects.
Read More
A new hearing instrument uses Adaptive Dynamic Range Optimization (ADRO) as an alternative to compression, with the goal increasing/reducing gain only when needed.
Read More
The hearing loss population has grown to 31.5 million people and will top 40 million within one generation. Overall customer satisfaction with new hearing instruments is 77%, placing hearing aids in the top-third of products and services in the United States.
Read More