This is the sixth and final MarkeTrak VI installment covering significant trends and issues in the US hearing instrument market. Customer perceptions of benefit and value play critical roles in satisfying customers; other strong drivers (correlates) of customer satisfaction are sound quality, reliability, and multiple environmental listening utility (MELU) including performance of the hearing instrument in noise.1-2 The price paid by the consumer has a weak correlation with customer satisfaction (Pearson r = +.02; source MarkeTrak VI hearing aids less than 3 years old (n=1,081)). Does this mean that price is not a determinant of satisfaction, or is the relationship between price and satisfaction simply obscured?
Figure 1. Customer satisfaction with value, benefit in noise, overall benefit, and likelihood of repurchasing the same brand of hearing instrument (hearing aids less than 3 years old). Source: MarkeTrak III (1991)-MarkeTrak VI (2000).
The US customer satisfaction rates on value, benefit, and performance in noise for hearing instruments less than 3 years old are shown in Figure 1. In general, about three out of four consumers are satisfied with the ability of hearing instruments to “improve their hearing,” but only slightly more than half are satisfied with the value of hearing instruments (defined as performance relative to price to the customer). When it comes time to repurchase, roughly half of all hearing instruments are “fired,” meaning the consumer switches brands or attempts to switch brands with the hope of increasing the utility (benefit relative to price) derived from their hearing instrument.
This final MarkeTrak VI article focuses on value and benefit and the role that price (a component of value) plays in satisfying hearing aid users. To accomplish this, the article draws on the findings of 13 years of customer satisfaction research across 36 studies involving more than 16,000 hearing aid consumers all with relatively new hearing instruments (<3 years in age). Additionally, a perspective will be offered on hearing instrument customer satisfaction ratings relative to all other product and service offerings in the US today.
Method
Samples. Between 1990-2002, I have individually or collaboratively conducted 36 customer satisfaction studies through the mail using the Knowles MarkeTrak Survey. More than half the customers studied during this time frame were concurrently administered the Abbreviated Profile of Hearing Aid Benefit (APHAB). Twenty-six of the studies have been published.1-14
Descriptive statistics on this research database are documented in Table 1. The average age of respondents is 69; six out of 10 are male with a median household income of $35,000. Eight out of 10 (82%) of the subjects had a bilateral loss while 66% were binaural users; and on average they wear their hearing instruments 10.9 hours per day. The style of hearing instrument used was not typical of the US hearing aid market in that nearly 28% of the subjects wore BTE hearing instruments. Close to an equal number of programmable and non-programmable product were studied; however, only a small minority (5%) were directional or DSP. The average out-of-pocket cost to the consumer for the hearing system was $1,997. Given the 13-year span on the studies, all prices were adjusted for the consumer price index (CPI) in 2002. The mean CPI adjusted price to customers was $2,308.
MarkeTrak Survey. The MarkeTrak survey now consists of 56 ratings of customer satisfaction with hearing aids and hearing health care service. Four items are behavioral in nature (hours worn, and extent to which the customer would recommend hearing aids, recommend the dispenser, and repurchase their current brand of hearing aid), 11 items are quality of life ratings, and 40 items are rated on a five-point Likert scale taking the values “very dissatisfied,” “dissatisfied,” “neutral,” “satisfied” and “very satisfied.” In addition to an overall hearing aid satisfaction rating, MarkeTrak measures satisfaction with eight product features, 12 performance/value factors, six dispenser attributes, and in 14 listening situations. This study focuses on four ratings: overall satisfaction, satisfaction with value and benefit, and likelihood of repurchasing their current brand of hearing aid.
Referring to Table 1, there was a wide range to the measured satisfaction scores: 47% points, overall satisfaction; 39% points, benefit; 38% points, value; 42% points, performance in noise; and 35% points, likelihood of brand repurchase.
Abbreviated Profile of Hearing Aid Benefit (APHAB). The APHAB15 consists of 24 items scored on four six-item subscales: Ease of communication (EC), background noise (BN), reverberation (RV), and aversiveness of sounds (AV). The respondents completed the APHAB under both aided and unaided conditions in the same administration by indicating the percent of time they experience problems hearing under the situations described in the inventory. A person’s score on each subscale is the mean rating of the six items making up the subscales. An APHAB subscale was scored only if the respondent answered four or more items within the specific subscale. Scores range from 1%-99% for all subscales. In addition, total APHAB scores were computed by taking the mean of subscales EC, BN, and RV. The rationale for combining these subscales was based on the results of a factor analysis of the total unaided subscale scores. The factor analysis results suggest that there are two dimensions to the APHAB subscales: aversiveness of sounds and hearing disability.
Referring again to Table 1, the mean APHAB scores were 63% unaided, 35% aided, and 28% absolute benefit. Benefit is defined as the difference between unaided and aided conditions; benefit can thus be operationally defined as a change in score indicative of hearing problem reduction or reduction in handicap. If we express the APHAB benefit score as the percent of hearing disability improvement (APHAB Benefit ÷ Unaided APHAB), then the mean benefit score was 43%. The complete distribution of benefit scores (ie, disability improvement) is graphed in Figure 2. The median benefit score is 44%.
Since the APHAB outcome is a critical aspect of this study, it is important that we consider its validity; that is, to what extent is performance on this subjective benefit test predictive of hearing loss and hearing loss improvement? In earlier MarkeTrak studies,16 I have demonstrated a very strong positive relationship between unaided APHAB scores and hearing aid ownership (Figure 3). The APHAB benefit scores are correlated with customer satisfaction and hearing aid usage.7 Cox et al.17 demonstrated modest absolute correlations (p = 0.45-0.68) between unaided subscales of the APHAB (ie, EC, RV, BN) and popular audiometric measures of hearing loss (ie, Puretone Threshold, NU-6 Word Recognition Test, Revised Speech in Noise Test (RSIN)).
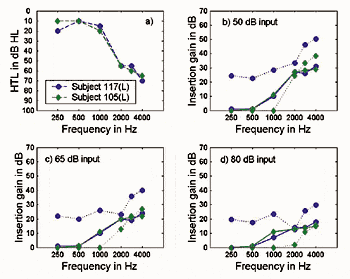
Figure 2. Histogram of hearing disability improvement as measured by the APHAB (n = 8,654). Hearing disability improvement = APHAB benefit ÷ Unaided APHAB score.
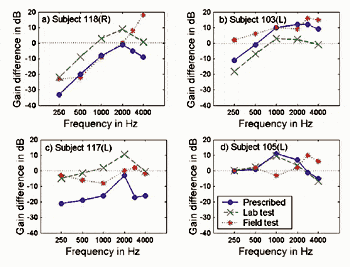
Figure 3. Hearing instrument market penetration is highly related to recognition of hearing disability. Source: MarkeTrak IV (n = 5,954 individuals with self-admitted hearing loss).
Perhaps as an indirect measure of validity, we might compare the absolute subjective benefit achieved in the present large-scale MarkeTrak study of 8,654 subjects with the absolute objective benefit achieved in a sample of 360 bilateral sensorineural hearing loss subjects across eight VA clinics in the US conducted by Larsen et al.18 In this double-blind study published in JAMA, an absolute mean benefit score of 29% was achieved on the NU-6 (monosyllabic words) and 26% on the Connected Speech Test (CST at 52 dB input SPL); by comparison the Knowles MarkeTrak/APHAB mail survey studies demonstrated a mean absolute benefit improvement of 28%.
Results & Discussion
Price and Customer Satisfaction. In numerous studies I have consistently found no practical correlation between overall satisfaction and retail price paid by the customer. But this does not mean that price is not an important determinant of customer satisfaction. In Figure 4 the relationship between satisfaction (total, benefit, value) and price is graphed for more than 13,000 subjects. Price is categorized in increments of $250. In general, the reader will notice that, in fact, price is slightly positively correlated with overall satisfaction and satisfaction with benefit, but negatively correlated with perceptions of value, which is defined as the performance of the hearing aid relative to price.
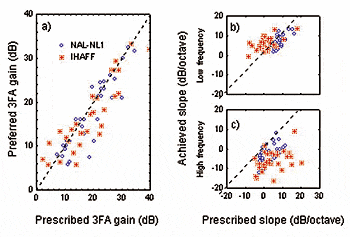
Figure 4. Relationship between price and customer satisfaction for hearing instruments less than 3 years of age (n=13,451).
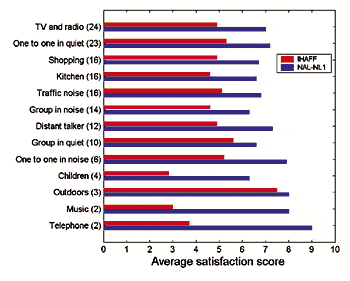
Figure 5. Relationship between improvement in hearing disability and customer satisfaction (n=8,654).
In Figure 5, among a smaller sample (n=8,654) of users, the relationship between satisfaction and hearing disability improvement (APHAB Benefit ÷ Unaided APHAB) is shown to be very powerful. On average, a 50% hearing disability improvement equates to a 57% satisfaction with value, 72% overall satisfaction, and 85% satisfaction with benefit. While nearly perfect restoration of hearing results in about a 95% overall satisfaction, satisfaction with value (at best) is shown to peak at 85%. The primary lesson of Figure 6 is that the hearing industry is able to satisfy all levels of hearing loss from mild (<20% hearing problem) to profound (95% hearing problem) as defined by the APHAB.
Figure 6. Relationship between hearing disability (via APHAB) and customer satisfaction (n=8,654).
Perhaps a more interesting or meaningful measure of “price” is to calculate how much the customer paid for every 1% reduction in hearing disability. This “utility” index can be expressed as:
|
Out of pocket cost to customer (in $) |
|
|
| Benefit |
Where benefit is defined as the percent improvement in hearing disability using a given benefit measurement scale. Using the APHAB as an example, the benefit equals:
Excluding subjects who paid nothing for their hearing instrument system the relationship between satisfaction and price paid per 1% hearing disability improvement is shown in Figure 7. At $5 per hearing disability improvement point, the hearing instrument is virtually guaranteed an 85% overall satisfaction rating; however, at $500 or more, it is unlikely that satisfaction above 45% can be achieved. As price per hearing disability improvement point increases, satisfaction with “value” is seen to drop precipitously compared to overall satisfaction or satisfaction with benefit. Next, we will attempt to develop overall models of the relationship between benefit, price, and satisfaction.
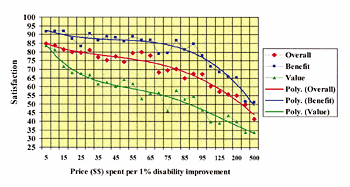
Figure 7. Relationship between money spent (in dollars) for each hearing disability point relative to value, benefit , and overall satisfaction (n=8,654).
Models of Customer Satisfaction and Brand Repurchase. In developing multivariate models of satisfaction and brand repurchase, aggregates of customers were developed around narrow bands of price (23 price points in $250 increments) and benefit (0%-100% improvement in 10% increments). This produced 253 possible aggregate groups. Using the rule that there had to be at least 10 subjects in a given aggregate, 110 aggregate groups were retained with an average sample size of 78 per cohort. Next, calculations were made within each of the narrow aggregates relative to: satisfaction (total, value, and benefit), probability of repurchasing the hearing aid brand, benefit (APHAB disability improvement score), and price paid for the hearing aid system. Four statistical models were calculated (with weighting based on sample sizes within each of the 110 cohorts) using standard stepwise regression for the variables. The resulting equations are shown in Table 2.
| Overall satisfaction = 48.32+(B x .557) – (U x .01875) (R2=.86, p<.0001) Benefit satisfaction = 49.11+(B x .994) – (B2 x .00513) Value satisfaction = 43.79 + (B x .347) + (B2 x .00258)– (P x .0073) Brand Repurchase Probability = 48.87 + (B2 x .00415) (R2=.66, p<.0001) Where: |
| TABLE 2. The four statistical models used to generate the data found in Table 3. |

The four statistical model results are interpolated for each level of benefit and price in Table 3. First, it should be recognized that, while price (or payment per disability improvement) is significantly related to overall satisfaction and perceptions of value, price is not significantly related to either benefit achieved or likelihood of repurchasing a brand of hearing aid.
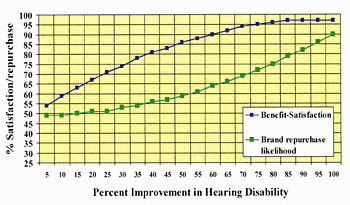
Figure 8. Satisfaction with benefit and likelihood of repurchasing current brand of hearing aid as a function of hearing disability improvement. Price is not related to these two variables (statistical model).
In Figure 8, the projected satisfaction with benefit and repurchase likelihood are diagrammed. On average, one could achieve an 86% satisfaction rating on benefit with a 50% improvement in hearing disability; however, only 59% would repurchase the hearing aid brand.
Customers are rational and will attempt to maximize their benefit next time around. Despite 95%+ benefit satisfaction scores with 75% hearing disability improvements, customers will most likely continue their search for a brand of hearing aid which provides more benefit. In fact, only 9 out of 10 will repurchase their current brand of product even with a 100% improvement in hearing disability. This is because other factors explain repurchase rates (eg, sound quality, reliability, style, fit and comfort, user controls, etc.).

Figure 9. Overall customer satisfaction as a function of price and hearing disability improvement (statistical model).

Figure 10. Customer satisfaction with value as a function of price and hearing disability improvement (statistical model).
Figures 9 and 10 graphically portray the joint relationship of price and benefit on overall satisfaction and satisfaction with value. In general, we can conclude that benefit when compared to price overwhelmingly explains the majority of customer satisfaction. The model also indicates that consumers on average are perhaps more forgiving on price when benefit is high. However, a free or inexpensive hearing aid does not guarantee a high satisfaction rating when benefit is low.
Comparisons to Other Industries. Audiologists and hearing instrument specialists frequently ask how hearing instrument satisfaction ratings compare to other industries. But which products should serve as a fair metric for the hearing care industry? I am of the opinion that hearing instruments are miniature electronic devices that operate in difficult environments. In debates with dispensing professionals, they often state that valid comparisons would be dentures, canes, or prosthetic devices. I respectfully disagree, tending more toward consumer electronics and computers. So depending on your own orientation, Table 4 shows hearing instrument satisfaction rates relative to the majority of customer products, services, and even some governmental services as published by the University of Michigan in their American Customer Satisfaction Index.19 The results are in rank order with three hearing instrument samples (age <2 years) relatively positioned against other products and services. The derivation of the overall satisfaction scores for these three hearing instrument samples is as follows:

Table 4. Customer satisfaction with products and services from other industries compared to the hearing instrument industry. Hearing instrument data is compiled from MarkeTrak hearing instruments that are 2 years old or less. Source: American Customer Satisfaction Index.19
- Non-programmable hearing instruments (n=1,457): All hearing instruments from MarkeTrak V (1997) and MarkeTrak VI (2000) where the respondent indicated 1) their instruments were not programmable, 2) not DSP, 3) not directional, 4) not sold through the mail ,5) and had no remote control. This is as close to a nationally representative sample as can probably be obtained. Overall satisfaction = 58%.
- Programmable omni-directional (n=7,034): The composite results from 23 studies1-14 mentioned above, some of which have not been published. Since many of these studies were on products considered “the best” at the time they were conducted among dispensing professionals who frequently fit the product (eg, those fitting 25 or more of a specific model in a year were frequently selected for the studies), I cannot with a high degree of certainty state that this is a representative satisfaction rating. Overall satisfaction = 72%.
- Programmable directional (n=757): The composite results from four studies, of which three have been published. As with the programmable omni-directional study, representativeness of the findings is of course an issue, especially in light of the fact that it is based only on four samples. I personally would feel more comfortable reporting the findings on more than a dozen directional technologies. Overall satisfaction equalled 81%. For comparison purposes, Schuchman et al.20 achieved satisfaction scores of 92% and 72% in two double-blinded VA clinical studies (average = 82%).
Referring to Table 4, customer satisfaction scores for US products and services ranged from 56%-89%. I have at times listed the high and low ratings within a specific category. In these instances I will differentiate the total category with the word “all” and the high and low ratings with a “high” or “low” categorization next to it. For example, customer satisfaction with all personal computers is 71%; while the highest (Dell) and the lowest (Compaq) in this category achieved ratings of 76% and 68% respectively.
Non-programmable hearing instruments (58%) are rated near the bottom of all products and services. Similar ratings were achieved by Qwest (telecommunications), PG&E (energy), AOL (Internet), the FAA and local police departments. It may be disconcerting to some that the IRS was rated higher at 62%! Omni-directional programmable (72%) is positioned at about the 40th percentile of ratings in this chart; it receives ratings comparable to banks, hotels, fast-food restaurants, and specialty stores (eg, Sam’s Club). Finally, directional programmable products (81%) are positioned at about the 80th percentile, receiving ratings comparable to consumer electronics, automobiles, beer, and pet food.
Clearly, technology does make a difference in customer satisfaction, and in the case of programmable directional instruments, it makes a very large difference. Likewise, recent hearing research points to the usefulness of specific dispenser-related activities, like real-ear measurement for loudness comfort and hearing-in-noise testing. MarkeTrak studies have pointed out wide differences in customer satisfaction scores relative to the amount of counseling time spent with patients and the use of follow-up surveys. These facts inevitably beg the question of whether a standard “recommended protocol”—or a minimal starting point—for fitting hearing instruments to the vastly diverse (eg, psychologically, physiologically, etiologically, demographically, etc) hearing-impaired population is a necessary step in the industry’s goal of improving customer satisfaction rates.
A Case for a Best Practices Protocol
With benefit playing such a critical role in customer satisfaction and brand retention rates—and therefore positive-word-of-mouth advertising—it is imperative that the hearing instrument industry develop the equivalent of an ISO 9002 program which optimizes benefit for the customer at the point of sale. Perhaps a good starting point is the recent insightful article by McSpaden, Brethower & Bray.21 It is hypothesized that today’s brilliant technology is not being fully customized to the unique hearing needs of the customer; the onus remains on the dispensing professional to move up to the next level of hearing health care service to assure optimum customization. McSpaden & colleagues believe that the development and use of techniques which define and maximize the individual customer’s residual auditory area are the key to lower return rates, greater benefit (in all its dimensions), customer satisfaction, and I might add improved brand retention rates and market growth.
The following are offered as considerations, based on the findings in this article, as well as conversations with respected dispensing professionals and hearing scientists. In addition, a current hearing aid fitting protocol from the Washington University School of Medicine is included in Table 5.
|
Washington University School of Medicine |
| Patient Name______________________________________ Date__________________ Hearing Aid R_________ Hearing Aid L__________
* These measures are being considered as additions to the current protocol. |
| Table 5. An appropriate “best practices” protocol or minimal standards for the fitting of hearing instruments could take many forms, but an agreed-upon standard of patient care that is capable of being performed by all hearing care professions has the potential to substantially elevate customer satisfaction with hearing instruments. Above is the Hearing Aid Fitting Checklist used by the Washington University School of Medicine, supplied courtesy of Michael Valente, PhD, upon request by the author. |
1. Convene a committee of the industry’s brightest minds to recommend a “best practices” hearing instrument selection/verification/validation protocol that will assure optimization of benefit for the individual customer. Medwetsky & colleagues22-23 found wide variability in the diagnostic and hearing instrument selection/verification/validation measures used in a survey of 60 audiology practices, leading them to conclude that there might be a great need for a best practices standard that is widely accepted and used by all hearing care professionals. They indicate that such standards (eg, ASHA Guidelines for Hearing Aid Fitting for Adults) might be available but simply not used for a variety of reasons.
2. Use fitting formulae that have been validated by solid research and data; develop a prescriptive decision tree. Fitting formulae have progressed from no rules at all to more sophisticated formulae that provide a good starting point for most hearing-impaired people. There will be significant differences in outcome measures both in terms of speech intelligibility and subjective consumer preference, depending on which prescriptive formula is used. It is apparent that there may even be significant interactions between prescriptive formulae, individual hearing loss characteristics, style/circuit of hearing instrument, and even the personality of the end-user. Perhaps advanced multivariate research (eg, use of artificial intelligence software) could lead to the development of a prescriptive decision tree which would assist the hearing care professional in optimizing benefit for the end-user.
3. Develop fitting protocols designed to maximize the patient’s residual hearing. McSpaden et al.21 recommend as a first starting point a change in testing where audiological threshold data and uncomfortable loudness levels (UCL) are measured in discrete frequencies. In short, the authors recommend full measurement of the residual auditory area of the patient using frequency-specific threshold and supra-threshold functions. To accomplish this, real-ear measurements (UCL/LDL) are recommended. Currently only 61% of dispensing professionals own a real ear analyzer (hearing instrument specialists 50%; audiologists 75%).24
4. Recognize that prescriptive gain targets, which are validated with real-ear measurement, only get the customer to audibility. It does not guarantee the customer will understand the world any better. A customer is not an audiogram; meeting gain targets does not guarantee that the customer’s quality of life will improve.
5. Check and verify that the hearing instruments are working properly with a listening test and determine that the customer’s hearing instruments meet specifications using a hearing aid analyzer. Currently only 70% of dispensers own a hearing aid analyzer (HIS 59%; audiologists 85%).24
6. Assure the customer audibility of important sounds (especially speech) and make aided sound no more uncomfortable than unaided sound. Current customer satisfaction relative to making “loud sounds comfortable” is 44% in hearing instruments less than 1 year of age.3 With today’s sophisticated fitting software, dispensing professionals can adjust amplification performance in 1 dB increments, while assuring they do not exceed any UCL by even 1 dB.
7. Measure each customer’s unaided speech intelligibility in quiet and noise. This means, of course, that an industry standard battery of hearing loss and outcome tests needs to be agreed on (eg, APHAB, NU-6, HINT, QuickSIN, etc).
8. From these initial test findings, a formal contract should be established between the dispensing professional and the customer. This contract should, at minimum, promise a certain level of benefit in quiet or easy-listening situations (one-on-one in quiet, TV, small group) and less aggressive benefit goals in noise or adverse listening conditions (restaurant, bar, party, car, outdoor).
9. Explore the impact on benefit and satisfaction of using simulated real-world environmental testing in a 360° soundfield at the point of sale. Preliminary research25-26 indicates that such patient-focused approaches may lead to preferred final use gain with fewer visits as well as enhanced expectations, since they were subjected to real-world sounds in the dispenser’s office prior to taking their hearing instruments home. A useful area of research is to determine if such methods lend assistance in the goal of optimally fitting the customer’s residual auditory area.
10. Compute benefit by comparing aided scores to unaided scores in quiet and noise. It is difficult estimating how many dispensers actually measure benefit subjectively or objectively. In a survey of 60 audiologists, Medwetsky & colleagues24 found only 53% of the audiologists routinely measured benefit in noise and that only 40% routinely used subjective measures of benefit. At a national level, one would think this number is considerably lower. In audience polls during my speeches, I conclude that less than 5%-10% of hearing aid fittings involve routine measurements of benefit in a pre-post fashion despite wide-scale availability of subjective and objective instruments.
11. Document to the customer the expected benefit in quiet and noise (typically at 2-3 input levels). Express benefit as “percent of hearing improvement.” Present to the customer a two-dimensional benefit report card documenting pre and post findings, as well as appropriate expectations given the measured benefit (actually the correct term is “inferred benefit” since we cannot really measure benefit). The goal is to get the customer to comprehend how much of their hearing problem has been potentially solved with hearing instruments; this will help shape expectations. Optionally, share the findings with the customer’s physician; demonstrating benefit to the medical community could have a positive impact on referrals.
12. Acknowledge and positively confront the “grey areas.” Inevitably, measurements of benefit will demonstrate that, for some customers, we have not been able to verify benefit in either quiet or noise and the customer concurs (eg, “my hearing aids amplify sound but I cannot understand better”). In this instance, a suggested customer protocol will be necessary to assure that hearing aids do not wind up in the drawer. Ignoring the customer’s complaints by telling them to “go home, and over time you’ll learn that you are doing much better than you think” does not appear to be an effective strategy for delighting the consumer. Conversely, it should be acknowledged that it is also possible to not measure any benefit, yet the customer swears that they are receiving exceptional benefit. Certainly the customer’s needs may be met psychologically or psychoacoustically in ways not yet discernable by current measurement methods.
13. Measure long-term customer satisfaction with hearing instruments 3 months or more after the fitting. Recent research27 demonstrates that only about 40% of customers receive any form of follow-up, and half of these were verbal conversations in the office. Only about 18% of customers receive a formal (by mail), in-office written or computer survey.
14. Focus efforts on value to the consumer. The issue of value is a complex one. It involves a fundamental transaction between two parties. When the customer receives poor value (eg, poor benefit relative to the price) dissatisfaction occurs, stifling market growth. As part of the benefit protocol we should seek to exceed customer needs by assuring in our transactions with customers that the energy the customer receives (eg, fitting and counseling time, product benefits/service) exceeds the energy they expend (eg, time and money).
15. Turn the best practices protocol into something equivalent to a “Good Housekeeping Seal of Approval.” Such a seal could be earned periodically (eg, annually or bi-annually) through an auditing procedure developed by the professional associations. Implicit in the “best practice” protocol is a benefit guarantee and assurance to the customer that their hearing care professional is adhering to the best standards that our industry has to offer.
16. Any protocol will necessarily undergo changes to reflect new findings, and any proposed procedures will need to be weighed against practical issues (eg, appropriateness for any given patient, and the required time, expense, and labor for practitioners). No protocol should be thought to be inviolable or presumed to be the “last word” on patient care. The individual nature of hearing loss prohibits this. As McSpaden warned in 1994, “…such rules set standards that become (simultaneously) both the minimums and the maximums for the professions. At that point, advancements in science, technology and understanding are wasted because the regulations are, by nature, restrictive rather than enabling.”28 In other words, a generally agreed-upon delivery protocol should be established, endorsed, and consistently used by hearing care professionals, but not mandated.
17. Once an efficient best practice protocol is identified, then it is imperative through clinical testing across multiple dispensing sites that we validate the protocol or demonstrate that it has a positive impact on the consumer and the dispenser of hearing instruments. This is the only way we can hope to achieve its wide-scale acceptance among dispensing professionals. Possible outcome measures at the dispensing practice level would appear to be: consumer benefit and satisfaction, dispensing practice growth, referrals (eg, positive-word-of-mouth advertising), return rates, practice profitability, and dispenser morale.
Few would disagree that measuring performance helps drive success. Without measurement how can we be assured that the customer’s hearing experience has been optimized for today’s brilliant technology? Without measurement, how can dispensers grow (eg, learn from their mistakes) in their wisdom on behalf of the customer?
Acknowledgements
The author thanks the following individuals for their review of and valuable comments on this article: Laura Voll, Ronald Gleitman, David Fabry (Phonak); Mead Killion, Gail Gudmundsen (Etymotic Research); Michael Valente (Washington University School of Medicine), and Robert Martin (San Diego State University & private practice).

|
Correspondence can be addressed to HR or Sergei Kochkin, PhD, Knowles Electronics, 1151 Maplewood Dr., Itasca, IL 60143; email: [email protected].
References
1. Kochkin S. Customer satisfaction with single and multiple microphone digital hearing aids. Hearing Review. 2000;7(11):24-29.
2. Kochkin S. MarkeTrak III identifies key factors in determining customer satisfaction. Hear Jour. 1993;46(8):39-44.
3. Kochkin, S. MarkeTrak VI: 10 year customer satisfaction trends in the US hearing instrument market. Hearing Review. 2002;9(10):14-25, 46.
4. Kochkin S. MarkeTrak V: Customer satisfaction revisited. Hear Jour. 2000;53(1):38-55.
5. Whichard S. Auditory benefits of ReSound sound processing technology. Sem in Hear. 1997;18(1):63-66.
6. Sandridge S. Customer satisfaction with Multi-Focus hearing aids. Sem in Hear. 1997;18(1):67-72.
7. Kochkin S. Subjective measures of satisfaction and benefit: establishing norms. Sem in Hear. 1997;19(1):37-48.
8. Kochkin S. Customer satisfaction and subjective benefit with high-performance hearing instruments. Hearing Review. 1996;3(12):16-26.
9. Kuk F. Hearing aid survey tests user satisfaction. Hear Instrum. 1996;47(1):24-29.
10. McLauchlan W. Customer Satisfaction and Benefit with Direct-by-Mail Hearing Instruments. Cincinnati, Ohio: McLauchlan Associates Inc; June 1995.
11. Kochkin S. MarkeTrak IV: 10 year trends in the hearing aid market: Has anything changed? Hear Jour. 1996;48(1):23-34.
12. Kochkin S. Customer satisfaction and benefit with CIC hearing instruments. Hearing Review. 1995;4(2):16-26.
13.Jedidi K, Estelami H. Measuring user satisfaction with programmables. Hear Instrum. 1994;5(5):22-23.
14. Kochkin S. Customer satisfaction with hearing instruments in the United States. Marketing Edge 1993. Alexandria, Va: Hearing Industries Assn; June 1993.
15. Cox, RM, Alexander GC. The abbreviated profile of hearing aid benefit (APHAB). Ear and Hear. 1995;16:176-186.
16. Kochkin S. MarkeTrak IV: What is the viable market for hearing aids? Hear Jour. 1997; 50(1):31-38.
17. Cox R.M, Alexander GC, Gray GA. Audiometric correlates of the unaided APHAB. Jour Amer Acad Audiol. In press.
18. Larson VD et al. Efficacy of 3 commonly used hearing aid circuits. JAMA. 2000; 284(14):1806-1813.
19. University of Michigan. American Customer Satisfaction Index. Available at: www.theacsi.org. Accessed November 2002.
20. Schuchman G, Valente M, Beck LB, Potts L. User satisfaction with an ITE directional hearing aid. Hearing Review. 1999;6(7):12-22.
21. McSpaden J, Brethower, Bray V. Across the fence: Defining and utilizing the individual patient’s residual auditory area. Hearing Professional. 2002;51(5):15-19.
22. Medwetsky L, Sanderson D, Young D. A national survey of audiology clinical practices, Part 1. Hearing Review. 1999;6(11):24-32.
23. Medwetsky L; Sanderson D, Young D. A national survey of audiology clinical practices, Part 2. Hearing Review. 1999;6(12):14-22.
24. Strom K. The HR 2002 Dispenser Survey. Hearing Review. 2002;9(6):14-32.
25. Robinson J, Russ D, Siu B. Effect of a multimedia fitting tool on final gain settings. Hearing Review. 2002;9(3):42-45.
26. Meskan M & Robinson JA. Patient-focused approach to fitting hearing instrument. Hearing Review. 2000;7(12):52-55.
27. Kochkin S. MarkeTrak VI: Factors impacting customer choice of dispenser & hearing aid brand; Use of ALDs & Computers. Hearing Review. 2002;9(12):12-23.
28. McSpaden JB. Defining professional concepts. Hearing Review. 1994;1(2):22-23.

