Market Research | July 2007 Hearing Review
This is the first segment of a multi-part publication that will cover significant trends in the hearing loss population. Since 1989, Knowles Electronics has conducted six MarkeTrak surveys of the US hearing loss population following the landmark 1984 Hearing Industries Association (HIA) study.
Beginning with this report, MarkeTrak is conducted and published by the Better Hearing Institute through the continued generosity and sponsorship of Knowles Electronics as a public service to the hearing care industry. Future publications in this series over the next year will consist of the following:
- Customer satisfaction with hearing instruments in the digital age.
- Barriers to adults with hearing loss seeking a hearing solution.
- Barriers to children with hearing loss seeking a hearing solution.
- Quantification of hearing instrument candidacy among adults with hearing loss who have not yet adopted hearing instruments as a solution for their hearing loss.
In November 2004, a short screening survey was mailed to 80,000 members of the National Family Opinion (NFO) panel. The NFO panel consists of households that are balanced to the latest US census information with respect to market size, age of household, size of household, and income within each of the nine census regions, as well as by family versus non-family households, state (with the exception of Hawaii and Alaska) and the nation’s top-25 metropolitan statistical areas.
The screening survey covered only three issues: 1) physician screening for hearing loss; 2) whether the household had a person “with a hearing difficulty in one or both ears without the use of a hearing aid”; 3) whether the household had a person who was the owner of a hearing instrument. This short survey helped identify 15,947 people with hearing loss and also provided detailed demographics on those individuals and their households. The response rate to the screening survey was 66%. In January 2005, an extensive survey was sent to 3,000 random hearing instrument owners and 3,000 random people with hearing loss who have not yet adopted hearing instruments. The response rates for the detailed surveys were 75% and 77%, respectively.
The data presented in this article refer only to households as defined by the US Bureau of Census—that is, people living in a single-family home, duplex, apartment, condominium, mobile home, etc. People living in institutions have not been surveyed; these would include residents of nursing homes, retirement homes, mental hospitals, prisons, college dormitories, and the military. The reader should also keep in mind that the demographics to follow refer only to those who admit to their hearing loss.
MarkeTrak Results and Discussion
The data presented in this study compares the MarkeTrak survey results over the last 15 years with selected data from the 1984 Hearing Industries Association (HIA) database of the hearing loss population. Tables 1-5 contain general trends and indices of the hearing loss and hearing instrument owner populations. Each table will be discussed in the order of appearance with references to relevant figures. (Note: Sample sizes are denoted in each table by “n= ”.)
User and Non-User Populations and
Physician Hearing Screening
Hearing Loss Population (Table 1). As measured by MarkeTrak, the incidence of hearing loss per 1,000 households increased to 283 from 266 in 1989. In 2004, this equates to 31.5 million people reporting a hearing difficulty. Since 2000, the hearing loss population grew 9.9% compared to a 6.8% increase in US households. Figure 1 shows the hearing loss population between 1989 and 2004, as measured by the MarkeTrak survey.
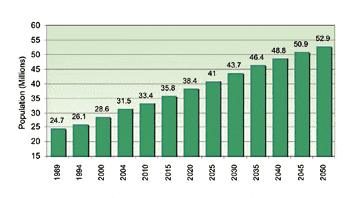
FIGURE 1. Hearing loss population (1989-2004) in millions with projections through the year 2050 based on MarkeTrak incidence of hearing loss by age group applied to US Bureau of Census age population projections. |
In addition, hearing loss population projections through the year 2050 are shown in Figure 1. The projections are derived by applying MarkeTrak hearing loss incidences by age against US Bureau of Census population projections by age.1 Within a generation, we can expect the hearing loss population to grow by one-third and top 40 million people.
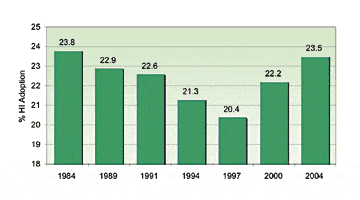
FIGURE 2. Hearing instrument adoption rates expressed as percent of people with hearing loss who own hearing instruments, 1984-2004.
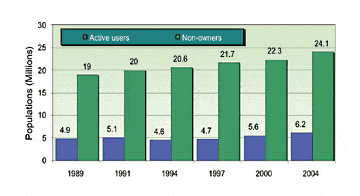
FIGURE 3. Hearing loss population of “active” users (blue bars) and non-owners of hearing instruments (green bars) from 1989-2004. (Note: An “active user” is defined as a hearing instrument owner who uses their hearing instruments even if only once a year.)
The Hearing Instrument Population (Table 1). Hearing instrument adoption rates declined steadily between 1984 and 1997 (Figure 2), decreasing from 23.8% to 20.4%. Starting in 2000 the hearing instrument adoption rate rebounded and increased to 23.5% in 2004—its highest level since 1984. Figure 3 shows that active hearing instrument users grew to 6.2 million (up 600,000) while people with a hearing loss without amplification increased by 1.8 million to 24.1 million people.
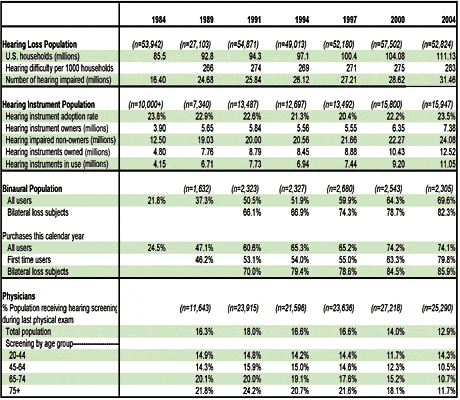
TABLE 1. General indices of the US population with hearing loss.
The stellar historical growth rate for binaural hearing instrument purchases is shown in Figure 4. Since our last survey, the binaural population increased from 64.3% to 69.6% for all users and from 78.7% to 82.3% (see Table 1) for all bilateral loss consumers. The binaural purchase rate in 2004 held steady at 74.1% for all users and 85.9% for bilateral loss consumers.
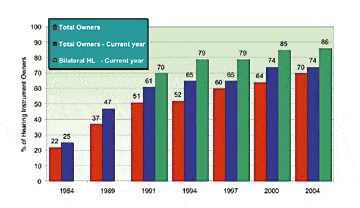
FIGURE 4. Binaural hearing instrument owner adoption rates (1984-2004).
Physician Screening for Hearing Loss (Table 1). We specifically asked individuals who received their physical exam in the last 6 months to indicate if their physician or nurse screened for hearing loss during the exam. The historical trends are shown in Figure 5. Physician screening has dropped to 12.9% for the total population. Declines are seen in every age category with the exception of young adults. This finding correlates with a recent publication that indicated 11.8% of primary care physicians screen for hearing loss during annual physical exams.2
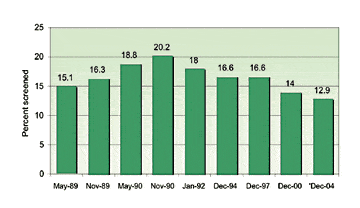
FIGURE 5. Percent of people screened for hearing loss during physical exams. Fifteen years ago, 1 in 5 people were screened for hearing loss during physicals.
Previously, we have shown the use of the Better Hearing Institute (BHI) Physician Referral Program, which did not provide a method for hearing loss screening, resulted in modest increases in referrals for hearing health solutions.3 Increasing physician referrals purely through educational material is a difficult task. The BHI and allied hearing healthcare organizations will need to find other methods for motivating physicians to take a more active interest in hearing as part of a total wellness program for their patients. Future initiatives which might increase physician screenings include:
- Paid public service announcements (PSAs) in medical magazines.
- Getting hearing loss screeners in physicians’ hands.
- Creating pull-through from the patient; if they can ask their doctor for Nexium or Viagra, they can ask them for a hearing screening.
- Getting large consumer oriented organizations, such as the American Association of Retired People (AARP), to assist in putting pressure on the medical community to include hearing screening during physical exams.
- Leveraging the Medicare Prescription Drug, Improvement and Modernization Act of 2003. In this Act, Medicare introduced the “Welcome to Medicare” preventive physical examination, available to new beneficiaries as of January 1, 2005. Upon recommendation of NIH, physicians are encouraged to use screening questionnaires to determine if their patients have hearing or dizziness problems. The NIH has endorsed the Hearing Handicap Inventory for the Elderly (HHIE) and the Dizziness Handicap Inventory (DHI). If the patient does not pass the HHIE or the DHI, the physician must provide education, counseling and referral. This represents an opportunity for hearing health providers to educate physicians on this new law and to advocate for the use of simple and accepted screening tools.4
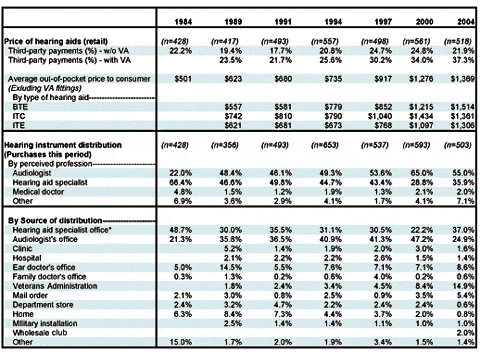
* Note: As of 2000, this source of hearing instrument fitting was changed from “hearing aid store” to “hearing aid specialist office.”
TABLE 2. General indices of the hearing instrument market.
Hearing Instrument Pricing & Distribution
Price of Hearing Instruments (Table 2). Referring to Table 2, third-party payment (eg, Medicare, union, insurance, HMO, VA, rebates, etc.) for hearing instruments grew to 37.3% of hearing instruments sold in 2004, up 3.3% over 2000 (Figure 6). Excluding VA fittings, third-party payment in calendar year 2004 was 21.9%, roughly the same as in 1984.
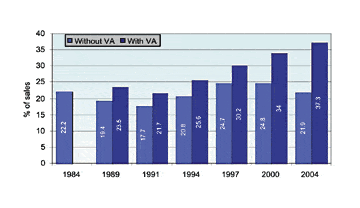
FIGURE 6. Third-party payment trend with and without Veterans Administration (VA) fittings.
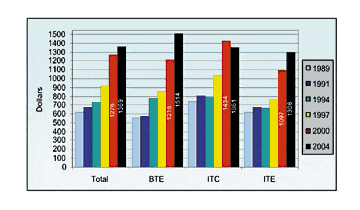
FIGURE 7. Average out-of-pocket retail price paid by consumer (includes free, direct mail hearing aids, and all third-party discounts, but excludes VA fittings).
Referring to Figure 7, the average price of a hearing instrument as paid out of the pocket of the consumer (includes free and third-party discounted, direct mail, but excludes VA fittings) increased 7.3% to $1,369. The price changes by style of hearing instrument were as follows: BTE (14.6%), ITC (-5.1%), ITE (19.1%). The price increases for BTEs and ITEs are probably due to the greater likelihood that they may have additional features such as volume controls, remote controls, multiple microphones, telecoils, or FM attachments.
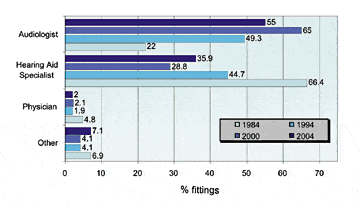
FIGURE 8. Hearing instrument fittings by profession as perceived by the consumer.
Distribution (Table 2). The dispensing role of the audiologist appears to have declined in 2004 as perceived by the consumer of hearing instruments. Sixty-five percent of hearing instruments were fit by audiologists in 2000, compared to 55% in 2004 (Figure 8). In comparison, hearing instrument specialist fittings increased 7.1% to 35.9% of sales in 2004. Hearing instrument fittings by medical doctors remain insignificant. It should be understood that the distribution data represents perceptions of the consumer, who may not always be able to differentiate an audiologist from a hearing instrument/aid specialist.
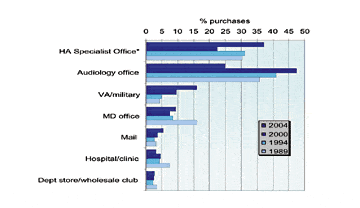
FIGURE 9. Hearing instrument fittings by source of distribution (1989-2004) ranked in order of 2004 fittings. Note that, in the 2004 MarkeTrak, “hearing aid store” was changed to “hearing aid specialist office.”
With respect to where the hearing instrument was fit, referring to Table 2 (which is summarized in Figure 9), there are some major changes over the previous MarkeTrak survey. To more accurately reflect the dynamics of the hearing instrument industry in the consumer’s eye, the term “hearing aid store” was changed to “hearing aid specialist office” in the 2004 MarkeTrak survey. This terminology change resulted in significant decreases in perceived fittings in audiologist offices (47.2% in 2000 to 24.9% in 2004) with a corresponding increase in fittings occurring in hearing aid specialist offices (22.2% in 2000 versus 37% in 2004). Veterans Administration fittings increased to 14.9% (versus 8.4% in 2000), physicians’ offices increased to 8.6% (versus 7.1% in 2000), while mail order sales increased to 5.4% (versus 3.5% in 2000)—the highest it has been in history.
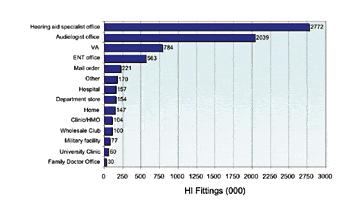
FIGURE 10. Total hearing instrument owner population based on last place of fitting, using MarkeTrak historical data.
In Figure 10, we have estimated the size of the total hearing instrument owner population as of 2004 based on the place where the consumers purchased their last hearing instrument. This data was generated using historical MarkeTrak data. The total hearing instrument user population is 7.38 million people. The top-three sources relative to the current hearing instruments in the field are hearing instrument specialist offices (2.77 million people) making up 37.5% of all fittings, audiologist offices (2.04 million people) making up 27.6% of all fittings, and VA hospitals making up 10.6% of all fittings.
Most notable are the significant increases in the VA population (784,000 in 2004 versus 411,000 in 2000, a 91% increase) and mail order sales (221,000 in 2004 versus 124,000 in 2000, a 78% increase). The top-three locations where a hearing instrument was fitted by an audiologist were: audiologist offices (45.1%), VA hospitals (18.3%), and hearing aid specialist offices (15.9%). Thus, nearly 4 in 5 (79.3%) of all fittings by audiologists were performed in these three settings. The top-three locations where a hearing instrument was fitted by hearing aid specialists were: hearing aid specialist offices (73.7%), audiologist offices (5.7%), and ear doctor offices (4.9%). Likewise, slightly more than 4 in 5 (84.3%) of hearing aid/instrument specialist fittings were performed in these three settings.
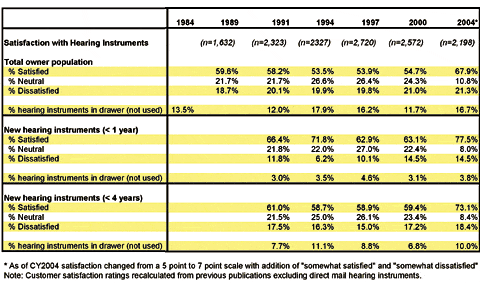
TABLE 3. Satisfaction with custom hearing instruments.
Customer Satisfaction and Usage Trends
Satisfaction with Hearing Instruments. Table 3 documents overall satisfaction with hearing instruments for the years 1989-2004. In the 2004 MarkeTrak survey we changed the scale by adding two additional scale points: “somewhat satisfied” and “somewhat dissatisfied.” Thus, it is difficult discerning trends over time.
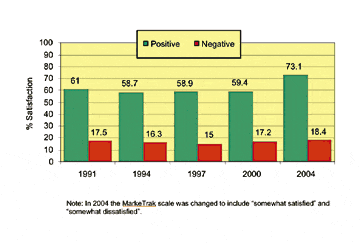
FIGURE 11. US overall customer satisfaction trends for hearing instruments that are 1-4 years old.
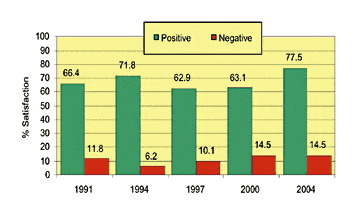
FIGURE 12. US overall customer satisfaction trends for new hearing instruments (<1 year old). The 77.5% positive rating places new hearing instruments in the top-third of products and services in the US.5
Referring to Figure 11, if we consider hearing instruments 4 years of age or less (the effective life of a hearing instrument), the overall customer satisfaction rating is 73.1%; the dissatisfied rating remained virtually the same despite the change in scaling. Customer satisfaction with new hearing instruments less than or equal to one year is 77.5% (Figure 12) which puts it in the top-third of products and services in the United States.5 When considering the large percentage of new digital (eg, programmable) directional hearing instruments available, the 77.5% customer satisfaction rating is consistent with a previous historical MarkeTrak analysis6 that showed programmable directional aids had an 81% satisfaction rating and programmable omni-directional aids had a 72% rating.
Wearing and Age of Instrument Trends. Hearing instrument owners who do not use their hearing instruments increased to 1.2 million. (Author’s Note: A user is defined as an individual reporting they wear and use their hearing instrument. Usage is accepted even if it is only occasional—even if less than a half-hour per day). Part of this is due to the fact that 36% of the hearing instruments owned are 5 years or older; nearly 6 out of 10 hearing instruments in the drawer are at least 5 years old. The average age of hearing instruments increased from 3.8 in 2000 to 4.5 in 2004.
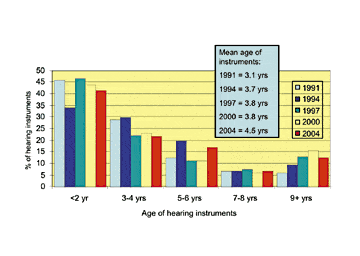
FIGURE 13. Age of hearing instruments.
Figure 13 documents the age distribution of hearing instruments (including hearing instruments in the drawer) as measured in the five previous MarkeTraks. Hearing instruments, which are 2 years old or less decreased slightly to 41.7% of the market. Hearing instruments greater than 9 years old are now 12.6% of the market.
The second publication in this series will report detailed customer satisfaction ratings.
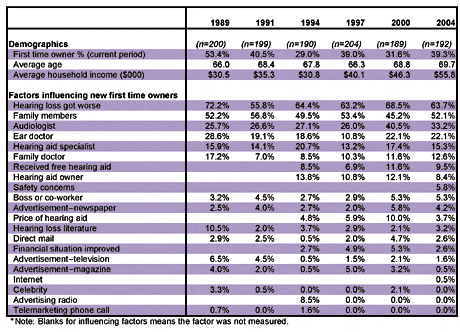
TABLE 4. Demographics of new owners and factors influencing their purchasing decision.
First-Time Users
New Hearing Instrument Owners. Referring to Table 4 and Figure 14, first-time hearing instrument owners increased in 2004 to 39.3% of fittings from 31.6% of fittings in 2000.
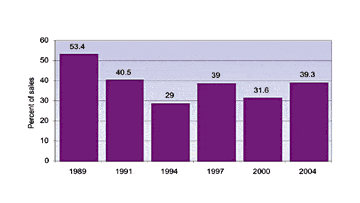
FIGURE 14. First-time user rate expressed as percent of hearing instrument sales.
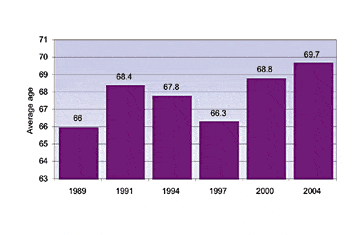
FIGURE 15. Average age of new hearing instrument users.
After a decline between the years 1991 and 1997, the age of new users would appear again to be on the increase. The current new user is 69.7 years of age (Figure 15) with an annual household income of $55,800 (Figure 16) up from $46,300 in 2000. Adjusting for the consumer price index (in 1989 US$), household income of new purchasers has increased by $5,000 since 2000.
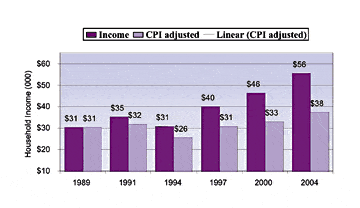
FIGURE 16. New user mean household income and income adjusted for the consumer price index (CPI) in 1989 dollars.
Factors influencing new first-time owners to purchase a hearing instrument in 2004 were:
- Perception that their hearing loss was getting worse (63.7%)
- Family members (52.1%)
- Audiologists (33.2%)
- Ear doctors (22.1%)
- Hearing aid specialists (15.3%)
Safety concerns, asked for the first time, influenced 5.8% of new users. No aided-awareness marketing or public education influence garnered more than 5% of mentions; factors influencing new users less than 2% are: magazine ads, Internet, celebrity public service announcement, radio ad, and telemarketing call. Referring back to the trends in Table 4, the reader will notice that marketing or public education-oriented initiatives have been historically as high as follows: newspaper ad (5.8% in 2000), hearing loss literature (10.5% in 1989), direct mail (4.7% in 2000), TV advertisement (6.5% in 1989), magazine ad (5% in 1997), celebrity public service announcement (3.3% in 1989) and radio advertisement (8.5% in 1994).
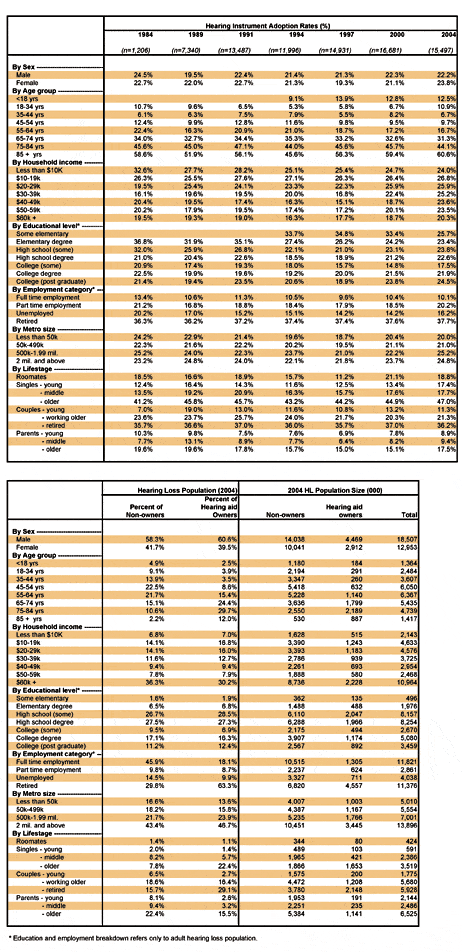
Demographics of the Hearing Loss Population
In Table 5, detailed demography is presented for the year 2004, and hearing instrument adoption rates are compared for the years 1984-2004. Few changes are evident in these 21 year trends. There is a slight increase in hearing instrument adoption for females, young adults, and higher educated people.
In the second part of Table 5 the demography is broken down and expressed as percentages for both the hearing instrument owner and non-owner populations. Among the interesting items are:
- About 6 out of 10 hearing instrument owners and non-owners are male.
- Non-owners on average are more affluent. Their average household income is $55,600 (median=43,800) compared to $50,400 (median=$36,300) for hearing instrument owners.
- The percent of college graduates (28%) are nearly equal for hearing instrument owners and non-owners.
- 56% of adult non-owners are employed compared to 27% of adult hearing instrument owners.
- The modal (most common) lifestyle of a hearing instrument owner is retired couple (29%); the modal lifestyle of a non-owner is older parents (22%).
The third part of Table 5 expresses the hearing loss population in thousands of people. The modal hearing loss population can be described as: male, ages 55-64, with household incomes over $60,000 (mean=$54,400, median=$41,300), with some high school education, full-time employed, living in metropolitan areas greater than 2 million people in the role as an older parent.
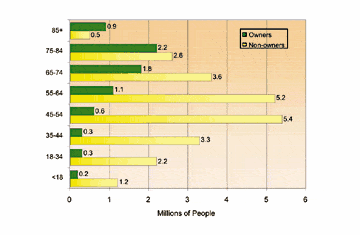
FIGURE 17. Hearing loss population in 2004 by age: hearing instrument owners (green bars) versus non-owners who have a significant hearing loss (yellow bars).
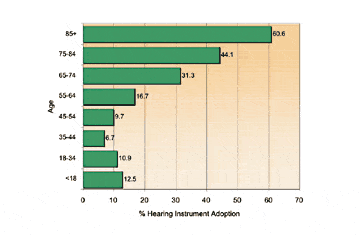
FIGURE 18. Hearing instrument adoption rates by age.
Figure 17 shows the age disparity between hearing instrument owners and non-owners while Figure 18 documents hearing instrument adoption rates by age. The adoption rate for those over age 85 is 60.6%, ages 75-84 is 44.1%, and ages 65-74 is 31.3%. Clearly, it is more difficult to get younger people who have hearing impairment to purchase a hearing instrument. Additionally, the adoption rate among children (younger than 18) is only 12.5%. Future publications will explore this issue further controlling for subjective measures of hearing loss.
The most notable increases in hearing instrument population size since 2000 are as follows:
- The hearing-impaired female population grew 15% compared to males at 8%.
- The largest age segment growths were for 85+ (92%) and 54-65 (27%).
- The education level increased: fewer elementary school educated adults (-23%) occurred in favor of those with some college, college, or graduate school (14%).
- The number of unemployed adults increased 33%.
- The hearing loss population drifted away from small towns (-30%) in favor of larger cities.
- The largest lifestyle change was among older singles (26%).
Key Findings
- The hearing loss population has grown to 31.5 million with continued major increases in the baby boomer and elderly 75+ age brackets.
- Hearing instrument adoption continues to increase slowly. However, most adoption growth has occurred among veterans and through direct mail (including Internet).
- Hearing screenings by physicians have decreased to under 13%, a trend that the hearing health industry must address and reverse.
- Hearing instruments in the drawer have increased to 16.7%; much of this is due to the aging of hearing instruments. It would seem that this is an opportunity for people with hearing loss to upgrade their hearing instruments to modern technology.
- The new user rate has increased to 39% while the average age of the consumer has increased to nearly 70 and their income has increased to $55,000.
- The binaural rate continues to improve. Binaural adoption rates among bilateral loss subjects is now 86%.
- Hearing instrument sales through audiologists has decreased 10% as perceived by consumers. The most notable changes in distribution over the last 4 years continues to be the growth in direct mail and VA fittings.
- The effective retail price for hearing instruments (what the consumer paid out of their pocket) increased at approximately the rate of inflation over the previous 4 years.
- Overall customer satisfaction with new hearing instruments is 77%, placing this product in the top-third of products and services in the United States.
- The adoption rate of hearing instruments by children younger than 18 is extremely low (12.5%). This will be the subject of a special Pediatric MarkeTrak article.
Acknowledgements
This study was made possible by a special grant from Knowles Electronics, Inc, Itasca, Ill.

is the executive director of the Better Hearing Institute, Alexandria, Va. |
Correspondence can be addressed to HR or Sergei Kochkin, PhD, Better Hearing Institute, Ste 420, 515 King St, Alexandria, VA 22314 [email protected].
References
1. Kochkin S. World age demography database. Alexandria, Va: Better Hearing Institute. August 2004. Derived from MarkeTrak VI (CY2000) hearing loss indices by age group applied against the U.S. Bureau of Census—International Programs Center database.
2. Cohen S, Labadie R, Haynes. Primary care approach to hearing loss: The hidden disability. ENT Jour. 2005; 84(1):26-31, 44.
3. Kochkin S. BHI physician program found to increase use of hearing healthcare. Hear Jour. 2004;57(8):27-29.
4. Hampton D. Hearing HealthCare News, Spring 2005.
5. University of Michigan. American Customer Satisfaction Index. Found at: www.theacsi.org.
6. Kochkin S. On the issue of value: Hearing aid benefit, price, satisfaction, and brand repurchase rates. The Hearing Review. 2003;10(2):12-25.
Citation for this article: Kochkin S. Hearing loss population tops 31 million. Hearing Review. 2005;12(7):16-29.


