Dispensing professionals are emerging from a year of fairly flat business growth during 2005, but they are confidently predicting that their businesses will experience far better unit volume growth, gross revenues, and profits in 2006. However, the quickly changing market presents its share of challenges. This year’s survey shows that the price of an average hearing aid in 2005 changed by only 1% compared to 2004, but the operating costs of running a dispensing practice continued to increase—placing an emphasis on efficiency, purchasing power, and marketing. Important changes are also occurring in the utilization of technologies and styles of hearing aids, as digital instruments, directional systems, open-fit products, and behind-the-ear hearing aids continue to gain in popularity. Additionally, binaural fitting rates reached their highest level (80%) yet recorded in the HR Dispenser Survey, and brand utilization by hearing care offices/practices continues to become more refined.

|

These are only a few of the important findings from the HR 2006 Dispenser Survey, which is designed to gauge dispensing activity during 2005 and identify new and emerging trends in the hearing industry.
Survey Methods and Respondents
In March 2006, HR mailed a 3-page survey containing 52 questions on numerous topics related to hearing instrument dispensing and running a dispensing business. The 750 survey recipients were selected from the HR mailing list and weighted by state dispensing activity and profession according to MarkeTrak, HIA, and HR statistics. Over 138 surveys were returned from dispensing businesses in 48 states and the District of Columbia for a survey response rate of 18% (19% when considering that 6 surveys were not tabulated due to various factors). Only the states of Louisiana and New Hampshire are not represented in this year’s survey (Figure 1).
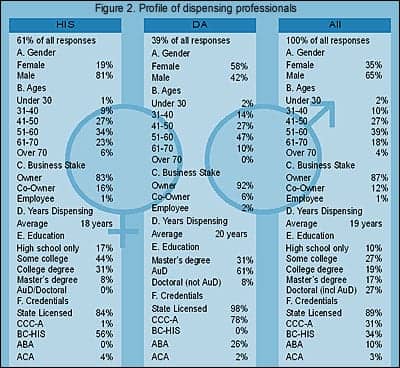
The HR Dispenser Survey is unique from other surveys in that it concentrates on business owners, and seeks dispensing-related answers from this population of decision makers. The 138 surveys were completed almost exclusively by owners (86%) and co-owners (12%) of the offices/practices, who managed, at minimum, 298 offices and 312 dispensing professionals. About two-fifths (39%) of all respondents were dispensing audiologists (DA), while three-fifths (61%) of survey respondents were hearing instrument specialists (HIS) (Figure 2).
These offices and professionals dispensed a reported 49,551 hearing aids during 2005, or an estimated 2.6% of the entire private-sector hearing instrument market (eg, defined in this article as the total net US hearing aid units dispensed minus those units dispensed by the Department of Veterans Affairs, or VA), according to statistics generated by the Hearing Industries Association.1
Important considerations about the survey. Although the dispensing office numbers and volumes appear to be representative of the actual market (for details, see Staff Standpoint, p 6), this year’s survey—like that of last year—has a larger percentage of HIS-owned offices than would be predicted from general industry estimates, with a 60%-40% split between HIS and DA offices, respectively. The prevailing wisdom is that the percentage of hearing aids dispensed in the field favors DA offices. MarkeTrak VII,2 for example, shows that 36% of consumers in 2004 perceived that their hearing aids were dispensed by HIS offices versus 55% by DA offices, while the VA, medical doctors, mail order and the Internet, and other sources made up the remaining 9% of the market. The earlier MarkeTrak VI3 report showed that, in 2000, only 29% of hearing aids were perceived by consumers to come from HIS offices versus 65% for audiologists. This would suggest that HIS offices are gaining steam in terms of dispensing power, although MarkeTrak author Sergei Kochkin, PhD, is quick to note that the survey question regarding this statistic was altered slightly in 2004. He also says that consumers may not be reliable in identifying one type of office from another.4
HR data suggests that DA-owned dispensing offices make up about 60% of the total office population, and may account for around 55% of the private sector hearing instrument sales. But, whatever the actual HIS-vs-DA percentages, it would appear that this year’s survey over-represents the dispensing activity of HIS-offices, and this should be kept in mind when analyzing the overall responses (eg, the “All” or “Average” columns, reflecting the combined responses of HIS- and DA-owned businesses in this survey).
In previous years, the survey has generally picked up responses from 2-5 large HIS-owned offices and 1-3 DA-owned offices that dispense 150 hearing aid units per month or more (eg, over 1,800 units/year). In this year’s survey, there were four HIS-owned businesses that dispensed over 200 units per month and three others that dispensed about 100 units per month, accounting for almost half of the units dispensed by HIS-owned offices. There were no DA-owned offices in this year’s survey that dispensed at these levels. The larger HIS-owned businesses, which typically operate as many as 10 offices and employ a dozen audiologists and hearing instrument specialists, generally do not affect survey numbers significantly in most facets; however, these businesses should be kept in mind when looking at certain averages, such as owners’ compensation or total hearing aid units dispensed. In these cases, HR has provided both averages and medians.
It should also be obvious that these large dispensing businesses have a very real and very important influence on hearing instrument distribution in the United States; in terms of understanding the overall hearing aid market, ignoring them would be unwise.
The “Average” Dispensing Office
Profiling owners. The average DA practice owner is a female (58% vs 42% male) who is 50 years old and has been dispensing hearing instruments for 20 years. Of those owning a DA office, 61% have obtained the AuD degree, 31% have master’s degrees, and 8% have obtained a doctoral degree other than the AuD (one MD responded to the survey and is included with DA-owned offices). A total of 98% of responding audiologists are state licensed, 78% hold CCC-A certification, and 26% have achieved the ABA specialty designator (Figure 2).
The average HIS office owner is a male (81% vs 19% female) who is 54 years old and has been dispensing hearing aids for 18 years. Of these respondents, all have graduated from high school, 44% have taken some college courses, 31% have obtained a college degree, and 8% have graduated with a master’s degree. A total of 84% of HIS respondents in the survey are state licensed, 56% have obtained BC-HIS certification, and 4% are ACA certified.
AuD comes of age. Most of the above statistics are similar to those of previously reported in HR surveys.5 By far, the most remarkable statistic is the doubling in the percentage of AuD audiologists; only 30% and 29% of DA-office owners in the 2003 and 2004, respectively, were reported to have an AuD compared with 61% this year. Clearly, the survey indicates that most dispensing audiologists have embraced the AuD degree, and a large number of private practice audiologists who have sought the new degree have now completed this objective. Beyond the potential educational and professional advantages, this may also be auspicious for hearing industry sales. Although (at least tacitly) supportive of the AuD, some in the manufacturing community have privately complained that the AuD has taken the energy of some of their best customers from the business aspect of dispensing hearing aids; their contention is that it’s difficult for a DA-office owner to fully concentrate on his/her business while enrolled in a doctoral program. This year’s survey suggests that the majority of those DA-practice owners who planned on getting an AuD have now obtained it—and it’s possible their businesses may experience an upturn in dispensing as a result.
Offices and professional staffing. A private practice was the setting for nearly three-quarters of all dispensing businesses (69%, HIS 64%, DA 74%). DA-owned office settings were slightly more diverse than those of HIS-owned offices, with 16% in medical facilities (eg, clinics or hospitals), 6% in retail settings (eg, malls or shopping centers), and 4% in doctors’ offices. HIS-owned offices not located in a private practice setting were likely to be in retail centers (32%) or medical facilities (4%).
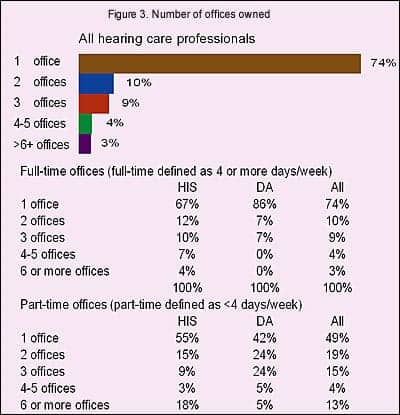
Most businesses surveyed maintained more than one full-time office or operated one or more satellite offices. Only 41% of HIS-owned offices and 47% of DA-owned offices were single-office businesses, maintaining only one full-time office with no part-time office(s).
Three-quarters of all the businesses in the survey had only one full-time office (74%, HIS 67%; DA 86%), about one in five had two or three full-time offices (19%, HIS 22%; DA 14%), and 7% (HIS 11%; DA 0%) maintained four or more full-time offices (Figure 3).
Of those offices maintaining part-time offices (HIS 41%; DA 43%), about half (49%, HIS 55%; DA 42%) had one part-time office, while one-in-five (19%, HIS 15%, DA 24%) had two part-time offices, one-in-seven (15%, HIS 9%, DA 24%) had three offices, with one-in-six (17%, HIS 21%, DA 10%) had four or more.
In terms of staffing, 44% of the HIS-owned offices and 42% of the DA-owned offices featured the owner as the only professional staff member. In other words, most dispensing businesses have more than one full-time and/or part-time professional seeing patients. This is reflected in Figure 4 where the average HIS-owned business employs 2.1 hearing instrument specialists and 0.3 dispensing audiologists. The same holds true for the average DA-owned office which tends to employ 1.6 audiologists and 0.3 hearing instrument specialists.
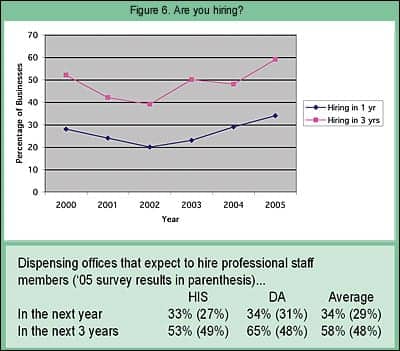
One-fifth of hearing care businesses (21%, HIS 20%; DA 24%) have a multi-disciplinary dispensing staff that includes both audiologists and hearing instrument specialists (Figure 5). This may be as much a result of necessity than preference, as finding qualified dispensing professionals appears to be no mean feat. Figure 6 shows that one-third of all the businesses surveyed (34%, HIS 33%; DA 34%) are planning to add a professional staff member within the next year, and nearly three-in-five (58%, HIS 53%; DA 65%) are planning to add a professional staff member within the next 3 years.
In the past, this “Do you plan to hire…” question has proven to be a good barometer of dispenser sentiment, akin to economists’ Consumer Confidence Index. In all cases, more dispensing professionals than last year indicated that they plan to hire professional staff members within a 1-year or 3-year timeframe. In particular, the percentage of DA-owned businesses that plan to hire a dispensing professional within 3 years increased by 17 percentage points (from 48% to 65%).
Using the past as a guide, this appears to be an auspicious sign for sales. It also points to a possible shortage of dispensing professionals.
|
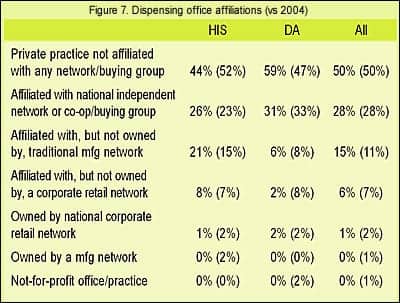
Business affiliations. There were significantly more HIS-owned offices in this year’s survey that belonged to traditional manufacturing networks than in previous years, and significantly more DA-owned offices that held no affiliation to any network/buying group (Figure 7). Other than these two items, the overall percentages relative to network affiliations remained fairly static.
Perhaps the quietest story in the hearing industry is the gains made by corporate retail networks and manufacturer networks during the last 2 to 3 years. Amplifon (the owner of Sonus, Miracle-Ear [including Sears outlets], and National Hearing Centers [including Wal-Mart outlets]) has an aggressive goal of gaining $100 million in business from 2004-2006 and is well on its way to meeting its corporate objectives in the United States. As just one example, Sonus purchased 155 dispensing offices/practices during 2005, including the Hear for Life chain (see the September 2005 HR News, p 14). Audibel, Beltone, and AVADA have also made impressive gains during the last 3 years. The 6 percentage point increase (from 15% in 2004 to 21% in 2005) in HIS offices affiliated with traditional manufacturer networks may reflect this trend, although it should be noted that one would expect to see similar (albeit slightly smaller) increases in DA-owned offices within this category as well, which is not the case in the survey.
Indeed, dispensing audiologists in this year’s survey were decidedly more independent relative to manufacturer/network affiliations than in any HR Dispenser Survey of the last 5 years. Whether this can be viewed as a trend or a mere statistical quirk is hard to say. Viewing separate survey questionnaires, it appears that greater percentages of those offices with higher unit volumes (>30 units/month) report that they do not belong to any buying group, suggesting that these owners may prefer to leverage their practice’s own buying power to gain discounts and concessions from a field of ever-competitive manufacturers.
Dispensing Activity in 2005 in Relation to the Hearing Industry
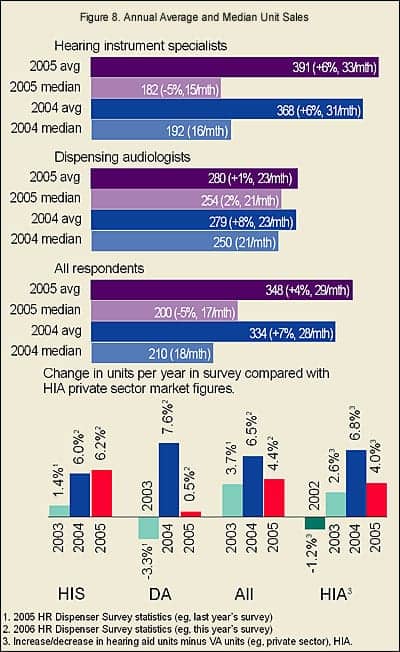
Units dispensed. Figure 8 reflects the answers provided by dispensing professionals regarding the overall number of net units their businesses dispensed during 2004 and 2005. The average number of units dispensed in a typical HIS-owned office was 391, an increase of 6%, but the median number of units dispensed per year was 182, a decrease of 5%. This was due, in some part, to the healthy advances by the larger dispensing offices. However, it also reflects a general trend of the more prosperous dispensing offices doing better, and the smaller offices losing ground.
In DA-owned offices, the average and medians (280 and 254 units, respectively) for units dispensed stayed about the same (1% and 2% increase), and the same general trend of the larger companies posting better unit gains held true.
When looking at the overall average gain in units dispensed during 2005, the survey’s 4.4% sales increase closely parallels the HIA-reported1 sales increase of 4.0% for the private sector (see bottom graph of Figure 8). Likewise, the overall average responses for 2004 versus the 2004 HIA-reported unit gains (6.5% vs 6.8%, respectively) are also in agreement.1
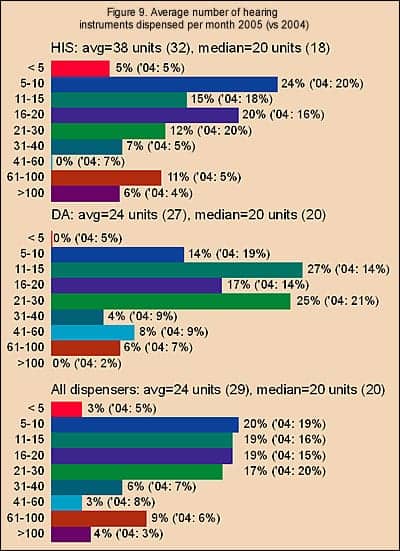
Figure 9 shows the distribution of answers to the question, “[What is the] average number of aids dispensed by your business/practice per month?” For all dispensing professionals, the average response was 24 units per month with a median of 20 units per month. Nearly four-fifths of all the practices in the survey reported that they dispense between 5-30 units per month, with relatively even proportions of businesses dispensing 5-10 units (20%), 11-15 units (19%), 16-20 units (19%), and 21-30 units (17%). Another one-fifth (18%) of dispensing professionals dispensed between 31-100 units per month; 4% dispensed more than 100 units per month, while 3% dispensed fewer than 5 units per month.
|
Taking out the seven large HIS-owned offices discussed previously (eg, those that dispense over 100 units/month), the average and median number of hearing aid units dispensed by an HIS-owned office becomes 22.3 and 18, respectively—essentially the same values as DA-owned practices (24 units and 20 units, respectively).
As discussed in last year’s survey,5 the answers to “average units per month” question often does not match the reported total number of units dispensed in a year (eg, the dispensers’ reported “units for the year” divided by 12 [months] generally produces a lower number than their reported “units-per-month” figure). This is further confirmed by with the discrepancies seen between Figures 8 and 9.
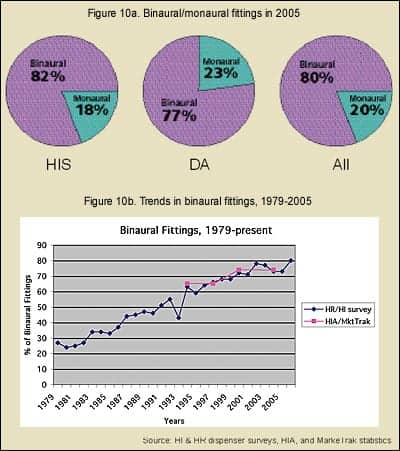
Binaural usage reaches 80%. This year’s survey indicates that binaural fittings surged to record highs, increasing from 73% in 2004 to 80% in 2005 (Figure 10a). From 2001 to 2003, binaural fitting rates oscillated between from 71% (HIS 71%, DA 71%) and 78% (HIS 75%; DA 81%), before receding back to 73% (HIS 74%; DA 73%) in 2004. While much of the increases in the past few years are due to the higher binaural fitting rates seen in DA-owned offices, the binaural fitting rate of HIS offices (82%) during 2005 actually exceeded that of DA offices (77%).
The popularity of binaural fittings has been one of the main reasons for hearing aid unit volume growth during the last two decades.6 In the last 25 years, the binaural-to-monaural fitting rate has essentially flip-flopped, with binaural fittings constituting only 27% of all patient fittings in 1979, but making up 73% of all the fittings in 2004 (Figure 10b).
MarkeTrak2 statistics on binaural fitting rates closely parallel HR Dispenser Survey statistics (Figure 10b), with all hearing aid users who purchased within the MarkeTrak survey period having binaural fittings 65.3% of the time in 1994, 65.2% in 1997, 74.2% in 2000, and 71.4% in 2004. These same statistics also indicated that 86% of all consumers who had a bilateral loss opted for binaural hearing aids in 2004.2
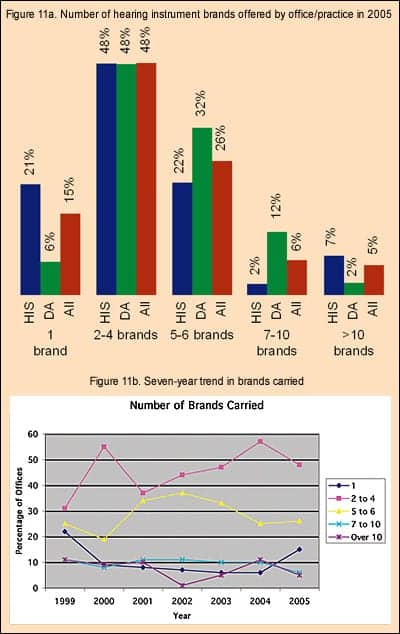
Brand Utilization. How many brands of products do most dispensing professionals use? Figure 11a shows that the most common situation is for dispensing offices/practices to offer 2-4 brands of hearing aids (48%, HIS 48%; DA 48%). When comparing dispensing businesses, DA-owned offices are more likely to offer 5-10 brands of hearing aids (44% vs 24% of HIS-owned offices), whereas HIS-owned offices are more likely to be single-line dispensers (21% vs 6% of DA offices). This is largely due to the history of the dispensing profession; a far greater percentage of HIS-owned offices belong to manufacturer and retail networks, as detailed in Figure 7.
Figure 11b suggests that single-line dispensing fell off rapidly after 1999, a time when one of the larger retail networks was experiencing internal upheaval, but is probably now on the rebound (see discussion on dispensing office affiliations). In the editor’s opinion, for whatever reason, dispenser surveys (including HR’s) appear to have a spotty record in accurately capturing single-line dispensing data and reflecting this important market segment’s influence on the industry. This year’s survey may be a rare instance in which the totals are at least somewhat closer to the market reality. HR estimates that manufacturer and retail networks constitute about one-fifth of the hearing instrument market.
Figure 11b also shows that the percentage of those offices/practices using 2-4 brands of hearing instruments has risen steadily since 2001, while the number utilizing between 5-6 brands has similarly fallen. The number of offices using 7-10 brands or 10+ brands of hearing aids has remained relatively low.
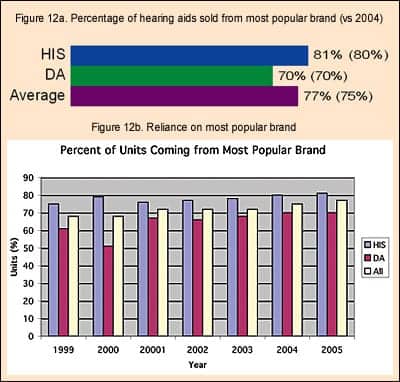
At the same time, dispensing offices’ reliance on their most-used hearing instrument brand has risen slowly but steadily during the last 7 years (Figure 12a-b). In 2005, 77% of the hearing aids dispensed in an average business came from one brand (HIS 81%; DA 70%), representing only a 2 percentage point increase over the previous year (75%, HIS 80%; DA 70%), but an increase of 9 percentage points since 1999 (68%, HIS 75%; DA 61%).
The complexity of fitting systems, the need for a familiarity with proprietary fitting software, increasingly divergent fitting strategies among the manufacturers, as well as ordering efficiency and volume discounts, probably all play a role in this trend. Leveraging one’s dispensing power is a common strategy for those offices that can sell larger quantities of units (see Figure 9), for there is considerable competition among manufacturers for these larger, multi-line offices. Both the decrease in the number of brands carried and the increasing reliance on “favored brands” may ultimately have an impact on the industry, as it tends to benefit the larger manufacturers who have deeper product offerings. This has the potential to make things even tougher for those smaller manufacturers who concentrate on filling distinct niches and who cater to individual office/practice needs. Ultimately, it could also spur industry consolidation.
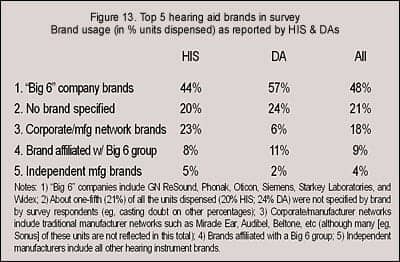
A pilot question in this year’s survey asked for the specific names of the top-5 brands used in the office/practice and the percentage usage of those brands (Figure 13). Because this pilot question was part of a supplemental questionnaire and was not answered by as many dispensing professionals (21%, in terms of unit volume), it is impossible to draw any firm conclusions from the results. However, looking at the total units dispensed by businesses in the survey, 48% of those units (HIS 44%; DA 57%) came from the so-called “Big-6” hearing instrument manufacturers (GN ReSound, Oticon, Phonak, Starkey Laboratories, Siemens, and Widex); 18% (HIS 23%; DA 6%) of the units came from corporate retail and manufacturing network brands like Audibel, Beltone, and Miracle Ear (Note: This total would be higher if independent offices that are affiliated with networks, such as Sonus and AVADA, were included); 9% of the units (HIS 8%; DA 11%) came from brands of manufacturers that belong to umbrella groups which include a Big-6 company; and 4% of the units were brands not associated with a Big-6 company/group or affiliated with any retail network (HIS 5%; DA 2%).
Virtually every US manufacturer of hearing aids (including self-assembled units) was represented in the responses, and it is probably safe to assume from the set-up of the question and the results shown in Figure 13 that independent manufacturers are under-represented. Again, it must be emphasized that, because of the large number of unallocated unit brands and the small sample size, it’s difficult to draw any realistic conclusions from the data. However, one worthwhile conclusion might be that it appears DA-owned offices tend to rely slightly more on the Big-6 companies than HIS-owed businesses. Additionally, judging by individual survey responses, HIS-owned offices tend to rely on smaller manufacturers for more of their niche customer needs (eg, although a large manufacturer might have the lion’s share of their dispensing business, they often rely on a greater variety of smaller manufacturers to fill out the rest of their product needs).
When viewing the information in Figures 11-13, virtually every sector in the manufacturing arena is facing very intense competition for becoming the “manufacturer of choice.” Manufacturers are hungry for more unit volume, and from that perspective, it appears to be a good time to own a well-performing dispensing business.
Today and Tomorrow’s Hearing Aid Users
With the arguable exception of finding the “perfect” hearing system for understanding speech in noise, there is probably no bigger Holy Grail in the hearing industry than finding a device that will appeal to young people. The average age of a first-time hearing aid purchaser is 70, and this number has been rising for 8 years.2 The need for finding products that appeal to younger hearing-impaired people is two-fold: 1) There is ample evidence that people younger than age 65 would benefit from amplification both in terms of quality of life and general health7, and 2) Younger people constitute, by far, the largest number of people who need, but do not use, amplification.
MarkeTrak VII2 shows that the hearing aid adoption rate for people with significant hearing impairment at age 85+ is 61%, at ages 75-84 is 44%, and at ages 65-74 is 31%. However, from there the adoption rate drops off the table. Only 17% of people ages 55-64 with significant hearing impairment obtain a hearing aid, and only 10% of those ages 45-54. According to these same statistics,2 in the 65+ age group there are 4.9 million hearing aid owners versus 6.9 million non-owners who could benefit from hearing aids (eg, 41% market penetration); however, in the 45-64 age group, there are only 1.7 million owners versus 10.6 million non-owners (eg, 14% market penetration).
This latter group of users is critical for greater industry growth rates, and the industry has been trying for years—first through smaller hearing aids like ITEs, ITCs, and CICs, and now through open-fitting aids and an increasing array of stylish designs and add-on features—to coax these younger users into trying amplification.
Are we attracting a younger crowd? This year’s survey asked dispensers if they thought their client base is getting older, younger, or staying the same relative to average age. The results are both heartening and surprising. More than half (55%, HIS 53%; DA 58%) of respondents said their client base is getting younger. About one-third (32%, HIS 34%; DA 28%) of respondents said that they noticed no change in the average age of their client base, while only 13% (HIS 13%; DA 14%) said their clients were getting older.
|
Although this is, by no means, a definitive test for discovering whether the hearing industry is starting to bear fruit in its efforts to court younger adults, it is at least comforting to know that most dispensing professionals do not believe that the average age of “today’s patient” is getting older. Of course, the skeptic might say that it’s the dispensing professionals who are getting older and it just appears to them that the average age of their clients is getting younger!
Age of clients. The above data withstanding, no significant changes were noted in the distribution of client ages. Overall, more than half (55%, HIS 58%; DA 48%) of all patients/clients were between the ages of 65-84, while about one-quarter (23%, HIS 21%; DA 26%) were between the ages of 30-65. HIS-owned offices saw greater percentages of clients older than age 85 (19%) compared to DA-owned offices (13%), while DA-owned offices saw larger percentages of clients who were younger than age 30 (12%) compared to HIS-offices (3%). As demonstrated in previous surveys, it is evident that DA-owned offices tend to serve a younger clientele.
All these statistics are within a 1-3 percentage points of last year’s totals,5 and they show no evidence for there being a youth movement in hearing aid use.
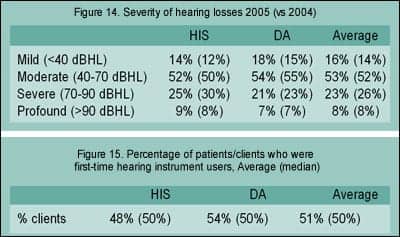
Severity of hearing loss. As with the age of clients, there was little change in responses to the question on the severity of clients’ hearing losses (Figure 14). Patients in 2005 were reported by all dispensing professionals to have predominantly moderate (40-70 dBHL) hearing losses (53%, HIS 52%; DA 54%). People with severe hearing losses (70-90 dBHL) constituted 23% of new clients (HIS 25%; DA 21%), and profound losses (>90 dBHL) constituted 8% of new clients (HIS 9%; DA 7%).
|
If there were a youth movement in the hearing care field, one might expect to see larger percentages of patients who have mild and moderate losses. In fact, the percentage of clients with mild losses, as reported by all dispensing professionals, plummeted in last year’s survey to 14% (HIS 12%; DA 15%) after having increased steadily from 17-21% during 1998-2000 to 25-28% during 2001-2003. The reason for this is unknown; however, it might be noted that reported mild loss percentages did increase, moving upward to 16% in this year’s survey.
Work status. This year’s survey also asked dispensing professionals for the first time about the employment status of their clients. Survey respondents reported that about two-thirds (65%, HIS 70%; DA 58%) of their clients were retired or unemployed, 15% (HIS 15%; DA 16%) were employed on a part-time basis, and 20% (HIS 15%; DA 26%) were employed full-time. Again, the statistics suggest that DA-owned offices tend to serve a younger clientele than HIS-owned offices.
These figures roughly parallel MarkeTrak VII2 data, which reports that 63% of hearing aid owners are retired, 10% are unemployed, 9% have part-time jobs, and 18% have full-time employment.
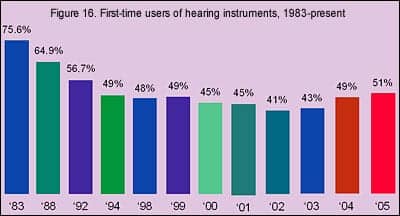
First-time users. Dispensing professionals reported that just over half (51%, HIS 48%; DA 54%) of their clients/patients in 2005 were first-time users of hearing instruments—the first time in 14 years that the new-user rate has climbed above 50% (Figures 15-16). One of the most encouraging items in last year’s survey was that the percentage of first-time customers reported by survey respondents rose to 49% (HIS 48%; DA 50%)—an increase of 6 percentage points over 2003. So this year’s 2 percentage increase is all the more encouraging.
There has been a lot of hand-wringing about the statistics on first-time users of hearing instruments (Figure 16) as a percentage of yearly hearing instrument purchasers. In the 1980s, first-time user rates were sometimes in the 60%-80% range, but these rates have fallen off to as low as 41% in 2002. HR survey statistics suggest that the first-time user rate has been increasing (albeit very slowly) for 3 to 4 years.
MarkeTrak VII2 reported the first-time user rate in 2004 as 39.3%, up from 31.6% in 2000. The last time MarkeTrak statistics showed a first-time user rate exceeding 50% was 1989 (53.4% first-time user rate).
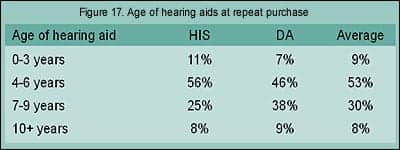
Age of previous hearing aids. How many years do hearing aid users keep their hearing aids before they return to purchase another device? Dispensing professionals report that about half of their clients (53%, HIS 56%, DA 46%) use their device(s) for 4-6 years before returning to upgrade or otherwise purchase another hearing aid(s). About one-third of clients use their hearing aids for 7-9 years (30%, HIS 25%; DA 38%), suggesting that about four-in-five consumers (83%) use their hearing aids for 4-9 years. About equal percentages of returning customers used their hearing aids for 10 years or more (8%, HIS 8%; DA 9%) or for less than 4 years (9%, HIS 11%; DA 7%).
The average age of purchasing a hearing aid is 70 and the average lifespan of a US citizen is 78 years. Thus, the morbid truth appears to be that, on average, most people require only two sets of hearing aids during their lifetime. MarkeTrak VII data indicates that 41.7% of hearing aids in the market are less than 2 years old, while 12.6% are 9 years old or more.2
Hearing Aid Styles and Technologies
Rapid changes in product technology have been sweeping the hearing industry. Digital technology, directional microphone systems, open fittings, behind-the-ear hearing aids, and telecoil use have all made significant gains in recent years, and the influence of these trends is wide-ranging for dispensing professionals and manufacturers and suppliers.
|
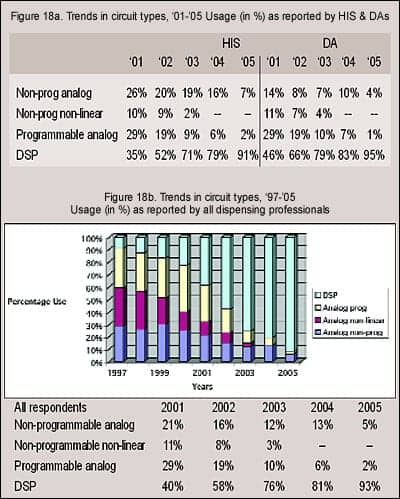
Circuit technology. As shown in previous surveys, as well as HIA statistics,1 digital technology now dominates the hearing instrument market (Figures 18a-b). Dispensing professionals responding to the survey reported using digital technology in 93% of their fittings during 2005 (HIS 91%; DA 95%). Non-programmable linear devices were used in only 1 in 20 fittings (5%, HIS 7%; DA 4%), while programmable analog aids were used in about 1 in 50 fittings (2%, HIS 2%; DA 1%).
These figures are in line with HIA statistics,1 which indicate that DSP hearing instruments made up 89% of the market in 2005, compared to 83% in 2004, 65.8% in 2003, and 44.6% in 2002. In the first quarter of 2006, HIA reports that DSP instruments accounted for 90.4% of the market.
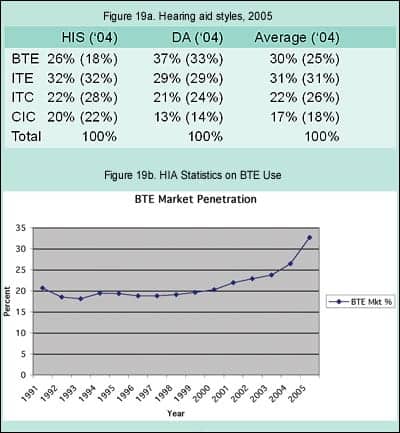
Hearing aid styles. One of the biggest trends in hearing instrument use during the last 3 years is the resurgence in the popularity of BTEs (Figure 19a). According to the HR Dispenser Survey, BTE use now constitutes almost one-third (30%) of the market in 2005 compared to one-fifth of the market 5 years earlier (Figure 19b). More impressive is the fact that nearly two-of-five (37%) hearing aids dispensed by DA-owned offices are BTEs, compared to one-quarter (26%) of the units dispensed by HIS-owned offices. However, it should be noted that the use of BTEs in HIS-owned offices jumped by 8 percentage points from 2004-2005.
Greater utilization rates for BTEs can be explained by the popularity of directional microphone systems and open-ear systems (both of which are discussed below). The fact is that today’s BTEs have a lot going for them. Not only are there new and exciting open-fitting systems that have only recently become available, but the cosmetics associated with BTEs—including sporty slim-tube designs and receiver-in-the-ear (RITE) options—are specifically intended to appeal to a younger clientele while having obvious appeal to the current demographic of hearing instrument users (see discussion under “Today and Tomorrow’s Hearing Aid Users”). Additional factors leading to increased use of BTEs include new systems like the Sebotek PAC and Vivatone, and a range of new high-tech options and interfaces that continue to surface for BTE users, ranging from wireless phones and PA systems, to Bluetooth technology, to possible future interfaces with PDAs and portable computers.
HIA statistics show that, in the first quarter of 2006, BTE fittings constituted a whopping 42.0% of the market, after consistently making up only one-fifth (18.1-19.05%) of all the hearing aids dispensed during the last decade (Figure 19b). Starting in 1999, BTE percentages started drifting upward very gradually by about 0.5%-1% annually, probably due to the increasing use of directional hearing instruments, which arguably favor the BTE design. The advent of open-fitting hearing aids precipitated a large increase in BTE usage in 2004 (to 26.4% of the market) and an even larger increase in 2005 (to 32.6%).
Survey respondents reported that they used ITEs for 31% of their fittings (HIS 32%; DA 29%), ITCs for 22% of their fittings (HIS 22%; DA 21%), and CICs for 17% of their fittings (HIS 20%; DA 13%).
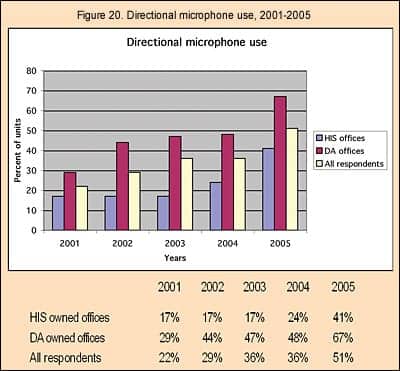
Directional microphones. The use of directional microphone systems, according to this year’s survey, experienced a huge increase (Figure 20). Dispensing professionals reported that 51% (HIS 41%; DA 67%) of the hearing aids they dispense contain directional microphone systems compared to 36% in 2004—an increase of 15 percentage points. With good reason, hearing instruments with directional microphones have become one of the most relied-upon technologies to address hearing-in-noise issues. About two-thirds (67%) of the units dispensed by DA-owned offices were reported to use directional systems, which in view of the data presented in Figure 19, suggests that directional systems are nearing market saturation levels for DAs (eg, the space limitations on ITCs and CICs usually preclude a directional microphones). Editor’s Note: The percentage-use figures for directional microphone hearing aids, volume controls, and telecoils may be artificially high in this year’s survey due to the position of this question in the survey. A question about the percentage of open-fit earmolds for BTEs immediately preceded the questions on these features, and respondents may have believed that the questions applied to BTE use only.
|
A special HIA survey8 of manufacturers revealed that 35.2% of all hearing aids sold in 2005 contained directional systems, and almost half (47%) of all BTEs utilize them. As might be expected, directional microphone utilization rates in ITEs were about half that of BTEs. Only 18.9% of full-shell ITEs, 18.3% of half-shell ITEs, 17.8% of ITCs contained directional systems. These HIA percentages are consistent with last year’s survey results which showed a market penetration of 36% for directional aids (DA 48%; HIS 24%).
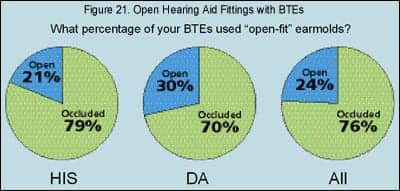
Open fittings. Dispensing professionals reported that nearly one-quarter (24%, HIS 21%; DA 30%) of the BTE aids they dispense use open-fit earmolds (Figure 21). HIA’s special survey8 reported that 12% of BTEs used batteries that were smaller than Sizes 675 and 13—applications that would most likely be indicative of the smaller open-fit BTEs (eg, one might view this as the maximum market penetration of open fittings).
It has been noted by many researchers that this product class holds excellent prospects for attracting younger users, as the instant-fits, cosmetics, and other factors (eg, reduction of the occlusion effect) make open fittings attractive to this market segment. Again, if the survey can be used as a crystal ball, it is safe to say that the percentages of open-fit hearing aids will continue to climb in 2006.
VCs, telecoils, and remotes. The survey suggests that volume controls were prescribed in over half (51%, HIS 48%; DA 39%) of all fittings, telecoils were incorporated in nearly half (46%, HIS 39%; DA 56%), and remote controls were used with 4% (HIS 3%; DA 7%) of the hearing aids dispensed. (See Editor’s Note under directional microphones.)
Hearing Aid Selection, Fitting, and Verification
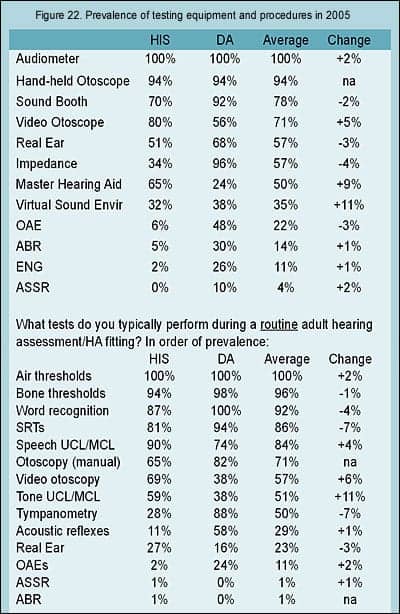
All hearing care offices/practices in this year’s survey possessed an audiometer, and virtually all (94%) had a hand-held otoscope (Figure 22). More than half of all the dispensing offices in 2005 also possessed a sound booth (78%, HIS 70%; DA 92%), video otoscope (71%, HIS 80%; DA 56%), and real-ear measurement/probe mic system (57%, HIS 51%; DA 68%). Additionally, most DA offices had impedance testing equipment (57%, HIS 34%; DA 96%) and most HIS offices had a master hearing aid (50%, HIS 65%; DA 24%). OAE and ABR testing systems were found in about one-half (48%) and one-third (30%) of DA-owned offices respectively, but in very few HIS-owned offices (6% and 5%, respectively).
Of all the equipment types surveyed, virtual sound environments and environmental sound simulators were found to experience the largest gains in prevalence. Sound simulation systems were located in one-third of the offices (35%, HIS 32%; DA 38%). Virtual sound systems have been a focus of many manufacturers and suppliers in the past few years, as demonstrated by recent articles on these systems (eg, see last month’s edition of HR, which featured this subject).
|

ENG equipment for the testing of vestibular and balance disorders were found in about one-in-10 offices, with a quarter (26%) of DA-owned offices and 2% of HIS-owned offices possessing them. ASSR equipment was found in only 4% of all offices (HIS 0%; DA 10%) in the survey.
What constitutes the elements of a routine adult hearing assessment and hearing aid fitting? The HR 2006 Dispenser Survey suggests that clients/patients will almost always (more than 80% of the time, bottom table in Figure 22) receive air and bone threshold testing, word recognition and speech reception threshold testing, and speech UCL/MCL testing. The majority (50% or more) of dispensing professionals also incorporate into their routine testing and fitting protocols otoscopy, tone UCL/MCL testing, and tympanometry. HIS-owned offices are more likely to perform speech and tone UCL/MCLs and video otoscopy than DA-owned offices, and DA-owned offices are more likely to perform manual otoscopy, tympanometry, acoustic reflex tests.
Surprisingly, only about one-quarter (23%, HIS 27%; DA 16%) of the offices in this year’s survey used REM on a routine basis, despite several articles that have pointed out the need to do so.9,10 In fact, DA offices were more likely to use routinely otoacoustic emission testing (24%) than REMs.
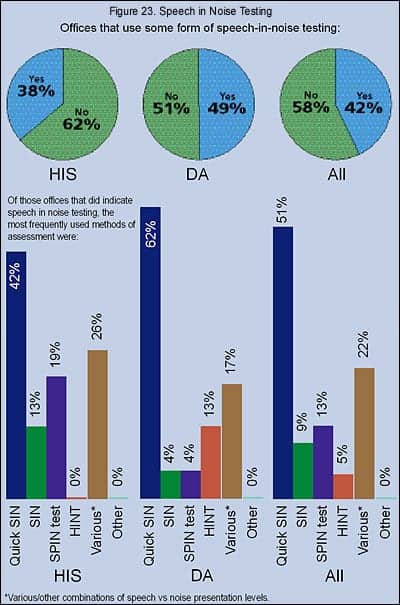
Speech in noise testing. According to Figure 23, about two-in-five offices (42%, HIS 38%; DA 49%) in this year’s survey tested patients with various speech-in-noise test methods, the same overall percentage as 3 years ago (HIS 30%; DA 56%). The QuickSIN and SIN appear to be the most popular test methods among those who perform speech-in-noise testing (60%, HIS 55%; DA 66%), followed by various combinations of speech-vs-noise presentation levels (22%, HIS 26%; DA 17%), the SPIN test (13%, HIS 19%; DA 4%), and the Hearing in Noise Test (HINT, 5%, HIS 0%; DA 13%).
Verification tools. Three-quarters (76%, HIS 75%; DA 77%) of dispensing professionals reported that they use some kind of tool to verify satisfaction or benefit with their products and services, representing a 5 percentage point increase over the last year (Figure 24). The most common verification tool was a survey generated by the professional’s own office (63%, HIS 75%; DA 47%). One-fifth of the dispensing offices (20%, HIS 13%; DA 30%) used the Client Oriented Scale of Improvement (COSI), and 11% (HIS 10%; DA 12%) used the Abbreviated Profile of Hearing Aid Benefit (APHAB).
This upward trend is one more hopeful sign. Kochkin4 has noted that, for dispensing office protocols, the two largest determinants for increasing customer satisfaction with hearing instruments is: 1) counseling time, and 2) the use of outcome measurements.
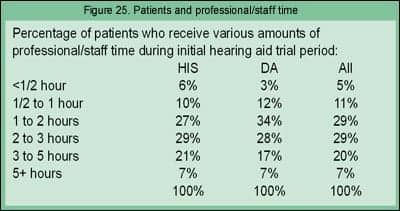
Counseling and follow-up. This year’s survey asked what percentage of patients take various amounts of time during the initial hearing aid trial period (Figure 25). The results suggest that, on average, there is a fairly even distribution of time spent with patients, and the most common time-periods for spending on patients is 1-3 hours (58%, HIS 56%; DA 62%). However, when examining individual surveys, most dispensing offices/practices were more likely to spend a specific amount of time per fitting. On average, one-fifth of patients (20%, HIS 21%; DA 17%) require 3-5 hours of time, and 7% of patients (HIS 7%; DA 7%) require more than 5 hours. About 5% of patients require a 1/2-hour or less (HIS 6%; DA 3%), according to respondents. Regarding the 1/2-hour or less time period, some dispensing professionals made it clear that this percentage represented experienced patients who did not have a need or desire for extended counseling or fine-tuning periods, or other special situations.
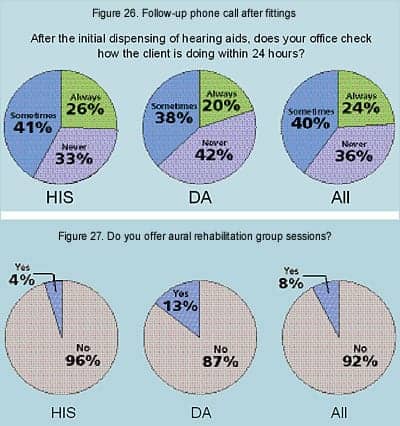
The use of personal follow-up phone calls by physicians, dental surgeons, and other health care professionals has become standard operating procedure for many practices. This year, HR asked if, after the initial dispensing of the hearing aid, does the office check to see how the client is doing within 24 hours (Figure 26). About a quarter (24%, HIS 26%; DA 20%) of the offices surveyed always check on patients within the 24-hour period, while 40% sometimes check on the patient (HIS 41%; DA 38%), and 36% never do within that time frame (HIS 33%; DA 42%). It should be noted that several respondents said that their office policy is to check within a reasonable time frame (eg, 1-3 days).
|
Although correlated to (at least) a short-term reduction in self-perception of hearing handicap,11 it is well known that group aural rehabilitation counseling sessions are underutilized in the field. Only 8% (HIS 4%; DA 13%) of the survey respondents said they utilize some form of group aural rehabilitation (Figure 27). However, several did note that, although they do not offer group aural rehab, they do provide their clients with information on how to access group AR sessions via SHHH, AG Bell, or other local organizations.
Hearing Instrument Pricing
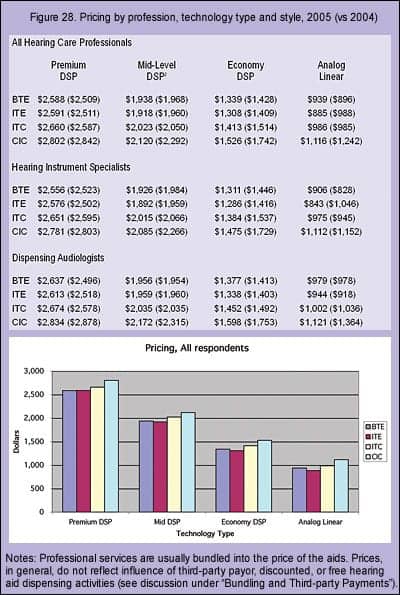
Similar to last year’s HR Dispenser Survey, respondents were asked to fill in their 2005 pricing for four hearing aid technology categories (Premium DSP, Mid-level DSP, Economy DSP, and Analog linear aids) relative to each style of hearing aid (BTE, ITE, ITC, and CIC). This yielded 16 different price categories for HIS- and DA-owned businesses, as well as the overall prices for both office types (Figure 28). A comparison of 2005 hearing aid prices with last year’s prices suggests that:
– All CICs (eg, all technologies and professions) decreased in price, particularly in the mid-level and economy DSP categories, by an average of $75-$216 (1%-12%).
– Premium digital hearing instruments experienced a small increase for all styles, except CICs, by an average of 3% (about $80).
– Mid-range DSP prices, in general, stayed the same, except for CICs where prices fell by an average of $172 (8%).
– Economy DSP prices decreased by about $100 (7%) for BTEs, ITEs, and ITCs, and twice that for CICs.
– In general, prices in HIS-owned offices tended to show larger price decreases than those of DA-owned offices.
|
Indeed, these trends are supported by industry analyst reports, as well as general observation: Premium DSP products with an assortment of advanced features are being introduced at higher price levels, while a heated price-and-feature competition resumes in the Economy DSP category—a class of devices that assumes an ever-impressive variety of product features at prices of about $400 more than analog aids. In fact, this is the prime reason why analog programmable aids have been virtually eliminated from the market (2% market share, according to this survey), and the use of linear analog aids continues to dwindle (5% market share in this survey).
Why did CIC prices in the survey decline significantly across all categories and professions? One possible explanation is that open-fitting BTE technology is attracting more cosmetically conscious consumers away from CICs, and the forces of supply and demand are driving CIC prices downward.
The graph at the bottom of Figure 28 shows the combined DA- and HIS-office prices of the individual styles (BTEs, ITEs, ITCs, and CICs) grouped in the four technology categories. In general, Premium DSP aids exceed $2500, Mid-level DSP aids are priced at around $2000, and Economy DSP aids at around $1300. The “good, better, best” system is capped off by the Analog linear category priced below $1000. Within the categories, there is the familiar system of BTEs and ITEs being fairly similar in price, with ITCs being about $50-$100 more expensive, and CICs being $100-$150 more expensive still.
|
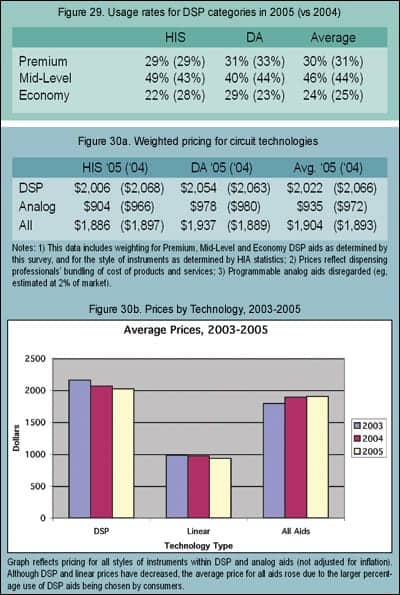
DSP market stratification. Survey participants were also asked “Of your DSP aids dispensed, what percentage were [from the] premium (highest priced) DSP product lines, mid-range DSP product lines, and economy (lowest priced) DSP product lines.” Figure 29 shows that, relative to their use of DSP aids (93% of units sold according to this survey), the average office/practice dispenses 30% of its digital aids from premium lines, 46% from mid-level lines, and 24% from economy lines. These overall totals show no significant change from last year’s survey. It should be cautioned that the HR Dispenser Survey does not define product attributes or price levels for the product categories a priori; dispensing professionals are left to define the products themselves (eg, they are simply asked to list the prices for each category). In general, when asking the same question of manufacturers, their figures for premium product lines are slightly lower than reported by dispensers (eg, 15%-25%, and they provide more variable answers for the mid-level (40%-65%) and economy DSP (eg, 25%-40%) lines.
It should also be noted that, only 5 to 10 years ago, a premium product would be introduced and then, after a few years, this product would be relegated to lower pricing categories as newer premium products were introduced. Today, products are created that are specifically targeted via prices and features for a defined product category, and that product’s revenue-producing lifespan is (with some notable exceptions) as short as 9-18 months. In other words, competition in the hearing industry has become far more intense—driven largely by the maturing digital market.6 This is all very good news from a consumers’ perspective.
Weighted average prices. The statistics shown in Figure 29 regarding utilization of premium, mid-level, and economy DSP aids, as well as 2005 statistics from HIA1 regarding the utilization of hearing instrument styles, were applied to the prices found in Figure 28 to arrive at the weighted average pricing for different circuit technologies, shown in Figure 30a. The results suggest that consumers paid an average price of $935 (HIS $904; DA $978) for analog linear hearing instruments and $2,022 for DSP hearing instruments (HIS $2,006; DA $2,054).
When considering all hearing care professionals, technologies, and styles of hearing aids, the weighted average price of a hearing aid in 2005 was $1,904—a nominal ($11, or 1%) increase over the 2004 average price of $1,893. Although prices have generally decreased across all technology categories and styles of hearing aids (Figure 30b), because more consumers continue to choose the higher-priced digital aids (eg, the market changed from 83% digital in 2004 to 89% in 2005),1 the average price of a hearing aid remained essentially unchanged. The caveats mentioned previously regarding the influence of the larger HIS-owned dispensing offices and this survey being over-represented by HIS-owned offices should also be considered when viewing this data.
As noted earlier, HIS-owned offices had the largest price decreases from 2004 to 2005, with average prices falling by $62 for both technology types: to $2,006 for DSP aids (a -3% change), and $904 for analog aids (a -6% change). Due to the increased percentage utilization of the higher priced digital aids, the overall average price for a hearing aid dispensed in an HIS-owned office essentially remained the same at $1,886 (a change of -$11, or -0.6%).
DA-owned office average prices for DSP aids essentially remained the same at $2,054 (a change of -$9, or -0.4%), as did analog aids ($978, a change of only -$2). The overall average price for a hearing aid dispensed in a DA-owned office was $1,937, a $48 (2.5%) increase over 2004 prices.
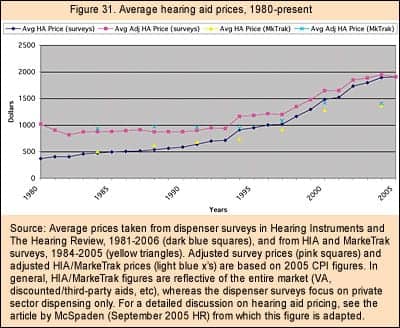
Figure 31 shows average real-dollar and CPI-adjusted hearing aid prices as reported by both The Hearing Review and Hearing Instruments dispenser surveys, and HIA and MarkeTrak consumer surveys. Prices have roughly doubled in response to the widespread use of programmable, CIC, and DSP hearing instrument technology, which have commanded significantly higher prices. However, these numbers are within historical norms for periods of new technology transitions,12 and still represent—in terms of total user costs, benefits, and service life—excellent value for the consumer.13
Bundling and third-party payments. It is important to note that the above prices reflect the predominant practice of bundling goods and services together and reporting them as the “hearing aid price.” In 2005, 88% of all dispensing professionals bundled the prices of their goods and services (HIS 95%; DA 76%). In other words, only 5% of hearing specialist offices and 24% of dispensing audiologists’ offices itemized their billing, separating their product costs from their fees for testing and services.
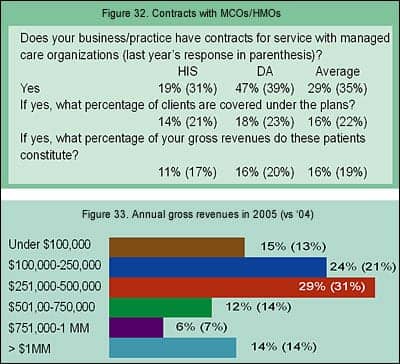
Additionally, the HR Dispenser Survey’s reported prices, in general, do not take into account free, discounted, or third-party payor hearing aids. Figure 32 shows that about one-third (29%, HIS 19%; DA 47%) of all dispensing offices maintain contracts for services with managed care organizations (MCOs) and/or health care maintenance organizations (HMOs). Those dispensing offices that do maintain contracts have about one-in-six of their clients/patients covered by the insurance (16%, HIS 14%; DA 18%), and those clients account for 16% of their gross revenues (HIS 11%; DA 16%). All of these figures are slightly lower than last year’s survey. The prices also do not take into account the large number of hearing aids dispensed annually by the Department of Veterans Affairs (VA), which makes up 14% of the total hearing instrument market.
As a reference, MarkeTrak VII2 indicates that, in 2004, consumers paid an average out-of-pocket price of $1,369 for a hearing aid, spending $1,514 for a BTE, $1,306 for an ITE, and $1,361 for an ITC.
|
Business and Market Indicators for 2006 and Beyond
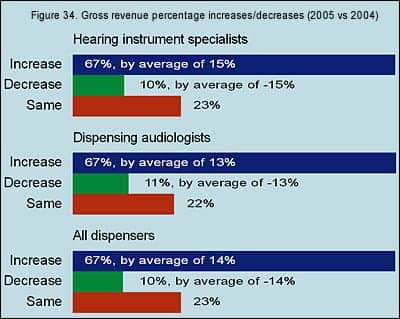
Gross revenues in 2005. Gross revenues for all dispensing offices during 2005 stayed about the same as 2004, according to survey respondents (Figure 33), with percentages that did not vary by more than 3 percentage points. This is probably a reflection of the small (1%) increase in average hearing aid prices discussed previously. The majority (53%) of dispensing businesses in this year’s survey experienced gross revenues of $100,000-$500,000 (HIS 49%; DA 59%), while 15% grossed less than $100,000 (HIS 21%; DA 6%). A total of 18% of businesses reported gross revenues between $501,000 and $1 million (HIS 14%; DA 24%), while 14% of the offices had revenues exceeding $1 million (HIS 16%; DA 10%).
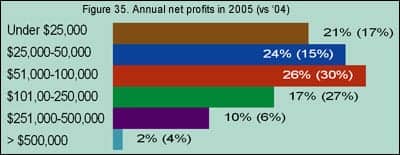
When comparing gross revenues in 2005 with those of 2004 (Figure 34), 67% of all survey respondents reported gross revenue gains averaging 14%, while 10% of all respondents reported gross revenues losses by an average of -14%. About one-fifth (23%) said that their revenues had stayed the same. The differences between HIS-owned offices and DA-owned offices was minimal.
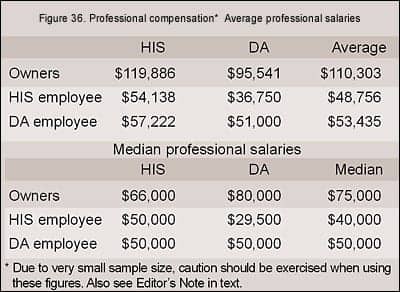
Annual net profits. The reported net profits of businesses in this year’s survey suggests that things got tighter for dispensing businesses (Figure 35), as there were more practices (45% in 2005 vs 34% in 2004) that reported net profits of less than $50,000. When viewing the individual survey responses, it appears that smaller offices/practices had greater difficulty in posting the same gains as they had in the previous year, and smaller HIS-owned