Research | April 2014 Hearing Review
By Karl E. Strom
Prices of hearing instruments are either flat or declining, binaural fittings have continued to increase in popularity, and low-cost hearing aid options are starting to make their way into the armamentarium of devices that dispensing professionals offer, according to a new survey conducted by The Hearing Review during the concluding months of 2013.
Overall, a picture emerges of an industry that is witnessing some major changes in response to new technology being offered by hearing aid manufacturers, the Internet and Big Box retailers, pricing pressure exerted from forces both within and outside the traditional hearing industry, and the demands of the aging Baby Boomer generation.
Survey Methods & Demographics
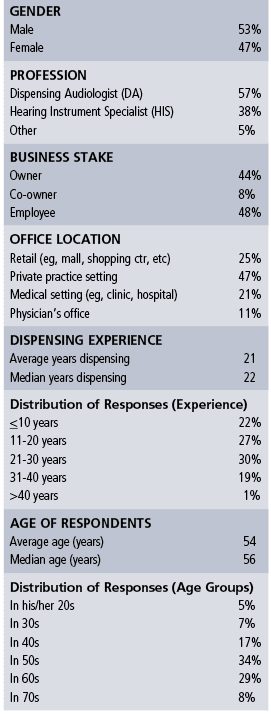
Table 1. Demographics of respondents in this survey.
Survey participants. In November and again in December 2013, The Hearing Review emailed a survey via SurveyMonkey using The Hearing Review subscription database. A total of 179 US hearing care professionals responded to the survey hailing from 42 states (7 responses came from Canada and other countries and are not counted in this total).Although CareCredit was a sponsor of the survey, the individual survey responses were kept confidential with The Hearing Review’s editor and publisher, and these responses are not available to anyone outside our company (including CareCredit).

Figure 1. Age of dispensing professionals reported in 3 different Hearing Review dispenser surveys taken roughly 10 years apart (1994, 2003, 2013). It should be noted that the present survey had a smaller percentage of practice owners (ie, and more employees) than the previous surveys.
The demographics of survey respondents are shown in Table 1. Respondents were fairly evenly split between male (53%) and female (47%), and just over half (52%) reported they were either an owner or co-owner of a dispensing business/practice, while 48% identified themselves as an employee. This departs from previous HR surveys in which owners and co-owners were often much higher.
Among survey respondents, the average age was 54 years old (median 55.5 years). More than one-third (37%) of the dispensers were over 60 years old, and 18% were 65 years or older—what most consider retirement age. In contrast, only 12% were younger than age 40.
The aging of private practice owners and the dearth of younger dispenser/entrepreneurs entering the field has been a hot topic in recent years, and results from this survey suggest good reason for it. Figure 1 compares survey respondent ages from two other Hearing Review surveys taken roughly 10 years apart.1-2 Over the 20-year period, there is a clear trend away from practice owners in their 40s, with the majority (63%) today being in their 50s and 60s, compared to 53% and 36% for 2003 and 1994. The trend is most obvious when looking at the percentage of respondents in their 40s in Figure 1: a continual decrease from 32% in 1994 to 17% in 2013.
An excellent article (“The Coming Crisis in Audiology”)3 by Barry Freeman, PhD, addresses this topic and warns that, in coming years, greater numbers of audiologists will be retiring from the field than entering it—while the senior population and the need for audiological services increase. That article also notes that an American Academy of Audiology (AAA) survey of all its members (ie, not focused on private practice owners) found that 38% were over age 50, and only about 25% of all audiologists are practice owners.
Half (50%) of the present survey’s participants have over 20 years of experience dispensing hearing aids (average 20.9 years; median 22 years). This is slightly more than the ASHA 2012 Audiology Survey,4 which reported a median of 17 years’ experience for audiologists (again, in a wide range of audiology positions, not just dispensing). This same survey reported that 84% of audiologist respondents were female.
In the present survey, about three-fifths (57%) of respondents identified themselves as dispensing audiologists, and about the same percentage said they had attained either a doctoral (37%) or masters (23%) degree. Two-fifths (38%) identified themselves as hearing instrument specialists, and 5% were primarily audioprosthologists or some form of traditional hearing aid dispenser/specialist. About half (20% of all respondents) of these professionals held college degrees, ranging from BA/BS to PhD.

Figure 2. Nearly two-thirds of respondents (62%) were either completely independent or affiliated with an independent network, co-op, or buying group, while another 16% were affiliated with but not owned by either a manufacturer or corporate chain. Only 12% were owned by a Big Box retailer, corporate chain, or hearing aid manufacturer, while 10% of respondents were not-for-profit businesses (*not included in the results of this report).
Practice affiliations and settings. If you were to ask most industry experts, they would probably comment that this year’s survey is weighted disproportionately to independent dispensing professionals (who, not coincidentally, are probably the most avid readers of The Hearing Review). Figure 2 shows that more than 3 in 5 respondents had either no affiliation with any group (42%) or belonged to an independent network, co-op, or buying group (20%). About 1 in 5 were affiliated with but not owned by either a hearing aid manufacturer (9%) or a corporate chain (7%), while smaller percentages said their office was owned by either a Big Box retailer (6%) or a corporate chain (4%). Only 2% reported ownership from a hearing aid manufacturer or one of their networks. Another 10% reported being a nonprofit (eg, university clinics, VA) and these were not included in the results.
Nearly half (47%) of the respondents in the survey worked at or owned a business that was in a private-practice setting; one-quarter (25%) were located in a retail setting (eg, mall, shopping center, etc); 21% described their workplace as a medical setting (eg, hospital or clinic), and 11% worked in a physician’s office.
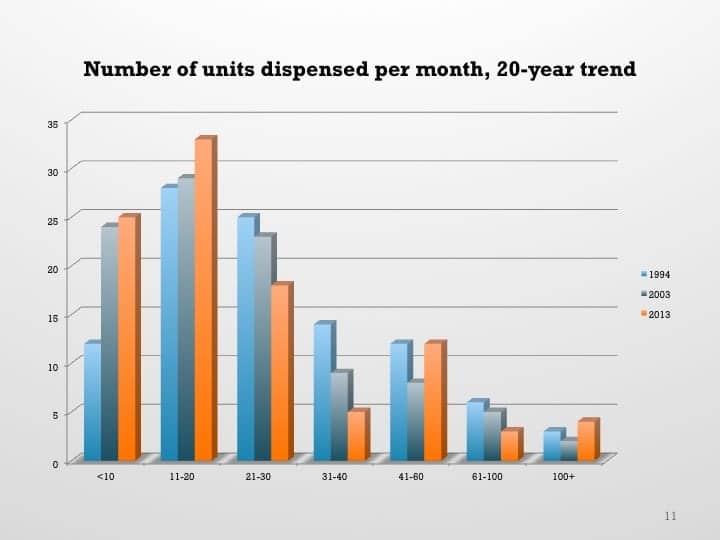
Figure 3. Average hearing aids dispensed per month in three different HR dispenser surveys taken roughly 10 years apart (1994, 2003, and 2013). In general, larger percentages of dispensing practices are dispensing fewer hearing aids today than they were 10 and 20 years ago.
Some caveats about this survey. A few caveats and acknowledgements are in order. First, it should be noted that this is the first Hearing Review dispenser survey administered by email (via SurveyMonkey). Past HR surveys were conducted using only the US mail, with the mailings directed to owners and weighted according to Hearing Industries Assn (HIA) state net unit sales statistics for the private-sector market.
Second, as with previous HR surveys, this year’s survey had several very large dispensing outlets—including 6 that reportedly dispensed more than 100 hearing aids per month, with 4 of these reporting very large unit volumes (per month). Due to this, these largest of firms have been left out when computing averages for some factors (eg, units dispensed, revenues, etc). In these cases, the medians are used as more reliable measures.
Finally, as noted previously, the survey is probably disproportionately weighted to independent practice owners as a result of HR’s readership and circulation/email list. Smriga5 estimated in 2011 that manufacturer-branded and corporate-owned practices accounted for 32% and 8% of all dispensing offices, respectively, while affiliated providers made up another 37%. Although the editor has some disagreements with the criteria used to categorize practices in that study (ie, the degree of “independence” for practices in various networks), this would leave only 23% of practices having no corporate affiliation, as compared to the 62% in this survey.
Units Dispensed, Revenues, Profits
Units dispensed. The median reported average number of net hearing aids dispensed per month in 2013 was 20 units, according to survey respondents. The average for all offices (including the very large ones) was 38 units.
However, when one looks only at those practices dispensing fewer than 100 hearing aid per month (ie, excluding the 6 largest dispensing offices in the survey), the average was 23 units, and the median was 20. This represents about a 4% to 10% sales increase over 2012 when dispensers reported an average of 22 units and a median of 18 units per month. HIA statistics indicated that private-sector net unit sales increased by 4.2% in 2013.6
Going back 20 years and comparing 2013 figures to those of 1994 and 2003 HR survey statistics,1,2 there are fewer hearing care offices today dispensing more than 20 hearing aids than in the past (Figure 3). In particular, when looking at the 21-30 and 31-40 unit per month categories, the numbers of practices dispensing these higher volume levels have decreased from 25% to 18% and 14% to 5%, respectively, over 20 years. Concomitantly, the percentages of practices dispensing between 1-10 and 11-20 units per month increased from 12% to 25% and 28% to 33%, respectively, over the same 20-year period.
Another thing that comes out of a comparison of this HR survey is, in general, larger practices appear to be growing at faster rates than smaller ones. Indeed, this is hardly the first dispenser survey that HR has published in the last year that suggests this trend.7,8

Figure 4a. Reported gross revenue in 2012, as reported by survey respondents.
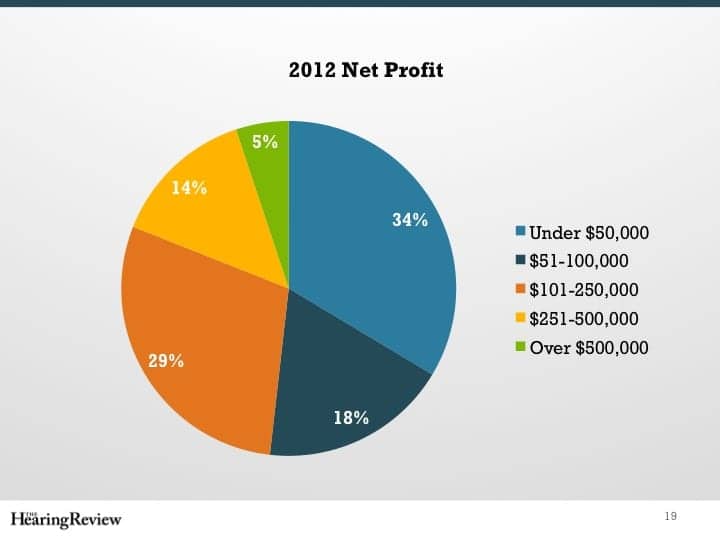
Figures 4b. Reported net profit in 2012, as reported by survey respondents.
Net revenues and profit. Gross revenues in this survey were pretty evenly split (Figure 4a). Roughly speaking, if one compares the two pie charts in Figures 4a-b, it would appear plausible that the one-third (33%) of practices with revenues of less than $250,000 are probably the same one-third (34%) reporting net profits of less than $50,000. Likewise, the one-fifth (20%) of practices with revenues between $250,000 and $500,000 account for about the same percentage (18%) making $51,000-$100,000 in net profits, while the 30% with revenues between $501,000 and $1 million are the same practices (29%) with net profits between $101,000 and $250,000. Finally, the 17% of practices with gross revenues of over $1 million may account for the 19% of practices reporting net profits of more than $250,000. Thus, net profit margin appears to range from about 20%-33%, with larger businesses enjoying superior profits.
Hearing Aid Technology Levels and Pricing
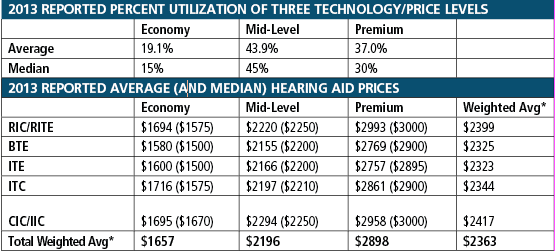
Table 2. Top: Reported average and median percent utilization of economy, mid-level, and premium hearing aid lines. Bottom: Average (median in parentheses) prices of the five major styles of hearing aids in each of the three pricing categories. *Weighted average prices are based on the percentage utilization of technology/price levels paired with 2013 HIA data6 for hearing aid styles in the commercial/private-sector market.
Specifying hearing aid technology/pricing levels. One of the key focuses of this survey was hearing aid pricing. Table 2 shows the results from survey respondents about their specification of economy, mid-level, and premium technology product lines (top of Table 2). Survey respondents reported that, on average, 37% of the hearing aids they dispensed came from premium product lines, 44% came from mid-level lines, and 19% came from economy-level hearing aid lines.
This represents a much higher-than-expected percentage for the premium technology instruments—at the expense of percentages for the mid-level and economy instruments. For example, in the 2006 dispenser survey,10 the percentages were 30%, 46%, and 24% for premium, mid, and economy level aids, respectively. And, even then, the editor thought the premium level was a higher-than-expected value—even when considering the fact that HR survey respondents are predominantly independent private-practice dispensers.
A separate informal “straw-poll” in February by the editor of about a half-dozen hearing aid manufacturer executives on the same question brought a wide range of responses. In general, they felt the smallest percentage use was in the premium lines (eg, ranging from 20% to 30%), and they gave widely varying but generally higher responses for the mid and economy lines (30%-60%). For the industry as a whole, they indicated that more sales are migrating down—and not up—the value chain. Several noted that the total market (eg, Big Box, VA, etc) is becoming increasingly differentiated from private practice dispensing, which may partially explain the figures. Additionally, some dispensing offices have evolved a “boutique” approach to personalized service and dispensing. Last year also saw more high-end product introductions than in the years following the Great Recession of 2008. Finally, several suggested that a three-tiered good-better-best system for pricing/technology may no longer accurately describe today’s market; the true industry pricing structure may be considerably more complex with 4, 6, or more technology/price points—and these change rapidly, as the industry is becoming more sophisticated and product life cycles are being reduced to less than 9 months for some categories.
Hearing aid prices. The bottom portion of Table 2 shows average and median prices in each of the three technology/price segments for receiver-in-the-canal/ear (RIC/RITE), behind-the-ear (BTE), in-the-ear (ITE), in-the-canal (ITC), and completely-in-the-canal or invisible-in-the-canal (IIC) hearing aids. It can be seen that RIC/RITEs, which according to HIA make up 54% of the private-sector hearing aid market, are the most expensive with an average price range of $1,694 to $2,993. Traditional BTEs, which make up 21% of the market, tend to be the least expensive, ranging in average price from $1,580 to $2,769. Full and half-shell ITEs (11% of market) range in average price from $1,600 to $2,757; ITCs (7% of market) from $1,716 to $2,861; and CIC/IICs (7% of market) have prices very similar to RIC/RITEs, ranging from $1,695 to $2,958.
Also included in Table 2 are the weighted average prices, which are based on the averages of the three price levels shown at the top of the table and, in the case of the total weighted averages (bottom line), the 2013 HIA statistics6 for private-sector unit volume (ie, non-VA dispensed hearing aids).
The total average weighted price for all styles of hearing aids at all technology levels was $2,363—the highest yet for any Hearing Review survey. It represents a $169 (7.7%) increase compared with 2 years ago in 2011.11 (Editor’s note: As previously mentioned, this price would be considerably lower if the percentage of premium products dispensed, as reported by dispensers in this survey, was lower and more in line with the aforementioned estimates by manufacturing executives.) The average weighted price for economy hearing aids was $1,657; mid-level aids, $2,196; and premium aids, $2,898. Thus, there is a price difference of $1,241 between the highest and lowest technology levels, with the difference between the economy and mid-level lines being $539, and the difference between the mid-level and premium lines being $702.
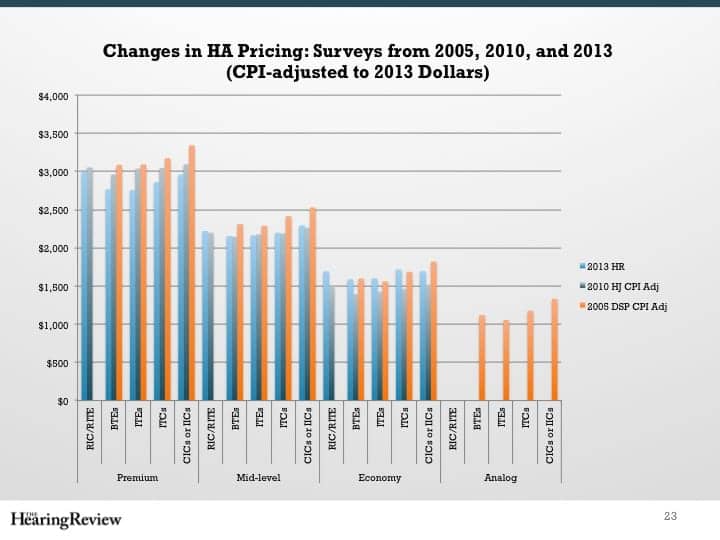
Figure 5. Pricing for the five major styles of hearing aids segmented into good-better-best (economy-mid-premium) technology levels, with the present survey compared to the same categories in 2010 and 2005 surveys (CPI-adjusted to 2013 dollars).10,11
Figure 5 reflects this hearing aid technology and style pricing, and compares the prices with the same CPI-adjusted (2013) data from dispenser surveys taken in 201011 and 2005.10 When comparing 2013 to 2010 CPI-adjusted figures, premium technology hearing aids have decreased in price by 2% to 9%, mid-level technology prices have remained essentially the same, and economy level prices have actually increased by 12% to 17%.
However, comparing 2013 to those of 2005 (CPI-adjusted) some 8 years ago suggests that prices have decreased almost across the board. The average weighted price of premium technology hearing aids decreased by 10% to 12% (decrease of $312-$384), and by 6% to 10% (decrease of $122-$235) for the mid-level aids. The prices of the economy aids were essentially the same in 2013 and 2005, except for CIC/IICs (a 8% decrease or $125).
So, what does all this mean? It’s interesting to note that, in the 2008 MarkeTrak VIII survey,9 when ignoring VA, free, and discounted hearing aids, the median out-of-pocket cost was $2,000—or $2,164 in CPI-adjusted 2013 dollars (Sergei Kochkin, personal correspondence, March 2014). This data from a 6-year-old consumer survey is very close to the mid-level weighted average price ($2,196) in this survey—what some might view as roughly the midpoint for the commercial market.
For several years, industry analysts and hearing aid manufacturers have been reporting flat to declining hearing aid prices on a worldwide basis. Much of this can be attributed to global changes in state reimbursement programs (eg, VA and the UK’s NHS), Big Box retailers, and increased competition from both within and outside the traditional hearing aid market. However, the HR dispenser surveys of the early 2000s also pointed to a flattening (eg, 1% increases) of average prices.10
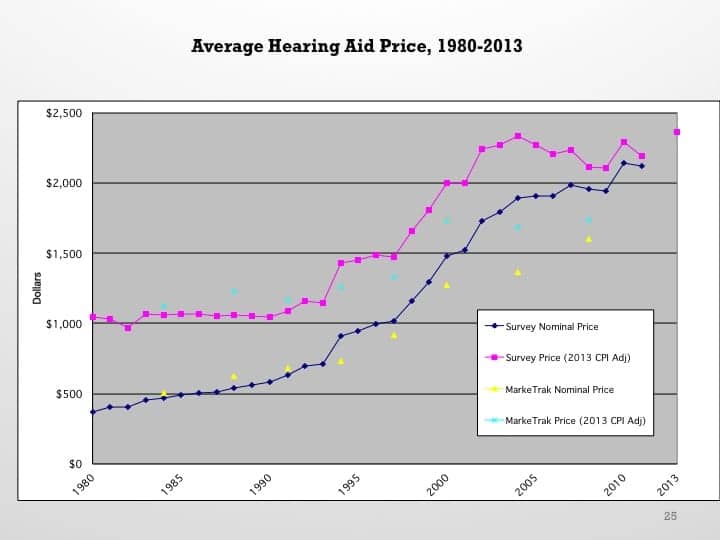
Figure 6. Historical average hearing instrument prices taken from Hearing Instruments, Hearing Journal, and Hearing Review surveys from 1980 to 2013, as well as MarkeTrak (shown in both nominal prices and 2013 CPI-adjusted prices).
Figure 6 summarizes previously published survey data from Hearing Instruments, Hearing Review, Hearing Journal, and the Phonak Practice Management surveys since 1980. What it suggests is that this survey’s results—particularly if you consider it is probably skewed by a higher usage for premium product lines—confirms flattening to declining hearing aid prices during the past decade not just as an aggregate result of rapid volume growth in the VA, mass retailers like Costco,12 and discounting by chains and networks, but also as actual lower prices in independent, private-practice dispensing businesses in response to a more competitive, price-focused market.
“Lowest-priced” aids and PSAPs. Figure 5 also reminds us that, in 2005, there was a fourth (albeit quickly waning) class of hearing aids below the economy DSP technology level: analog devices. These analog hearing aids had a price range from $1,055 to $1,331 in 2013 dollars—about $400-$500 less expensive than the digital aids of their day and significantly below today’s average economy-level price of $1,657.
In this year’s survey, we also asked what was the very lowest priced hearing aid the practice offered (eg, the final hearing aid that might come out of a dispenser’s drawer when it’s apparent that price alone is the only factor stopping the patient from adopting amplification). The average price of this hearing aid was $1,025, with a median of $995. About 2 in 5 practices (44%) offered a “lowest priced” option for under $800, but only 6% offered one for less than $500.
A total of 16% indicated that they did not offer the full complement of audiological services with this lowest-priced aid, and 8% said they actually marketed this device as a personal sound amplification product (PSAP). This brings up several interesting questions that cannot be explored here due to space issues. However, as defined by FDA regulations, PSAPs are not designed to address hearing impairment.
And speaking of PSAPs… We also asked what percentage of new clients are believed to have tried a PSAP prior to purchasing a hearing aid. The average was 10% (median: 5%).
Binaural Fittings
Binaural saturation? It’s well accepted that bilateral amplification (fitting two ears with hearing aids) offers large and meaningful benefits, especially in understanding speech in competing noise (eg, cocktail party effect). Binaurality also helps to localize sound sources and makes listening less tiring when trying to follow conversations. On the other hand, binaural aids are not always the best choice for certain patients since they essentially double the cost of the “hearing aid fitting” and can adversely influence stigma, hearing aid management/complexity (particularly for older users), and possible central factors.14
In this survey, an average of 84% of fittings were reported to be binaural, with a median of 90%. This may be a point that approaches the theoretical maximum (possibly 85%-90%, although I could find no data concerning unilateral hearing loss for adults or speculation on a theoretical maximum for binaural fittings).
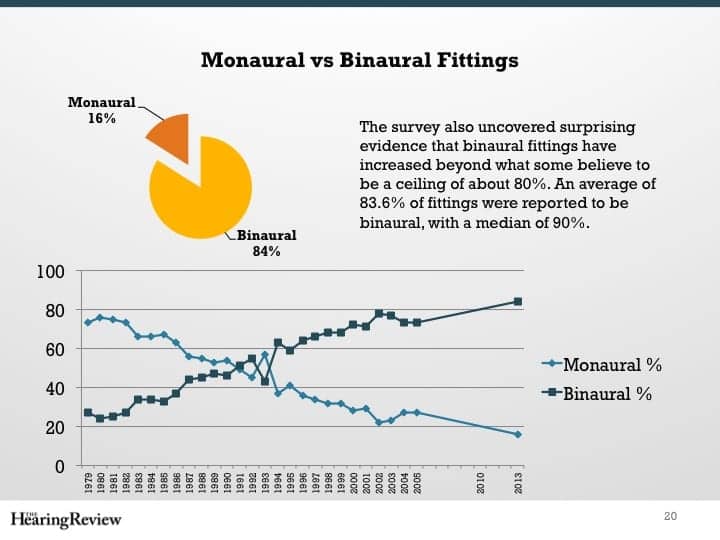
Figure 7. Historical percentage of binaural vs monaural fittings since 1979, as reported by Hearing Instruments and Hearing Review magazine dispenser surveys. In 2013, 84% of patients were fit with binaural hearing aids (median of 90%), according to this survey.
Figure 7 shows historical data published in Hearing Instruments and Hearing Review surveys going back to 1979. In most years during the past 3 decades, binaural hearing aid fittings have increased by 1 to 4 percentage points. Monaural/binaural fittings reached parity in 1991; the percentages of monaural versus binaural in 1979 (73% vs 27%) were flip-flopped in favor of binaural by 2005 (27% vs 73%).
The United States’ 84% binaural fitting rate is substantially higher than any other developed country. According to EuroTrak,15 the percentage of binaural fittings in 2012/2011 ranged from 39% in Japan to 76% in Norway and Germany.
Price Bundling, Managed Care Contracts, and Payment Methods
Price bundling. For better or worse, the bundling of products and services into a dispensing office’s prices continues to be common practice. A total of 83% of respondents said they used a bundled pricing system in the sale of hearing aids, while 17% itemized their product and service billings.
MCO contracts. Just over one-third (34%) of practices maintain contracts for service with managed care organizations (MCOs) and/or health maintenance organizations (HMOs). Those dispensing offices that do maintain contracts average just over one-quarter (27%, median 20%) of their clients covered by the insurance, and those clients account for about one-fifth (22%, median 15%) of their gross revenues.
Methods of payments. Survey respondents indicated that half (50%, median 50%) of their patients pay for their hearing aids using a credit card, and another 37% (median 30%) pay with cash or check (Figure 8). Only one-quarter of patients pay for their hearing aids using a third-party financing company (eg, CareCredit, Wells Fargo, etc, 17%, median 10%) or via in-house payment options (8%, median 5%) that the dispensing office establishes.
Cost has always been a major deterrent fin the purchase of hearing aids. However, Figure 6 shows that hearing aid prices have more than doubled in the 20+ years since 1993 (an increase of 106%, or $1,218 in 2013 dollars). The increasing frequency of binaural fittings has also greatly added to the cost of hearing aids (it should be noted, however, that some dispensers offer discounts for binaural sales). Kochkin13 showed that cost considerations—specifically full or $1,000 of insurance coverage, a price of $500 or less, and costs of repair—figured into 4 of the top-10 factors that would persuade a reluctant potential user to purchase a hearing aid.
Likewise, in this survey, cost was cited by 45% of respondents as the #1 reason for lack of purchase by first-time buyers, out-polling the #2 reason of “Not yet ready” (14%) by a 3 to 1 margin. Similarly, “Price/Cost” was cited as the #2 reason (58%) as the top reason for returns for credit, after “Device did not provide enough benefit/value” (68%).
The base price of a set of binaural hearing aids (an average of $3,300-$6,000 as shown in Table 2) can be a shock to first-time users and a financial burden, especially those on a fixed income. For many, it’s not economically feasible in a single payment. Hearing Review has published several articles by CareCredit and other industry experts about why providing financing options to patients can increase the number of first-time users, reduce returns, improve customer satisfaction and value, and decrease the business risks associated with having a high amount in accounts receivable.Additionally, an argument can be made that providing financing options represents another weapon in the battle against many of the price-centric delivery channels challenging the hearing industry. Likewise, providing warranties and insurance coverage for hearing aids can make sense—and head off trouble—if there is a need for costly device replacement or repair.
Brand Utilization
Number of brands. Just over 1 in 5 dispensing practices (21%) in the survey reported offering only one product line, while more than 3 in 5 dispensing practices (61%) offered 2 to 4 brands of hearing aids. A total of 13% of respondents said their practice(s) offered 5 to 6 brands, and only 5% offered 7 or more brands. None offered more than 10. The Hearing Review survey2 was one of the first to point out that, in the early 2000s, brand utilization resembled a “back to the future” scenario: a trend back to single-line dispensing offices, with far fewer offices offering 5 or more brands—due to networks and buying groups, an increase in manufacturer-owned offices, and now the rise of Big Box retail.
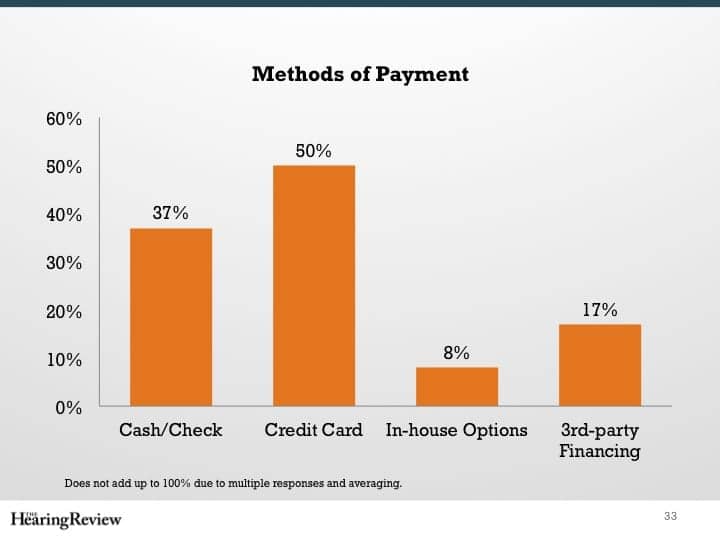
Figure 8. Patient payment methods (does not add up to 100% due to multiple responses).
This trend has continued. Figure 9 compares the number of brands carried by dispensing offices in 2013 to the number of brands carried in 2005 and 2003, according to HR dispenser surveys.2,10 Ten years ago, only 6% of practices reported carrying only one brand of hearing aids compared to 21% today. Perhaps more telling, nearly half (48%) of the offices in 2003 carried 5 or more brands compared to just 18% today.
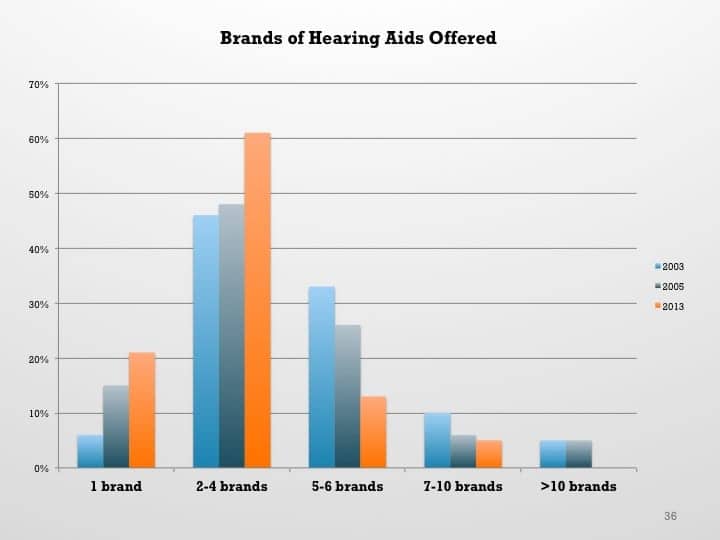
Figure 9. Number of hearing aid brands carried by a dispensing office. Although the most common number of brands to carry has always been between 2 and 4, the number of single-line dispensing offices has increased while it is increasingly uncommon to carry 5 or more brands.
Use of #1 brand. Regardless of the number of brands offered in a typical dispensing office, the average percentage of hearing aids in that office coming from the #1 brand has remained essentially the same: 77% (median 80%) of all hearing aids in 2013 compared to 72% in 2003. In other words, dispensing professionals recommend one brand for about 3 in 4 patients.
“Big-6” dominate hearing aid selection. The survey also asked respondents an open-ended question, inviting them to list their three most-used brands. We then weighted the responses, arbitrarily assuming a 80:15:5 ratio for the #1, #2, and #3 brands, respectively. The result was that the Big-6 hearing aid manufacturers—Sonova, Starkey, William Demant Holding (WDH), Great Nordic (GN), Siemens, and Widex (in that order)—accounted for an estimated 93% of the hearing aid unit volume dispensed in the survey. This compares to 74% of Big-6 hearing aids dispensed in the 2005, using a slightly different methodology.10 The rank order of the corporate groups in that older survey was Siemens, Starkey, GN, Sonova, WDH, and Widex. So, although the Big-6 groups have increased their dominance, there are continual changes in their market positions relative to each other.
Summary
This year’s dispenser survey found a number of interesting new and continued trends in the hearing aid dispensing market, including:
- The working population of professional dispensers/entrepreneurs is aging. Nearly three-quarters of practice owners and employees (71%) in this survey were age 50+. Nearly one-fifth (18%) were of retirement age (>65). Twenty years ago (1994), only 41% were age 50+.
- Average and median hearing aid unit volumes increased in 2013 over 2012 for dispensing practices in this survey—especially the larger ones. The median number of units per month dispensed in 2013 increased to 22 units from 20 units in 2012.
- Although the 2013 survey reports a fairly substantial increase in the average weighted hearing aid price ($2,363), this was primarily due to the very large number of premium technology hearing aid sales reported by survey participants.
- Average sales prices for hearing aids have been flat or decreasing for the last 8 years. When comparing 2013 to 2010 CPI-adjusted figures, premium technology hearing aids have decreased in price, mid-level technology prices have remained essentially unchanged, and economy level aids have increased in price by 12% to 17%. However, comparing 2013 to CPI-adjusted prices of 2005 shows that prices have decreased (in 2013 dollars) almost across the board. The average weighted price of premium technology hearing aids has decreased by $312-$384 (in 2013 dollars), and by $122-$235 for mid-level aids, depending on the style of hearing aid. Prices for economy aids are essentially the same, except for CIC/IICs, which have decreased by $125.
- In 2013, the average price of an economy level hearing aid (weighted by HIA statistics relative to hearing aid styles) was $1,657, while mid- and premium-level technology aids averaged $2,196 and $2,898, respectively. The average price of the very lowest priced hearing aid in a practice was $1,025 (median $995). Only 6% of practices in this survey offered a hearing aid for less than $500.
- Dispensers in this survey believe that 10% of their new patients tried a PSAP prior to their first visit (median 5%).
- An average of 84% of patients were fitted with binaural hearing aids by survey respondents (median 90%), up from 80% in 2005.
- Although cost remains a major deterrent in buying hearing aids, only 17% (median 10%) of patients pay using a third-party financing company or via in-house payment options that the dispensing office establishes (8%, median 5%).
- Most dispensing practices offer fewer brands of hearing aids than they did 10 years ago. As a group, the Big-6 hearing aid companies have increased their market dominance during the last decade, although their relative positions in the market remain fairly dynamic.
- The average dispensing office uses its #1 brand of hearing aid for over three-quarters (77%) of its fittings.
Acknowledgements
The editor thanks CareCredit for providing funding for this survey. Although CareCredit was involved in sponsoring the survey, at no time did the company see individual survey responses, and it did not participate in the analysis of the data (ie, the views presented here are solely those of the editor). Thanks also to Holly Hosford-Dunn, PhD, who helped provide some of the historical pricing data (2006-2011) in Figure 6. Dr Dunn has written extensively about pricing in her blog, which is often featured on HR’s Blog Page, at www.hearinghealthmatters.org.
References
1. Skafte MD. A review of the 1994 hearing instrument market. Hearing Review. 1995;2(3):16-27,53,60,61.
2. Strom KE. The 2004 dispenser survey. Hearing Review. 2004;11(6):14-32,58,59. Available at: https://hearingreview.com/2004/06/the-hr-2004-dispenser-survey
3. Freeman B. The coming crisis in audiology. Audiology Today. Nov/Dec 2009:46-53.
4. American Speech Language Hearing Assn (ASHA). ASHA 2012 Audiology Survey. Available at: http://www.asha.org/research/memberdata/audiologysurvey
5. Smriga D. Are we (still) asleep at the wheel? An update from 7 years ago. September 12, 2011. Available at: http://www.audiologyonline.com/articles/we-still-asleep-at-wheel-809
6. Hearing Industries Assn (HIA). HIA statistical reporting program: Fourth quarter 2013. Washington, DC: HIA; 2014.
7. Phonak Practice Management. 2013 survey of US dispensing practice metrics. Hearing Review. 2014: 21(1):32-41. Available at: https://hearingreview.com/2014/01/2013-survey-of-us-dispensing-practice-metrics-part-2
8. Gleitman R. Examination of the AOR benchmark practice management study. Hearing Review. 2014;20(8):26-31. Available at: https://hearingreview.com/2013/07/examination-of-the-aor-benchmark-practice-management-study-2
9. Kochkin S. MarkeTrak VIII: 25-year trends in the hearing health market. Hearing Review. 2009;16(11):12-31. Available at: https://hearingreview.com/2009/10/marketrak-viii-25-year-trends-in-the-hearing-health-market
10. Strom KE. The HR 2006 dispenser survey. Hearing Review. 2006;13(6)16-39. Available at: https://hearingreview.com/2006/06/the-hr-2006-dispenser-survey
11. Victorian B. Survey says: Hearing healthcare professionals are satisified in their careers. Hear Jour. 2011;64(5):29-34.
12. Strom KE. Has Costco become king of US hearing aid retailing? Hearing Review. 2013;20(10):6. Available at: https://hearingreview.com/2013/07/hr-blog-has-costco-become-king-of-us-hearing-aid-retailing-2
13. Kochkin S. MarkeTrak VIII: The key influencing factors in hearing aid purchase intent. Hearing Review. 2012;19(3):12-25.
14. Dillon H. Hearing Aids. New York: Thieme; 2001.
15. Hougaard S, Ruf S, Egger C. EuroTrak + JapanTrak 2012: Societal and personal benefits of hearing rehabilitation with hearing aids. Hearing Review. 2013;20(3):16-35. Available at: https://hearingreview.com/2013/03/eurotrak-japantrak-2012-societal-and-personal-benefits-of-hearing-rehabilitation-with-hearing-aids
Correspondence can be addressed to Karl Strom at [email protected].
About the author: Karl Strom is editor-in-chief and a founding editor of The Hearing Review. He has reported on the hearing healthcare field for more than 20 years.
Original citation for this article: Strom KE. HR 2013 dispenser survey: Dispensing in the age of internet and big box retailers. Hearing Review. 2014;21(4):22-28.