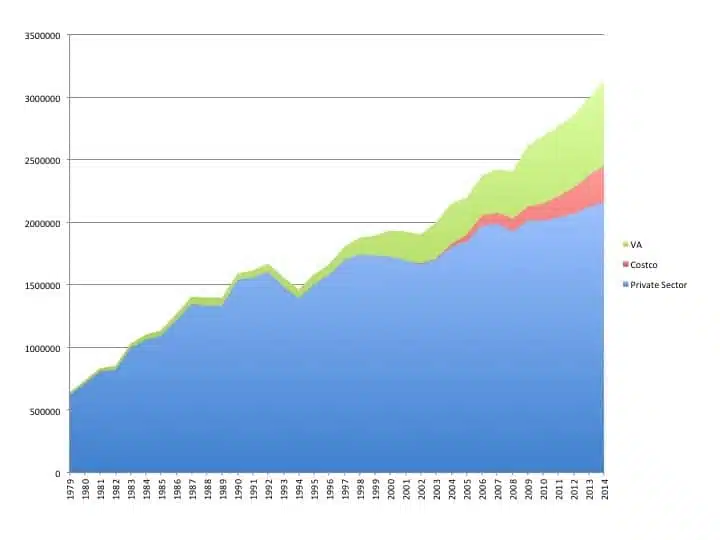
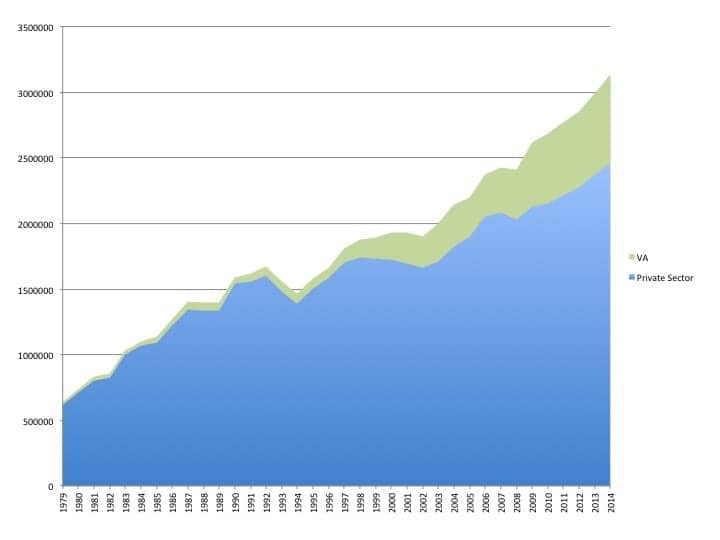
[Click on image to enlarge.] Figure 1. US net hearing aid sales totaled 3,132,355 in 2014—topping the 3-million unit mark for the first time in industry history.

Figure 2. Same HIA net unit hearing aid statistics with an estimate of Costco unit volume and resulting sales for US private sector.
However, these stronger sales come with some caveats for private practice dispensing professionals for three major reasons. First, the 2014 sales increase of 3.4% in the private sector is slightly lower than the 4.2% increase in 2013. Second, Costco’s hearing aid sales have grown by approximately 20% per year for the past 5 years, and are included in HIA’s private sector unit sales. When taking Costco’s sales out of the equation (Figures 2 and 3), HR estimates that private practice sales probably increased by around 1.5% in 2014, 2.7% in 2013, and 1.5% again in both 2011 and 2012. Third, as noted in The Hearing Review’s recent dispenser survey (April 2014), average sales prices (ASP) have been flat or slightly declining for the past several years, meaning that gross revenue increases for many private practices have been relatively difficult to come by.
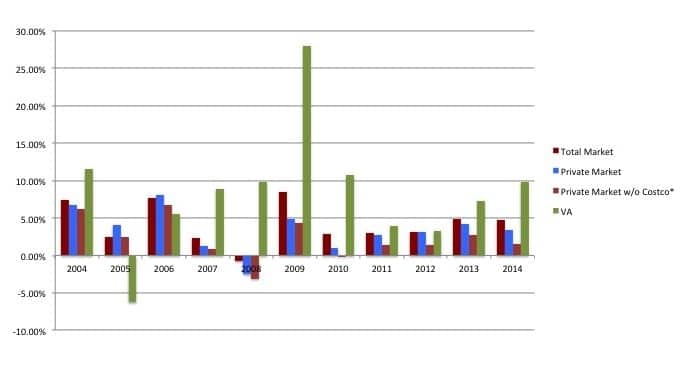
Figure 3. Year-to-year hearing aid unit percentage sales increases for the total hearing aid market (dark red), private market (blue), private market without Costco sales (light red), and VA (green) during the past decade. *HR estimate.
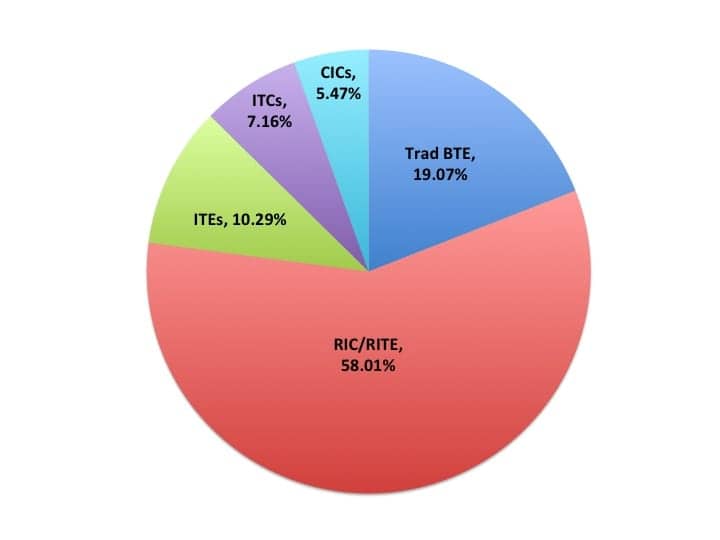
Figure 4. Styles of hearing aids dispensed in 2014. BTE-style hearing aids now account for more than 3 out of every 4 hearing aids sold in the United States.
Hearing Aid Styles. Behind-the-ear (BTE) style hearing aids dominated 2014 sales, accounting for more than three-quarters (77.1%) of all units dispensed (Figure 4). Receiver in-the-canal and receiver-in-the-ear (RIC/RITE) hearing aids made up 58.0% of all hearing aid sales—an increase of 6 percentage points from sales in 2013 (52%)—while traditional BTEs made up 19.07% of the units sold, a decrease of 3 percentage points from 2013 (22%).
When looking at the in-the-ear (ITE) style aids, full-shell and half-shell ITEs constituted 10.3% of the total market, while in-the-canal (ITC, 7.2%) and completely-in-the-canal (CIC, 5.5%) made up roughly similar shares.
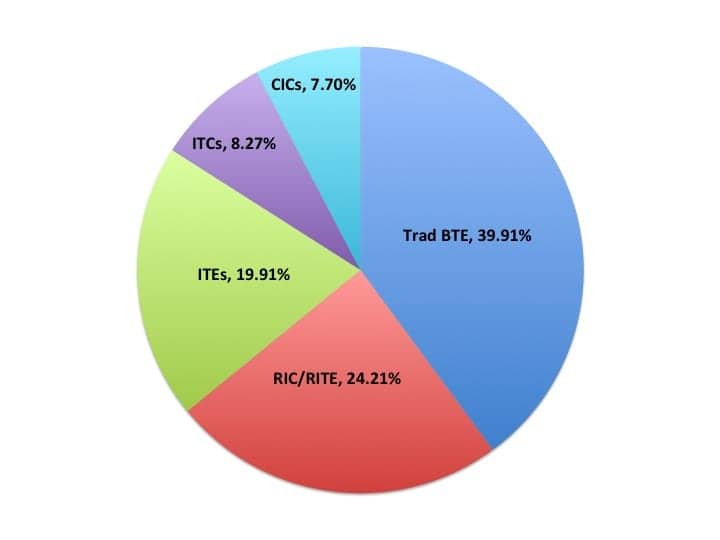
Figure 5. For comparison of how the market is changing, hearing aid unit sales just 5 years ago (YE2009) were predominantly of the traditional BTE style (40%), with about one-quarter (24%) being RIC/RITEs.
For comparison, Figure 5 shows the distribution of hearing aid styles dispensed in 2009—and the dramatic change in favor of RIC/RITE style aids. Only 5 years ago, traditional BTEs were the most-popular hearing aid style (39.9% of the market), while RIC/RITE and ITE units were fairly close in terms of unit volume (24.2% vs 19.9%).
About 4 in 5 (82.0%) hearing aids dispensed during 2014 featured wireless technology, compared to three-quarters (74.6%) of all aids dispensed in 2013.
For more about the recent changes in hearing aid selection and styles, see The RIC as a Disruptive Technology (June 2014 Hearing Review, p 6). Similarly, an analysis of HIA 2013 statistics is offered in the February 2014 Staff Standpoint.
Returns. According to the HIA statistics, the return for credit (RFC) rate for all hearing aid styles in 2014 was 19.4%, which is in line with historical industry data. The RFC rate was 18.5% for RIC/RITEs, 18.9% for traditional BTEs, 17.9% for ITEs, 21.8% for ITCs, and 28.3% for CICs. ITE wireless devices were returned significantly more often than ITE non-wireless devices (23.6% vs 17.5%); BTE wireless and non-wireless device return rates were the same (18.6%). It should be noted that manufacturers have significantly different methods for counting RFCs than dispensing professionals, with the inclusion of any units that are replaced, remade, or exchanged; in contrast, most dispensing professionals usually do not count into their RFC rates exchanges/remakes, as well as instances where a patient may have tried more than one set of aids (a frowned-upon practice since it dramatically increases the overall cost of hearing aid production).