Research: MarkeTrak IX | June 2015 Hearing Review
MT9 reveals renewed encouragement as well as obstacles for consumers with hearing loss
MarkeTrak IX (MT9), which is the first MarkeTrak online-only survey, shows that the majority (81%) of hearing aid users are satisfied with their devices and confirms that hearing aids are positively impacting their relationships, work performance, general ability to communicate, overall quality of life, and ability to participate in group activities.
For over 25 years, the hearing aid manufacturing sector has conducted MarkeTrak surveys to measure the pulse of the hearing industry from the consumer’s perspective.1 Originally conceived and designed by Knowles Electronics Inc and transferred to the Hearing Industries Association (HIA) for publication through its Better Hearing Institute (BHI), MarkeTrak has been our field’s window into the consumers’ behaviors and perceptions. Among many insights, it has led to a better understanding of hearing aid use by consumers, and their satisfaction with technology and providers, perception of benefit and improved quality of life, and the barriers and facilitators associated with hearing aid adoption. The data has not only provided valuable information as to where we are as an industry, but has also helped to identify trends and opportunities for improving the industry’s responses to consumer needs.
The hearing aid industry has seen dramatic advances in technology, as well as advances in the techniques associated with soliciting and collecting information through consumer surveys. HIA’s latest MarkeTrak survey completed at the end of 2014, MT9, is a significant departure from the eight preceding surveys in terms of the strategies and techniques used to collect consumer information. This article describes the MT9 survey, its methodology and rationale, and the major findings of that survey. What we present here is a broad overview of MT9; future articles will explore these findings in much greater depth.
Objectives and New Features of MT9
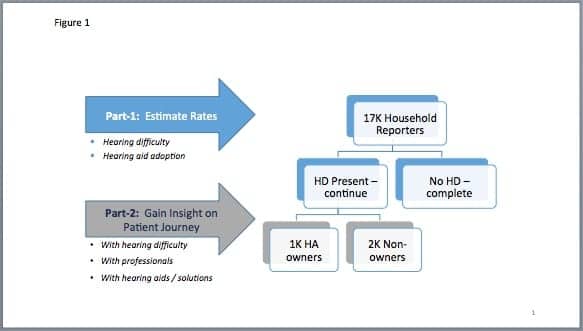
Figure 1. Overview of the survey process for MT9. Note: “HD”= hearing difficulty, and “HA” = hearing aid.
The primary objectives of MT9 were two-fold: the first was to estimate and track hearing difficulty (loss), hearing aid usage, and adoption rates within the United States by surveying 17,000 households; the second was to survey respondents who reported a hearing difficulty (1,000 hearing aid owners and 2,000 non-owners) in order to gain market insight, through the eyes of the consumer, on key areas of interest along the patient journey. Figure 1 provides an overview of the MT9 survey process.
What’s New in MT9?
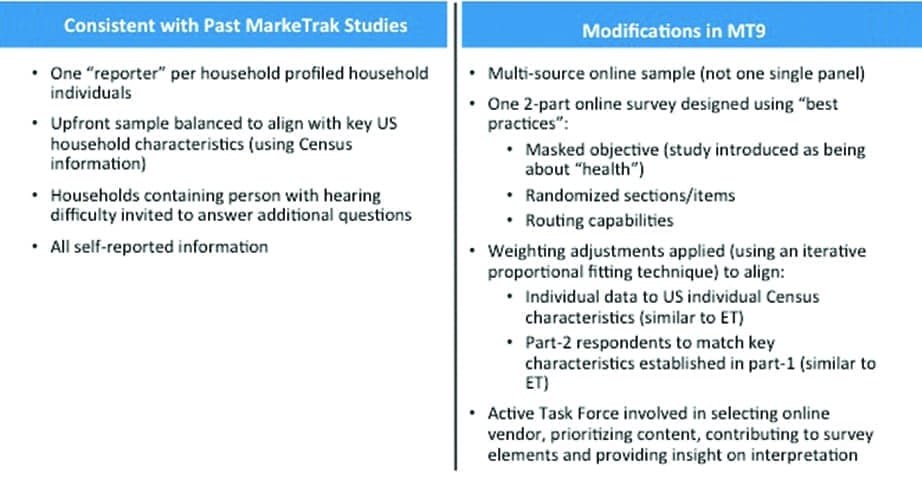
Table 1. Comparisons between past and current MarkeTrak surveys.
Table 1 highlights the differences between the past and current MarkeTrak survey characteristics. The previous eight MarkeTrak surveys used the National Family Opinion (NFO) mail panel, using paper-and-pencil surveys distributed though the United States Postal Service. This panel consisted of thousands of adults in North America pre-recruited to be designated sample members for a specified period of time.
In contrast, MT9 employed an online survey technique. Utilizing an online survey method allowed a level of sophistication in data collection unprecedented in the 25-year history of MarkeTrak surveys. The EuroTrak survey,2 published in the February 2011 Hearing Review, employed similar techniques allowing for some direct comparisons between European and American data. Some of the characteristics of the current survey method include:
- Multi-source sample to include one-time and infrequent responders in addition to the online panel members providing for a more robust base;
- One survey (2-parts) and a more controlled survey process;
- Randomized sections and items to minimize and/or remove the effect of order bias within a section or question;
- Routing/skipping capabilities utilizing programming logic to customize follow-up questions based upon earlier responses in order to make the survey efficient and relevant for each person;
- Best practices approach to include masking the objective of the survey (the survey was introduced to the prospective respondent as being about “health” as opposed to “hearing”);
- More rigor on question wording and instructions;
- Weighting adjustments (similar to those used for the EuroTrak survey2), and
- Incorporation of an active task force (retained research firms and researchers from member organizations and HIA staff) who:
- Helped select online vendor;
- Gave feedback to prioritize content;
- Contributed to survey design (eg, terms, definitions, images, flow), and
- Provided insight on analysis and interpretation.
What’s Remained the Same across MarkeTrak Surveys?
While MT9 incorporated innovative survey design strategies, some elements have remained the same over time. These include:
- One “reporter” per household profiling household individuals. Each reporter is a sole/joint head-of-household adult within the home;
- Upfront sample balanced to align with key US household characteristics (using US Census information);
- Households containing person with hearing difficulty invited to answer additional questions, and
- Self-reported information.
Despite the differences between MT9 and its predecessors, it’s important to understand that both past and present MarkeTrak studies employed solid study designs. Online samples and mail panels both have strengths and weaknesses, but balancing/weighting was used in both surveys to align samples with known characteristics for the US as a whole.
However, it may help to consider MT9 as a new baseline. It’s possible that some differences between MT9 and previous surveys may be due to changes in how the survey was designed and conducted (eg, the use of masking and online capabilities not available in previous mail studies). Additionally, the mail panel upon which previous MarkeTrak surveys were based has been dissolved, making direct comparisons and diagnosing the size of the effect of changing the method of data collection impossible to analyze. That said, MT9 is a well-designed online survey with intuitive results, providing excellent insights and driving new ideas for future surveys.
KEY FINDINGS FROM MT9
The Overall Market & Adoption Rates
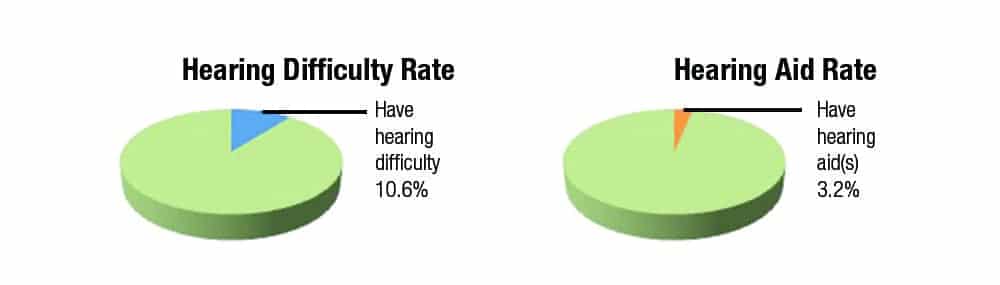
Figure 2. Hearing difficulty and hearing aid ownership rates as a percentage of the 13,018 individuals surveyed.
As shown in Figure 2, the MT9 data suggest that both the hearing difficulty and hearing aid rates are in familiar territory compared with past survey results: 10.6% of the individuals have self-reported hearing difficulty (compared to 11.3% in the 2008 MarkeTrak VIII survey) and 3.2% have hearing aids (compared to 2.8% in MarkeTrak VIII).

Table 2. The reported hearing aid adoption rate for MT9 (2014) was 30.2% compared to 24.8% in MarkeTrak VIII.
Small, yet significant, changes in both component rates, in opposite directions (ie, hearing difficulty rate is down and hearing aid usage rate is up) result in a somewhat higher adoption rate than seen in MarkeTrak VIII.
As illustrated in Table 2, 30.2% of those with hearing difficulty currently report owning a hearing aid compared to 24.8% in 2008. Part of this increase is likely due to the change in methodology (including the incorporation of masking the objective of the survey).
The profiles of key segments, however, are very consistent with expectations and with past MarkeTrak data:
- Most individuals with hearing difficulty have a bilateral loss (74% for all ages);
- Hearing aid owners are even more likely to have bilateral loss and most often have bilateral hearing aids (72% for all ages);
- The incidence of hearing loss and of hearing aid ownership increases with age (Figure 3), and both are slightly higher for men than women (12.1% of men had hearing loss and 3.7% owned hearing aids, versus 9.2% and 2.7% for women);
- Hearing aid owners have more severe loss than non-owners, but most within both groups classify their hearing loss as mild or moderate (72% mild or moderate and 25% severe for hearing aid owners, versus 89% and 9% for non-owners, respectively).
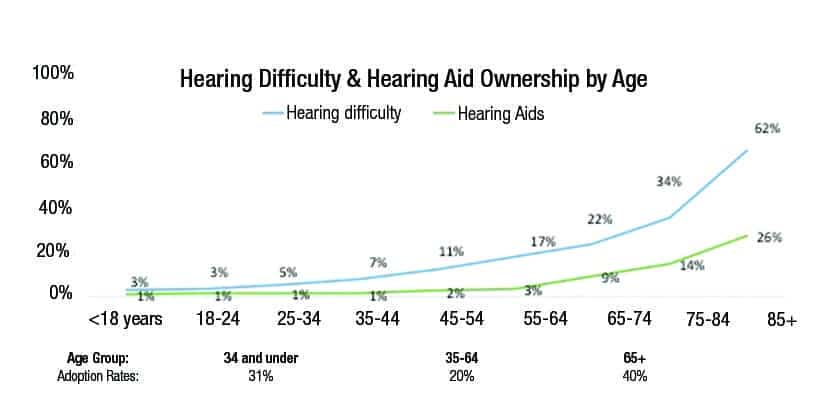
Figure 3. Hearing difficulty (in blue) and hearing aid ownership (in green) as a function of age, with adoption rates for three age groups shown at the bottom of the graph. Hearing aid adoption rate is calculated by dividing the hearing aid ownership percentage by the self-perceived hearing aid difficulty percentage (n=13,018).
Figure 3 illustrates reported hearing difficulty and hearing aid ownership as a function of age and hearing aid adoption rate, and as a function of three age groupings. As seen, not many individuals under 35 years of age experience hearing difficulty, but when they do, about 3 in 10 get hearing aids. The hearing aid adoption rate increases substantially at age 65 and above, where the highest adoption rate is at about 40%. Not surprisingly, adoption rates increase with self-reported hearing difficulty except for a small group classifying their hearing loss as profound where it decreases slightly.
The highest adoption rates continue to be among seniors, but there is an increase in uptake within the younger segments. The adoption rate among children and young adults is higher than among middle-aged individuals (but the incidence of hearing difficulty within the younger segments is quite low, which somewhat tempers the impact on the market as a whole).
Two important findings of MT9 are that the average age at which the respondents reported purchasing their first hearing aid is somewhat lower (63.3 years of age for adults only vs 68.9 years as referenced in the 2008 MarkeTrak VIII),1 and there is a higher percentage identifying themselves as first-time buyers (57% vs 37% in 2008). It is important to note that first-time owner percentage fluctuated substantially in past surveys (from 29% to 53%). Owners have been aware of their hearing difficulty longer than non-owners (13.0 vs 9.5 years, respectively) and have higher median incomes ($66,000 per year vs $54,000) even though most/more of the owners are retired. Both of these findings were directionally different compared to past MarkeTrak studies (ie, MarkeTrak VIII data indicated non-owners were aware of the hearing difficulty longer and had higher income than owners).
MT9 has revealed some new and positive indicators. The proportion reporting a hearing screening during a physical exam is higher at 23% among adults, compared to 15% in MarkeTrak VIII. Looking across all individuals/ages, the highest rates of screening are among children and the oldest adults. The widespread implementation of Universal Newborn Hearing Screening (UNHS)3 as part of the Early Hearing Detection and Intervention (EHDI) program,4 could potentially explain this increase and the higher adoption rates among younger individuals. Increased awareness, appreciation, and acceptance at an earlier age may also have a positive influence on these individuals (and their parents) as they age.
Influence of the PCPs and HCPs
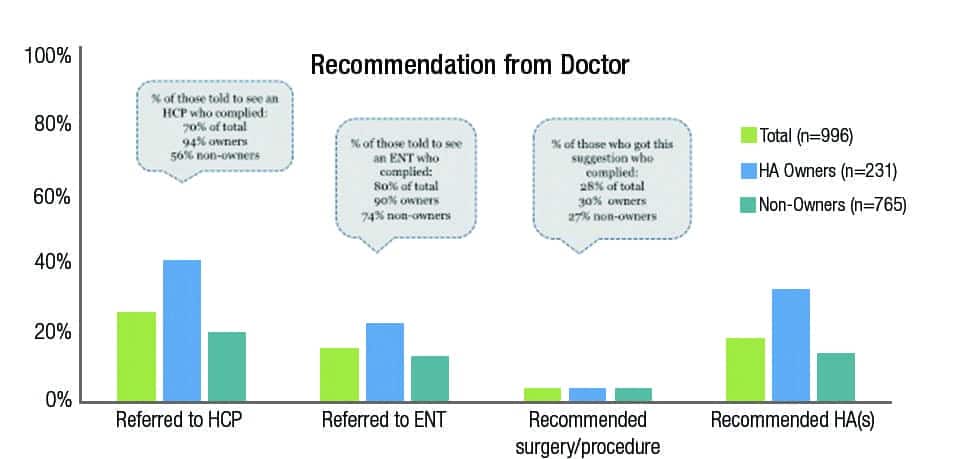
Figure 4. Types and percentages of recommendations made by primary care physician as a function of respondents who own or do not own hearing aids. (Note: Some additional respondents chose to take each of these actions on their own without seeking or getting a recommendation from a primary care provider.)
As shown in Figure 4, the primary care physician (PCP) influences a sizable proportion of the market. The vast majority of consumers think of hearing aids as medical devices, and many consider a positive recommendation from their physician to be a key motivator. Approximately one-third of the survey respondents indicated that their PCP discussed or screened their hearing as part of their appointment. To date, the interaction with the PCP is likely to be less motivating than interactions with other professionals, even when controlling for level of hearing difficulty.
People tend to visit a hearing care professional (HCP) for the first time in order to get information (ie, to assess their hearing)—not necessarily to purchase hearing aids. While some may end up purchasing hearing aids, it is important for professionals to pay attention to the patient’s motivation for coming in. Catering to the patient’s needs and exploring their motivation will likely increase their level of satisfaction and may keep them moving forward in their journey toward hearing aid adoption. The level of intrinsic motivation is higher among those who visit more than one HCP along the way (as some patients may be appeasing others at the initial visit). Some individuals need time to absorb the diagnosis and to receive encouragement and counseling before taking the next steps toward hearing aid ownership.
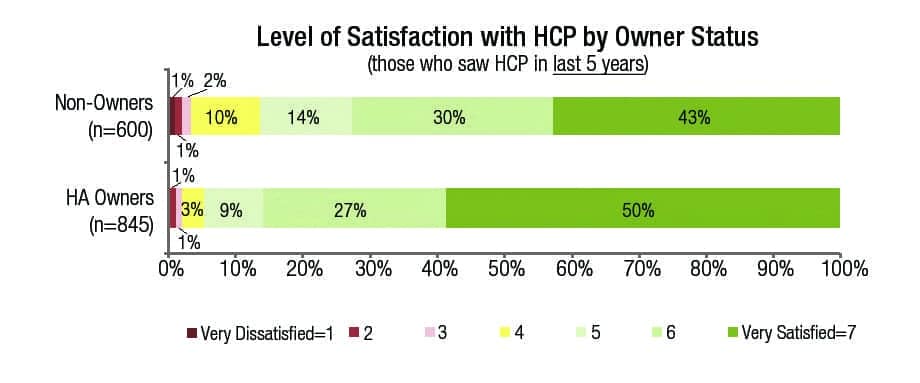
Figure 5. Satisfaction rate with HCPs as a function of hearing aid ownership. HCPs = hearing care professionals.
Overall, HCPs are perceived positively. As shown in Figure 5, 95% of owners and 87% of non-owners are satisfied with HCPs seen in the last 5 years. We can also see that hearing aid owners are more likely to be satisfied with their HCP than non-owners. A less-than-satisfactory experience may have been a reason why some non-owners did not try hearing aids. Nonetheless, the vast majority of both groups are more satisfied than not. Not surprisingly, consumers are more positive when they feel the hearing care professional is well organized/efficient, their needs and abilities are being taken into consideration, and they feel they are getting quality counseling throughout and after the purchase.
Hearing Aid Satisfaction
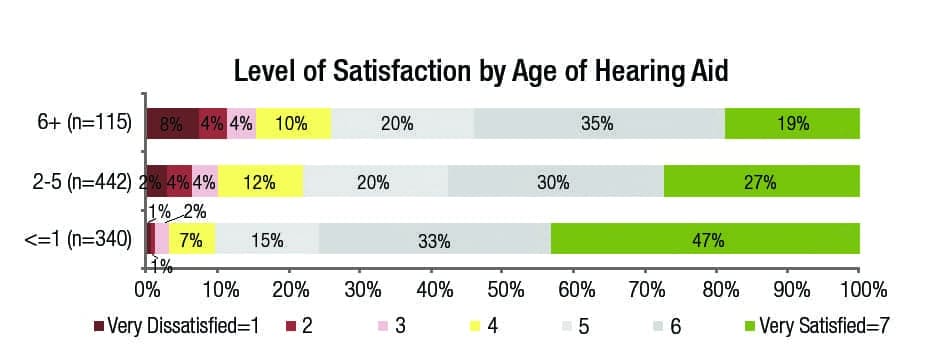
Figure 6. Satisfaction with current hearing aids as a function of the age of the device. (Note: Those who said “not sure” were removed from the base. The percentages are for those able to evaluate each area.)
Satisfaction with current hearing aids is relatively high. Figure 6 shows that satisfaction is higher among those with newer hearing aids: 91% for hearing aids obtained in the last year; 77% for hearing aids obtained 2-5 years ago; and 74% for hearing aids obtained 6 or more years ago.
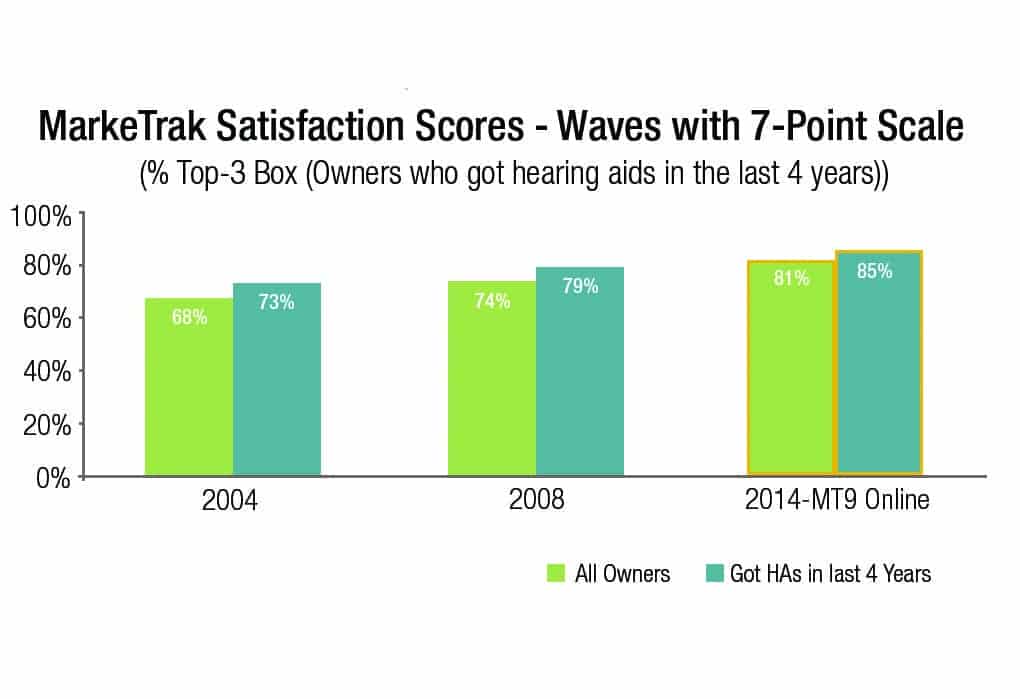
Figure 7. A comparison of satisfaction scores as a function of survey year and years of ownership.
Furthermore, overall satisfaction has increased from 74% in 2008 to its current level of 81% (Figure 7).
Additionally, Table 3 shows that a smaller proportion of owners appear to have their hearing aids “in the drawer” (3%, down from 12% in 2008), which is closer to rates seen in the past EuroTrak survey.2

Table 3. Frequency of hearing aid use as a function of all hearing aid users and adult hearing aid users. (Note: For frequency of use, MarkeTrak VIII had a percentage of “12% in the drawer,” whereas EuroTrak had a much lower rate, between 4.7-7% per country. Neither of these studies offered a “varies” option.)
Furthermore, over half (51%) of repeat buyers consider their current hearing aids to be “much better” than their first hearing aids, while 34% consider them “somewhat better” (13% indicated “the same” and 2% “somewhat worse”). They attribute this improvement to several factors including a better product, a better experience with the hearing care professional, a greater willingness to wear hearings aids, and a clearer sense of wants/needs (eg, premium sound quality, reduced feedback, and ease of use).

Table 4. Key factors differentiating satisfied vs not satisfied respondents.
The drivers of hearing aid satisfaction center on sound quality, value, and the effectiveness of enhanced features. Table 4 shows that, when it comes to sound quality, the clarity of sound, the degree to which what they hear sounds natural, and the fidelity/richness are most influential in influencing satisfaction levels.
When it comes to technology/features, the most satisfied owners tend to own wireless hearing aids (particularly those with newer wireless technology) and feel their hearing aid successfully minimizes background noise and/or is comfortable to wear when listening to loud sounds.

Figure 8. Percentage of respondents who would recommend hearing aids and repurchase the hearing aid they own as a function of year of MT survey.
It is important to recognize that owners are not always able to align specific benefits with respective features; they simply know if a hearing aid sounds good/better and works well. Of particular note is the increase in the percentage of current hearing aid owners who would recommend hearing aids to others as compared to previous MarkeTrak surveys (Figure 8).
Hearing & Listening Experiences
The respondents reported a relatively high level of satisfaction across all listening conditions, with the level of satisfaction being related to the age of their hearing aids (Figure 9). Not surprisingly, and consistent with past surveys, the listening situation with the lowest satisfaction level across all groups is “trying to follow a conversation in the presence of noise” (50% satisfaction for owners with hearing aids 6+ years old, and 67% satisfaction for aids <5 years old).
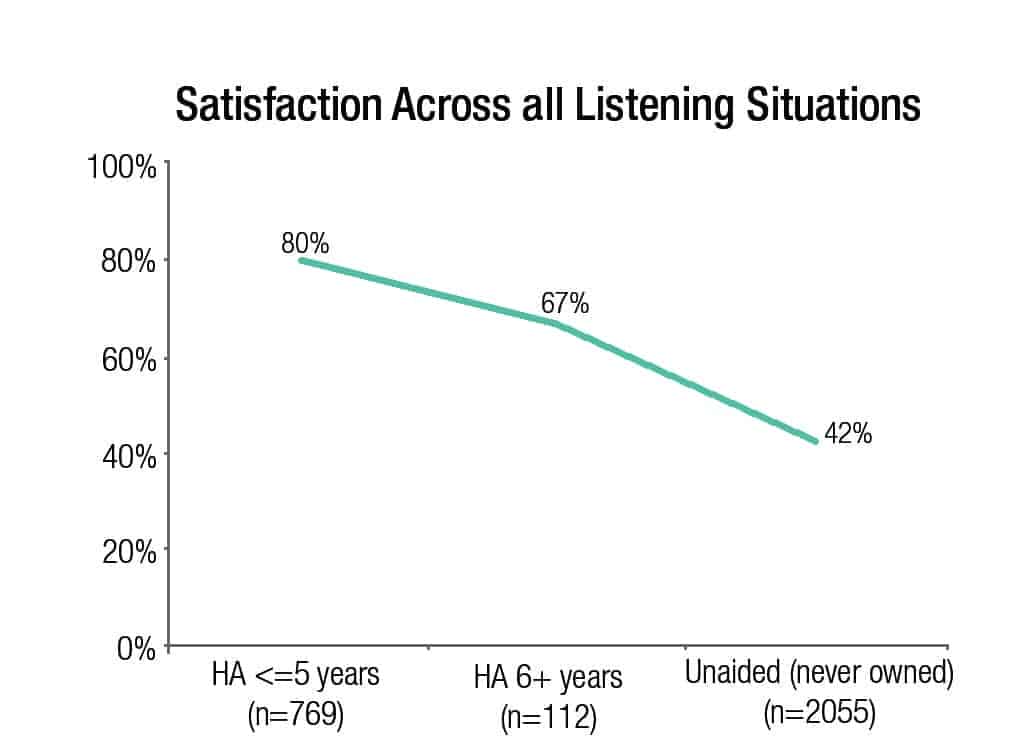
Figure 9. Percentage of respondents reporting satisfaction across all listening situations as a function of ownership and age of hearing aid. Owners are rating their satisfaction with their hearing aid in each listening situation, and non-owners are rating their satisfaction with their ability to hear in each listening situation.
Those with hearing aids rate this area lower than other listening situations. However, it is important to note that non-owners are also the least satisfied (25% satisfaction) with their ability to hear in this environment, indicating speech in noise is a universal problem. Classrooms and large lecture halls are also more problematic than some other venues. The level of satisfaction with the listening experience when talking on a phone (including cell phone) is among the lowest of all the areas assessed.
Barriers to Hearing Aid Adoption
The most common reasons people do not buy hearing aids and/or take action are financial constraints and lack of a perceived need. Once those are peeled way, the “stigma effect” starts to surface (eg, they are too young to wear hearing aids, hearing aids are too embarrassing or unattractive, etc). Some respondents indicated that they are not clear as to where they should go to be evaluated. The non-owners with more severe hearing loss often have greater financial constraints, making it more difficult to purchase hearing aids compared to those with moderate losses who tend to have fewer financial barriers.
The most common reasons people report that they stop wearing or return their hearing aids are because the device is physically uncomfortable or does not perform as well as expected. Performance falls short of expectations when there is too much background noise, too much feedback, and/or poor sound quality.
Most non-owners are not aware of enhanced technology, but when introduced to it they are most intrigued by practical functions (eg, being able to control volume on the hearing aid, rechargeable options, settings for different listening environments, a remote control, etc), then by enhanced features (eg, directional/multiple microphones, tinnitus masking, ability to link changes in a binaural fitting, and the ability to stream sound).
Facilitators to Hearing Aid Adoption
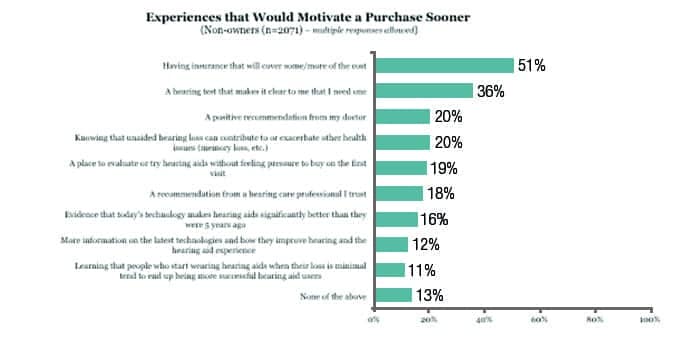
Figure 10. Factors that would facilitate non-owners to purchase hearing aids (n=2071 non-owners).
Figure 10 illustrates the factors that non-owners report might facilitate their purchase of hearing aids. Having a compelling test result (36%) and increased insurance coverage (51%) represent the top two factors. However, there is a segment of non-owners who would not accept hearing aids even if they were free. There are individuals with more potential for adoption, and future efforts might focus on identifying “the right individuals at the right time” represented by people with fewer competing burdens and a moderate degree of hearing loss (about 4-in-10 non-owners have self-reported hearing losses similar to owners). From a psychological standpoint, these would be those who are:
- Optimistic problem solvers who feel supported in their “circle”;
- Intrinsically and extrinsically motivated to communicate (eg, enjoy socializing, still active, etc), and/or
- At a stage in their journey where they can admit publicly that they have a hearing loss.
Individuals who use hearing aids reap benefits that might not be obvious to non-owners:
- They see enhancements in all facets of life;
- They rarely feel embarrassed or rejected due to hearing aids;
- The level of satisfaction with their listening experience overall is dramatically higher than those who “suffer in silence” (or closer to it), and
- They perceive that wearing hearing aids regularly or occasionally improves the quality of their life (Figure 11).
CONCLUSIONS
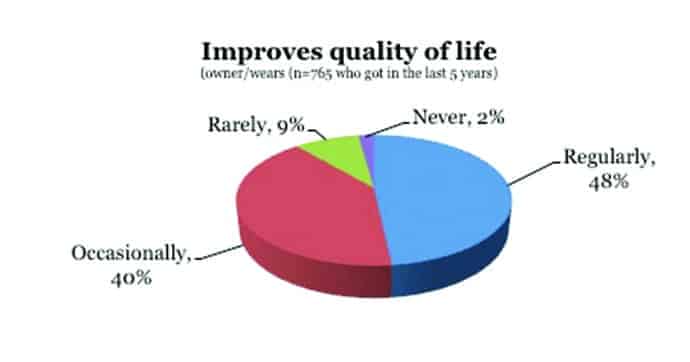
Figure 11. The extent to which hearing aid owners perceive that their hearing aids improve their quality of life (n=765 with hearing aids < 5 years old).
MT9 uncovered a familiar market with some positive indicators. While the overall target customer is largely the same as in the past, there is some new activity in the youngest “slice” of the market, likely driven by an increase in early childhood screening over the past two decades. Increased awareness and appreciation/acceptance of hearing aids at an earlier age might have a positive influence on these individuals and their parents as they age. Future efforts could focus on identifying “the right individuals at the right time.” The major findings of MT9 suggest that:
- The PCP has an influence on a sizable proportion of the market.
- The HCP is positively perceived.
- Overall satisfaction with hearing aids appears to be increasing.
- Although consumers report that they benefit from enhanced technology, they may not be able to align better sound with specific features.
- Satisfaction with hearing aids is very highly correlated with satisfaction with sound quality, which is influenced by the degree to which sound is clear, natural, and rich.
- Other important factors associated with satisfaction include how well the hearing aid works in loud environments, the degree to which it minimizes background noise, the ability to tell where sound is coming from, and how effectively feedback is managed.
- Repeat purchasers place increased emphasis on premium sound quality, reduced feedback, and ease of use.
- Most non-owners are not aware of enhanced features and accessories available in hearing aids.
- Individuals who suffer from hearing difficulty and who use hearings aids reap many benefits that might not be obvious to non-owners.
In future articles, we will explore the MT9 data and their implications in greater depth.
References
-
Kochkin S. MarkeTrak VIII: 25-year trends in the hearing health market. Hearing Review. 2009;16(11):12-31. Available at: https://hearingreview.com/2009/10/marketrak-viii-25-year-trends-in-the-hearing-health-market
-
Hougaard S, Ruf S. EuroTrak I: A consumer survey about hearing aids in Germany, France, and the UK. Hearing Review. 2011;18(2):12-28. Available at: https://hearingreview.com/2013/03/eurotrak-japantrak-2012-societal-and-personal-benefits-of-hearing-rehabilitation-with-hearing-aids
-
Delaney AM. Newborn hearing screening. Medscape (September 11, 2014). Available at: http://emedicine.medscape.com/article/836646-overview
-
Joint Committee on Infant Hearing. Year 2000 position statement: Principles and guidelines for early hearing detection and intervention programs. Pediatrics. 2000;106:798–817. Available at: http://www.jcih.org/jcih2000.pdf


Correspondence can be addressed to Dr Abrams at: [email protected]
Original citation for this article: Abrams HB, Kihm J. An Introduction to MarkeTrak IX: A New Baseline for the Hearing Aid Market. Hearing Review. 2015;22(6):16.