Editor’s Note: The information found in this article is adapted with permission from the study, “The Impact of Untreated Hearing Loss on Household Income,” by Sergei Kochkin, PhD, of the Better Hearing Institute, Alexandria, Va.
The bad news is that—treated or untreated—people will pay for their hearing loss. The good news is that those who take positive action and seek treatment via amplification will ultimately save themselves, on average, thousands of dollars in lost wages and future income.
This is the conclusion of a recent study conducted by the Better Hearing Institute (BHI). Surveying more than 40,000 households utilizing the National Family Opinion (NFO) panel, hearing loss was shown to negatively impact household income by up to $12,000 per year, depending on the degree of an individual’s hearing loss. However, the use of hearing instruments was shown to mitigate the effects of hearing loss by 50%.
For America’s 24 million hearing-impaired who do not use hearing instruments, the impact of untreated hearing loss is quantified to be $122 billion annually in lost wages. At a 15% tax bracket, the cost to the federal government could be well in excess of $18 billion in unrealized taxes.
Scope of Hearing Loss
According to a recent national survey by the BHI,1 more than 31 million Americans in non-institutional settings admit to a hearing loss. Only 37% are at retirement age. The majority are either at school age or in the work force. Only 23% of hard-of-hearing Americans are being helped with hearing instruments, which are the necessary treatment for 90-95% of people with hearing loss.
There is an extensive body of research concerning the impact of hearing loss on quality of life.2-3 When we talk of “quality of life,” healthy hearing per se is not just to enhance aesthetic pleasure of acoustic sounds in a person’s environment; indeed, hearing loss has been shown to negatively impact nearly every dimension of the human experience including:
- Physical health.
- Emotional and mental health.
- Others’ perceptions of a person’s mental acuity.
- Social skills.
- Family relationships.
- Self-esteem.
- Work and school performance.
In a recent review of the literature,4 Bridget Shield, PhD, professor of acoustics at London South Bank University, has shown that hearing loss is related to unemployment and underemployment. However, the majority of research clearly has focused primarily on people with severe to profound hearing loss.
The literature, however, is less clear on the impact of lower levels of hearing loss and how they impact effectiveness in the workforce. Some recent studies indicate that minimal hearing loss is detrimental to the learning of language skills among children.5 In addition, while the link between hearing loss and employment has been established by Shield,4 for those receiving treatment for hearing loss, it is difficult discerning whether or not such treatment is associated with improvements in their economic prosperity.
The purpose of this paper is to quantify the relationship between treated and untreated hearing loss and income.
Study Method
In November 2004, a short screening survey was mailed to 80,000 members of the National Family Opinion panel. The NFO panel consists of households that are balanced to US census information with respect to market size, age of household, size of household, and income within each of the nine census regions, as well as by family versus non-family households, state (with the exceptions of Hawaii and Alaska), and the nation’s top-25 metropolitan statistical areas.
The screening survey covered only three issues:
- Physician screening for hearing loss.
- Whether the household had a person “with a hearing difficulty in one or both ears without the use of a hearing aid.”
- Whether the household had a person who was the owner of a hearing instrument.
This short survey helped identify close to 16,000 people with hearing loss and also provided detailed demographics on those individuals and their households. The response rate to the screening survey was 66%, and this information was reported in the July 2005 The Hearing Review (the first publication in this series).1 In January 2005, an extensive survey was sent to 3000 random hearing instrument owners and 3000 random people with hearing loss who have not yet adopted hearing instruments. The response rates for the detailed surveys were 75% and 77%, respectively.
The data presented in this article refer only to households as defined by the US Bureau of Census; that is, people living in a single-family home, duplex, apartment, condominium, mobile home, etc. People living in institutions have not been surveyed (eg, residents of nursing homes, retirement homes, mental hospitals, prisons, college dormitories, and the military).
Detailed demographics of the hearing instrument owner population are documented in the first publication (see July 2005 HR),1 so they will not be repeated here. Hearing instrument owners responded to a 7-page survey consisting of 188 questions or response scales in the following areas: hearing instrument owner demography, hearing loss measures, product features, customer satisfaction and usage, future behavior, factors influencing hearing instrument adoption, and perceptions of hearing care providers. Non-owners also responded to a 7-page survey covering non-owner demography, hearing loss measures, visitation with hearing health professionals and medical profession, reasons for non-adoption of hearing instruments, and future plans.
Sample Selection. From the screening phase, close to 16,000 people with hearing loss were identified. Excluding children and people in the household who were not the head of household or spouse of the head of household, the following sample sizes were achieved for this study:
- Aided (n=1,891 households) where the head of household or spouse indicated that one or more had a hearing loss and that one or more wore a hearing instrument.
- Unaided (n=1,954 households) where neither the head of household nor spouse wore a hearing instrument but reported that one or more had a hearing loss.
- Normal Hearing (n=39,420 households) where neither the head of the household nor spouse reported they had a hearing loss.
Other Possible Variables in Income Analysis
The following variables were evaluated as possible predictors of household income:
- Household designation. A 7-point classification of household composition: “husband and wife,” “male, no wife, child and/or other relative present,” “female, no husband, child and/or other relative present,” “male living alone,” “female living alone,” “male living with non-relative,” or “female living with non-relative.”
- Marital status. A 2-point classification: “currently married,” or “currently not married.”
- Age. There were 12 brackets, ranging from 25-79 in 5-year increments, plus age 85+.
- Geography. There were nine regions: East North Central, East South Central, Middle Atlantic, Mountain, New England, Pacific, South Atlantic, West North Central, West South Central.
- Market size. There were four city sizes based on where the household resides: <50,000 population, 50,000-499,000, 500,000-2 million, >2 million.
- Hearing loss by group. Ten aided samples, 10 unaided samples, and one normal hearing loss sample for a total of 21 groups (see sidebar, “Defining Deciles of Hearing Loss”).
All demographic variables were included in the model since they were significantly correlated with group membership. Education was not included in the model since there were no significant differences in educational level as measured in years between the three groups. The average year of schooling attained by group was as follows: normal hearing group (12.75 years), unaided group (12.66 years), aided group (12.61 years).
Results
The overall model of household income using all predictor variables was significant (F=212.51, df=49, p<.0001, R2=.194). All variables were significant at the p<.0001 level as shown in Table 2.
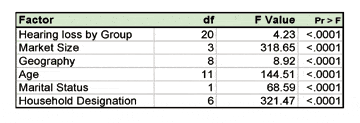
TABLE 2. ANOVA results for the prediction of household income. All six demographic factors were significant relative to income prediction to the 1/10,000th level.
Cost to individuals/households. The least square means (adjusting for the variables in Table 2) for the 10 hearing loss groups and the single normal-hearing group are plotted in Figure 1. The linear model expressing the relationship between hearing loss and income is approximately $53,200 – $1,180 (ie, any given decile minus $1,180) for every 10% increase in hearing impaired as measured in this study. In other words, individuals with the most serious hearing loss (Decile 10) could be expected to earn $12,000 less per year than an individual with a mild (Decile 1) hearing loss.
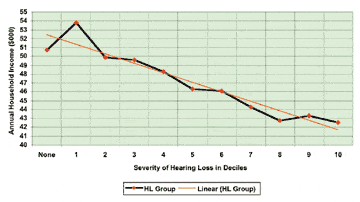
FIGURE 1. Relationship between hearing loss and household income for normal-hearing group (“None”) and hearing loss groups (Deciles 1-10, combining users and non-users of hearing instruments).
Does the use of hearing instruments mitigate the impact of hearing loss on income? Figure 2 plots the least square salary profiles for the hearing-impaired individuals who use hearing instruments and for those who do not. (These salaries are again adjusted for the demographic variables listed in Table 2.)
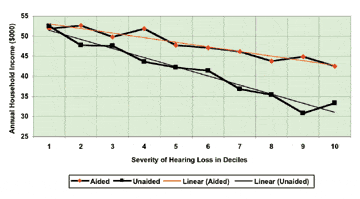
FIGURE 2. Relationship between hearing loss and household income, comparing users and non-users of hearing instruments.
The linear model of unaided household income (ie, involving subjects with hearing loss who do not use hearing aids) equals $53,500-$2,250 (for every decile of hearing loss). In contrast, the linear model aided household income (ie, involving subjects using hearing aids) equals $54,100-$1,130 (for every decile of hearing loss). While it is important to note that both treated and untreated hearing loss groups show deterioration of income as their hearing loss worsens, the income decline is cut in half for hearing aid owners. For example, the difference between Decile 1 (mild) and Decile 10 (profound) incomes as shown in the model in Figure 2 is as follows:
- Unaided income differential: $20,300
- Aided income differential: $10,200
Finally the difference between the unaided and aided linear models is shown in Figure 3 where the impact of non-treatment for hearing loss ranges from $1,700 to $11,700 per year depending on the severity of hearing loss. (Author’s Note: For sensitivity purposes we may not want to accept the difference at Decile 1 because the least square means are virtually identical for the lowest 10% of the hearing loss population before linear smoothing.) After Decile 1, the treated and untreated profiles diverge at the rate of approximately $1,000 for every 10% increase in hearing loss.
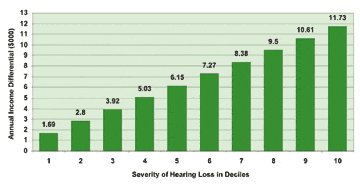
FIGURE 3. Household income differential when comparing aided versus unaided by severity of hearing loss (linear model).
Cost to Society. As shown in Table 3, the cost to society could be significant, since untreated hearing loss results in underachievement on the job. Currently 24.08 million people with admitted hearing loss do not use hearing aids in the United States. If we segment the non-owner population into hearing loss decile groups, it can be seen that the non-owner hearing loss is significantly lower than the hearing aid owner population hearing loss. For example 18.1% of non-owners are in the lower 10% of hearing loss in America. Now if we cross multiply population size by income differential we can arrive at:
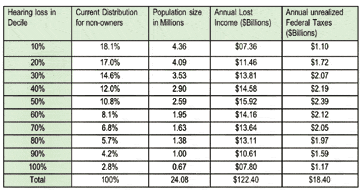
TABLE 3. Simulated household income loss and unrealized federal taxes from non-aided households (simplified).
- Estimated loss in income due to untreated hearing loss.
- Estimated federal taxes not realized due to untreated hearing loss assuming a 15% tax bracket (simplified).
The estimated cost in lost earnings due to untreated hearing loss is $122 billion while the cost to society in terms of unrealized federal taxes is $18 billion. For sensitivity analysis one can assume no impact on the bottom 50% of the population with hearing loss. No matter what cut-off is accepted, the impact on household income and unrealized Federal taxes will be significant.
Conclusions
Hearing is a critical sense for effective communication in the work force. Most employment situations require verbal communication in order to effectively engage in commerce and in dealing with the public; effective hearing is also critical to assure safety on the job. Without aided hearing, as this data and the literature show, the hearing-impaired individual can be expected to suffer losses in compensation, may make mistakes on the job, experience higher rates of underemployment and unemployment, and in general may experience an overall reduction in quality of life (ie, anxiety, depression, social isolation, social paranoia, medical health, emotional stability, cognitive functioning, etc) which may negatively impact job performance.
Most hearing care professionals are aware of individuals who delayed hearing loss treatment well past their working lives due to fear of stigmatization on the job. This author is personally aware of a CEO who indicated that he had delayed treatment for his hearing loss due to vanity until he made a critical error which personally caused him to lose a $1 million contract. We have also talked with individuals who suffered needlessly during their school years with “hidden” hearing loss.
Unfortunately, untreated hearing loss is not hidden, for it results in underachievement for nearly all who delay treatment while they are in the prime of their life. The tragedy is that untreated hearing loss impacts the individual and his/her family for life in the form of lost wages, lost promotions, lost opportunities, and unrealized dreams—not to mention lower income in their retirement. As Helen Keller said, “When you lose your vision, you lose contact with things. When you lose your hearing, you lose contact with people.”
| Defining Deciles of Hearing Loss Since income is hypothesized to be related to degree of hearing loss in this study, both aided and unaided subjects were divided into groups based on subjective measures of their hearing loss. Consumers were segmented into one of 10 groups (called deciles) based on their responses to four measures of hearing loss: • Number of ears impaired. One or two ears that had hearing loss. • Score on the Gallaudet Scale.6 The Gallaudet Scale is an 8-point scale in which respondents indicate whether they can understand speech under the following conditions: “whisper across a quiet room,” “normal voices across a quiet room,” “shouts across a quiet room,” “loud speech spoken into their better ear,” and “not able to understand loud speech in their better ear.” In addition, “tell noises from each other,” “hear loud noises at all,” “hear any sound or any noise” is assessed. An individual’s score ranges from 1-8.
What makes the Gallaudet scale of particular value is it has been validated against clinical information. The relationship between audiogram information (average dB loss better ear and standard deviation) per Gallaudet Scale score was reported in the 1984 Hearing Industries Association (HIA) paper based on a 1970 study conducted by Schien, Gentile & Haase.7 The Gallaudet Scale has historically been used by the Centers for Disease Control (CDC) in their quantification of the hearing-impaired population.8
• Subjective hearing loss score. Subjects were asked to rate their own hearing loss, from “mild” to “profound” (a score of 1-4). A factor analysis of the above subjective measures was performed revealing a single measure of hearing loss. Factor scores were computed and each household was placed into 1 of 10 hearing loss groups, where Decile 1 equalled the group with the mildest hearing losses (ie, the lower 10% of people with regard to the severity of hearing loss), and Decile 10 equalled the most serious hearing losses (ie, the top 10% of people who had them most severe hearing loss). Normal-hearing households were classified as “Normal.” The sample sizes for hearing-impaired households are shown in Table 1. |

Acknowledgement
This article is adapted with permission from Sergei Kochkin’s article, “The Impact of Untreated Hearing Loss on Household Income” which is found on the BHI Web site (www.betterhearing.org).
Correspondence can be addressed to HR or Sergei Kochkin, PhD, Better Hearing Institute, Ste 420, 515 King St, Alexandria, VA 22314; email: [email protected].
References
1. Kochkin S. MarkeTrak VII: Hearing Loss Population Tops 31 Million People. The Hearing Review. 2005; 12(7): 16-29. Available at: www.betterhearing.org/pdfs/MarkeTrak7_Kochkin_July05.pdf.
2. Kochkin S, Rogin C. Quantifying the obvious: The impact of hearing aids on quality of life. The Hearing Review. 2000; 7(1):8-34. Available at: www.betterhearing.org/pdfs/MR40.pdf.
3. Better Hearing Institute (BHI). Executive summary of the impact of hearing loss treatment. Alexandria, Va: BHI. Available at: http://www.betterhearing.org/hearing_solutions/qualityOfLifeDetail.cfm
4. Shield B. Evaluation of the Social and Economic Costs of Hearing Impairment. London: London South Bank University. Researched and written for www.hear-it.org; January 2005.
5. Bess FH, Dodd-Murphy J, Parker RA. Children with minimal sensorineural hearing loss: Prevalence, educational performance, and functional status. Ear Hear. 1998;19(5):339-354.
6. Hearing Industries Assn (HIA). HIA Market Survey: A Summary of Findings and Business Implications for the U.S. Hearing Aid Industry. Washington, DC: HIA; October, 1984.
7. Schien J, Gentile A, Haase K. Development and evaluation of an expanded hearing loss scale questionnaire. Vital and Health Statistics. 1970;2(37).
8. Prevalence and Characteristics of Persons with Hearing Trouble: United States, 1990-1991. Hyattsville, MD: US Dept of Health and Human Services; Series 10, No.188; March 1994.
9. Cox RM, Alexander GC. The abbreviated profile of hearing aid benefit (APHAB). Ear Hear. 1995;16:176-186.