Like many forms of technology, personal FM systems have improved greatly during the past few decades. A few years ago, smaller FM technology allowed the bulky body-worn FM transmitter and receiver to be replaced with smaller FM transmitters and very small FM receivers. Today, many of the newer FM receivers extend only a short distance from the bottom of a BTE hearing instrument and the user is not burdened with tangled cords. This technology allows for a true-wireless FM system.
Traditionally, FM systems were used in school classroom settings. The FM system provides a consistent input level to the child’s ear independent of the teacher’s or the child’s location in the classroom. Further, FM systems provide an increased signal-to-noise ratio (SNR) in the classroom listening environment.1,2,3 These improved listening conditions can also be beneficial in other activities where either the speaker-listener distance is great or the SNR is poor. Such activities might be lectures, concerts, restaurants, or in the car.
The miniaturization of the FM components has made the personal FM system more cosmetically acceptable, and many individuals (children and adults) are incorporating them into daily activities. Some hearing health care professionals are now asking questions like, “How do I test and fit these devices?” and, “How do I adapt my current FM fitting procedures to incorporate the hearing instrument?”
|
High-Technology Hearing Aids and Electroacoustic Measurements The advanced signal processing of high technology digital hearing instruments can affect electroacoustic measurements and cause unexpected results. One example of this type of processing is slow acting compression. Slow acting compression is used to automatically adjust the hearing aid gain while maintaining the amplitude fluctuations of the input signal.6 The slow gain changes can often take up to 20 seconds before the hearing instrument reaches the steady state gain for that input level. If electroacoustic measurements are obtained before the steady state gain is reached, the measurements will vary depending on the previous input levels. For example, if the test stimulus was preceded by a more intense signal, the hearing instrument gain will be increasing to the steady state gain for the measurement stimulus. In this case, the frequency response was obtained prior to the hearing instrument reaching steady state gain and the measured gain will be less than the expected steady state gain. Another special processing found in some high technology digital hearing instruments is noise reduction systems. These systems analyze the acoustic input to determine if the signal has speech-like or noise-like amplitude fluctuations. If the input signal is determined to be noise-like, it will be amplified less than if the input signal is determined to be speech-like. Noise reduction analysis is typically done independently in different frequency channels, and the degree of gain reduction will vary across frequencies. Electroacoustic measurements often use stimuli that have noise-like amplitude fluctuations (ie, constant intensity). While constant-intensity stimuli increase the ease of obtaining acoustic measurements, hearing instruments that implement noise-reduction systems can have reduced gains for these stimuli. Thus, the gain measured will be less than the gain expected for speech-like inputs. Further, the gain reduction is usually gradual and often takes around 30 seconds to reach steady state values. When measuring the electroacoustic characteristics of hearing instruments and FM+HA systems that use special processing, it is important to follow the manufacturer’s specific recommendations for these measurements. In many cases, the manufacturer has special test modes that can be used to obtain electroacoustic measurements. Otherwise, it is important to present the acoustic stimuli for a duration that will allow the hearing instrument to react and realize steady-state gain. Typically, this is around 30 seconds. Measurements that are obtained after the 30-second presentation should be consistent across both the hearing aid and the FM+HA conditions. Input-Output Characteristics of FM
When examining signals that have been processed by an FM system, it is important to realize that FM systems are typically non-linear.4 The input-output characteristics commonly found in FM systems are linear below a compression threshold around 70 dB SPL and implement a high compression ratio above the compression threshold (Figure 3). These compression characteristics are used to ensure that the signal is not distorted during FM transmission. Additionally, these compression characteristics result in minimal increases to the hearing instrument DAI for greater increases in the FM microphone inputs above 70 dB SPL. For example, if a 10:1 compression ratio is used in the FM system, a 70 dB SPL FM-input will be reflected as 70 dB SPL to the hearing instrument DAI, while an 80 dB SPL FM-input will be reflected as 71 dB SPL to the hearing aid DAI. These compression characteristics cannot usually be adjusted and limit FM+HA transparency to signals below the compression threshold. |

Getting Up To Speed: FM-System Components
If you’re a hearing care professional and feel that your knowledge is somewhat lacking when it comes to FM systems, you have one consolation: you’re not alone. However, the technology is fairly straightforward. FM systems consist of an FM transmitter and an FM receiver. The FM transmitter has a microphone that picks up the desired signal and converts it to an FM waveform that is broadcast over the airwaves. The FM receiver then converts the FM airborne waveform back into an electrical signal. As with all electronic devices, a power supply is required in the form of either rechargeable or disposable batteries.
The FM transmitter and FM receiver must be tuned to the same FM frequency to communicate (just like an FM radio). The main functions of the FM receiver are to detect the FM waveform, convert it to an electrical signal (by demodulation), and deliver the electrical signal to the next component, such as a receiver (eg, button receiver, headphones) or the direct audio input (DAI) of a hearing aid. Depending on the model of the FM receiver, the electrical signal can be shaped in frequency response, amplified, limited in output, or mixed with inputs from environmental microphones or other devices.
Again, this electrical device needs a power supply. For the small FM receivers that fit on the bottom of a BTE hearing instrument, the power supply is usually the hearing aid battery. Thus, the hearing aid battery will not last as many hours, because it is providing power to both the hearing instrument and the FM receiver.
FM systems that work independently of hearing instruments are adjusted to meet the amplification needs of the individual’s hearing loss. When fitting these stand-alone FM systems, the tone, gain, and output potentiometers of the FM receiver are adjusted to ensure the output is appropriate for the individual’s hearing loss. When an FM system is coupled to a hearing aid, the hearing aid determines the amplification characteristics for the individual’s hearing loss. In these cases, the FM system only transmits the airborne signal and delivers it to the hearing aid. In these cases, the hearing aid needs to be appropriately fit for the hearing loss and the FM system needs to be tested to ensure the combined FM and hearing aid system (FM + HA) does not produce any undesirable artifacts.
Fitting and Testing FM+HA Combinations
Electroacoustic testing and adjustments of FM+HA systems can sound like difficult tasks, but they are just adaptations of electroacoustic testing and adjustments of hearing aids. In fact, once a hearing instrument is fit and fine-tuned for an individual’s hearing loss, the FM+HA testing and adjustments can be done with coupler measurements.
One goal when adjusting an FM+HA system is to ensure that the systems are transparent. Transparency is realized when any given input signal to either the hearing instrument or the FM+HA system provides the same output signal.4 For example, the hearing instrument output measured in a 2cc coupler is the same for a composite-noise signal at 60 dB SPL delivered to either the hearing instrument microphone or the FM-transmitter microphone. After the measurements of transparency are obtained, the FM system can be adjusted to meet other FM-fitting goals. The necessary steps to determine transparency are as follow:

|
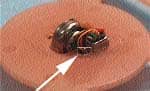
Figure 1. A hearing instrument connected to a 2cc coupler and positioned in a hearing aid test chamber for hearing aid microphone frequency response measurements. The instrument has been connected to the MicroLink system FM receiver that is placed in hearing aid input mode. |
|
Figure 2a. The transmitter is positioned in a hearing aid test chamber to present the acoustic stimuli. When the test chamber lid is closed, the FM transmitter can be placed outside of the chamber. |
|
Figure 2b. For FM-input measurements, the hearing instrument is connected to a 2cc coupler and placed in a quiet location outside of the hearing aid test chamber. The hearing instrument has been connected to the receiver that is placed in FM-input mode. |
1. Ensure the hearing aid is compatible for DAI. Not all hearing instruments are compatible for DAI. Typically, DAI compatibility is only available in BTE-style hearing instruments, but not all BTE hearing instruments provide the necessary connections for DAI or specific FM systems. In some cases, the signal is delivered to the hearing aid telecoil via electromagnetic signals (neck loop or silhouette). Telecoil couplings are often negatively affected by interference from computer monitors or fluorescent lighting. For the clearest FM signal, DAI is the preferred coupling method.
2. Ensure the hearing instrument is appropriately fit for the hearing loss. When using a FM+HA system, the input from the FM microphone will be delivered to the hearing instrument by an electrical signal. The FM signal has bypassed the hearing aid microphone and is delivered directly to the hearing aid processor. Therefore, with an FM+HA system, the hearing aid shapes the frequency characteristics of the FM signal necessary for the hearing loss. Depending on the hearing aid technology used, this can include ensuring that soft sounds are audible, normal conversational speech is comfortable, and that loud sounds are not too loud.
3. Obtain frequency response curves for the hearing instrument. Hearing instrument frequency response curves should be obtained for multiple input levels with composite noise signals.5 For these measurements, the hearing instrument is connected to a 2cc coupler and placed in the hearing aid test chamber (Figure 1). Ideally, a range of input intensities should be used (eg, 50-90 dB SPL). When time does not permit this procedure, curves should minimally be obtained for 60 and 90 dB SPL inputs. These curves are used to document the input-output characteristics of the hearing aid. The hearing-aid-only measurements become the reference for the FM+HA measurements. For hearing instruments that use advanced signal processing (eg, noise reduction, various compression schemes, etc), special considerations need to be made (see sidebar, “High-Technology Hearing Aids and Electroacoustic Measurements” in this article).
4. Attach the FM system to the hearing instrument. Attach the FM system to the hearing instrument, then put the FM+HA system in the FM-microphone-only mode. Confirm that the FM transmitter and FM receiver are set to the same transmission frequency. Turn on the FM transmitter (and FM receiver if necessary) and check for a transmitted signal from the hearing instrument. This can be done by a listening check with someone speaking into the FM microphone and another person listening to the hearing aid at a distance.
5. Obtain frequency response curves for the FM+HA system. The same parameters used to obtain the hearing instrument frequency response curves should be used to obtain FM+HA system frequency response curves. For these measurements, the FM transmitter microphone is placed in the hearing aid test chamber, and the hearing aid output is measured in the 2cc coupler. If the hearing aid microphone is turned off, the hearing aid and 2cc coupler do not need to be in the test chamber (Figures 2a, 2b).
Obtain frequency response curves using a composite noise signal and a range of inputs (eg, 50-90 dB SPL). The curves will be used to document the input-output characteristics of the FM+HA system and will be compared to the hearing-aid-only measurements. For hearing instruments that use advanced signal processing (eg, noise reduction, various compression schemes), special considerations need to be made (for more information, see the sidebar, “High-Technology Hearing Aids and Electroacoustic Measurements”).
6. Compare the curves and adjust the FM system as necessary. The frequency response curves for the hearing instrument and the FM+HA system can now be compared. If the FM system is transparent, the output frequency response curves should be identical for the same inputs to either the hearing aid or the FM microphones. Confirm for each input level that the frequency response shape and intensity are very similar.
If the outputs are different, the FM system gain or output controls will need adjustment to match the FM+HA curves to the hearing aid curves. If the frequency response shape is different, the FM system tone control will need adjustment. After each adjustment, new FM+HA curves need to be obtained for the new FM settings.
When making adjustments, it is also critical to ensure that the FM+HA output has the same response smoothness as the hearing-aid-only output. If this is not the case, typically one of two problems has occurred and adjustments will be necessary. The first potential problem is that the FM system gain is too low and the noise floor of the system has affected the output. In these cases, the FM system gain needs to be increased to place it above the noise floor. The second potential problem is that the FM system gain is too high and the FM system is overdriving the input range of the hearing aid DAI. In these cases, the FM system gain needs to be decreased to be within the input range of the DAI.
Currently, the amount of transparency that can be obtained through FM system is limited. For an FM system to be completely transparent it must process signals linearly, and most FM systems are not linear processors. Typically FM systems are linear below 70 dB SPL; therefore, transparency is limited to inputs below 70 dB SPL (see the sidebar on input/output characteristics).
|
Case Study of an FM + HA Fitting
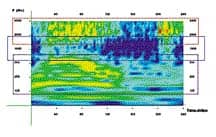
To demonstrate the necessary steps in fitting and testing FM+HA systems, a case study is presented below. Ms. J wears Senso Diva digital BTE hearing instruments which implement slow-acting compression and noise reduction (BTE styles are compatible with DAI). While she reports good benefit in many listening situations, Ms. J has expressed interest in increasing the ability to hear speakers at lectures. Although she tries to sit close to the speaker, this is often difficult as the seats are often occupied or reserved. Ms. J would benefit from a remote-microphone, such as a personal FM system. The MicroLink personal FM system by Widex has an FM microphone that can be either worn by the speaker or placed at the speaker’s podium. Ms. J would attach the small FM receiver to her BTE hearing instrument. The connection between the BTE and MicroLink FM system was designed to be transparent. Electroacoustic measurements can be used to document this transparency. In this case, the first two steps of fitting FM+HA systems have been completed. The third step is to obtain the hearing instrument frequency response curves. Curves were obtained with a composite noise stimulus with inputs of 50, 60, 70, 80, and 90 dB SPL. Each measurement was obtained after presenting the stimulus for at least 30 seconds. This ensured the hearing instrument was at steady-state gain for each measurement. The FM was then connected to the hearing instrument and the FM microphone was placed in the hearing aid test chamber. The output of the hearing instrument was measured in the 2cc coupler. Frequency response curves were again measured with the same stimulus parameters used for the hearing instrument measurements (ie, 50, 60, 70, 80, and 90 dB SPL composite noise inputs with a minimum of 30 seconds stimulus durations). The measurements for this case are presented in Figure 4. A close look at the curves indicates that the two systems are indeed transparent for 50, 60, and 70 dB SPL inputs (the FM linear region). The differences for 80 and 90 dB SPL inputs can be attributed to the compression characteristics of the FM system and cannot be adjusted with this device. Ms. J was instructed on how to use the FM system with her hearing instruments and in situations where it might be beneficial (eg, a noisy restaurant, watching TV). |

Summary
In noisy environments and when the speaker is not near the listener, a personal FM system is unmatched in improving poor listening situations. As the newer FM systems are more cosmetically acceptable, more dispensing professionals will be integrating them into their professional service offerings. The new FM systems are also easily coupled to hearing instruments. Digital instruments can improve listening situations with features such as noise reduction systems, feedback cancellation, and low compression thresholds.6,7 By coupling these systems together, the full benefits of both devices can be realized.
In some situations, other FM system fitting methods might be desirable.8 For example, when delivering a combined FM and hearing aid signal, it might be beneficial to have the FM microphone input amplified more than the hearing aid microphone input. In these cases, the steps provided in this article should be modified based on the appropriate fitting method. Whenever coupling FM systems to hearing aids, the hearing aid output should be checked to verify that the system provides appropriate amplification without undesirable artifacts.

|
Correspondence can be addressed to HR or John A. Nelson, PhD, Widex Office of Research in Clinical Amplification, 2300 Cabot Drive, Ste 415, Lisle, IL 60532; email: [email protected].
References
1. Boothroyd A, Iglehart F. Experiments with classroom FM amplification. Ear Hear. 1998;19(3):202-17.
2. Hawkins DB. Comparisons of speech recognition in noise by mildly-to-moderately hearing-impaired children using hearing aids and FM systems. J Speech Hear Disord. 1984;49(4):409-18.
3. Pittman AL, Lewis DE, Hoover BM, Stelmachowicz PG. Recognition performance for four combinations of FM system and hearing aid microphone signals in adverse listening conditions. Ear Hear. 1999;20(4):279-89.
4. Nelson JA. Coupling FM systems to high-technology digital hearing aids. J Educ Audiol. 2002. In press.
5. Dreschler WA, Verschuure H, Ludvigsen C, Westermann S. ICRA noises: Artificial noise signals with speech-like spectral and temporal properties for hearing instrument assessment. Audiology. 2001;40(3):148-57.
6. Kuk F. Rationale and requirements for a slow acting compression hearing aid. Hear Jour. 1998;51(6):41-53,79.
7. Kuk F. Optimizing compression: advantages of low compression threshold. Hearing Review. 1999;3(1):44-47.
8. American Speech-Language-Hearing Assn. Guidelines for fitting and monitoring FM systems. ASHA Desk Reference. In press.