| Unfortunately, the conception that “DSP instruments cannot be properly tested” has been projected to the hearing care field. The informed dispensing professional should know better. If a curve of predicted performance is displayed on the screen, then it must be the product of more than just wishful thinking. This article outlines methods for testing DSP instruments using pure tone and composite signals. A further method is shown that allows interactive response noise filter analysis, and spectral issues are also discussed. |
Digital hearing aids are still hearing aids.1 While they may have many benefits, they are not perfect. At least three possible sources of error exist when fitting hearing instruments (Fig. 1), and testing can ensure that these errors are minimized. Some digital instruments use noise reduction programs that can make them more difficult to test. Methods are outlined below to enable testing with pure tone and composite signals.
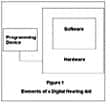
All hearing instruments have some elements in common. All include an input microphone, an output receiver, a battery with its connectors and some way to control the electronic circuit. In an analog hearing instrument, this hardware is all there is. In a digital hearing instrument, the additional element of software is added, and this determines how the hearing instrument operates. With most digital hearing instruments, a programmer is also needed to adjust the operational parameters. It may take the form of a small box with a cable that connects to the hearing aid, or it may be a personal computer operating under control of a programming module.
When fitting analog and digital hearing instruments, hearing care professionals will encounter many of the same types of problems. However, there are some problems unique to digital instruments. One of the best known has been labeled a “bug.” Software can get quite complicated, with many combinations of factors that must be taken into account for proper operation. A human designer has to put the software together and try to allow for all factors. Usually software goes through extensive testing to uncover bugs before the product is released. Obviously, companies do not want to produce devices that behave strangely. But humans are not perfect and we sometimes miss things. That is when a bug is born.
If a digital device has a bug, it is in some way unpredictable. Unfortunately, all kinds of bugs exist; some are obvious, but others are more subtle and not easily noticed. If the bug affects the setting of gain, for example, then it may be easily recognized. If it affects other parameters like automatic gain control (AGC), then it may not be as easily recognized.
Programming—A Prediction of Performance
When preparing a digital hearing instrument for the customer, it is usually programmed. In this process, the programming device often displays the predicted response of the hearing instrument as a graph or family of curves. It should be remembered that this display is a prediction, not an actual measurement. The programmer may make a display that, because of a software bug or other hearing instrument defect, does not show the real operating state of the hearing instrument. The instrument may have a frequency response that does not agree with that displayed on the screen. Its AGC action may be disabled, or its knee-points may be set to unknown levels.
It is up to the hearing care professional to determine if the hearing instrument is really doing what it is supposed to do. The professional must be willing to test a digital hearing instrument to be sure that it is operating correctly, and should verify that the hardware, software and programming are all working correctly—or determine that something has gone wrong and things are not behaving as was expected.
Unfortunately, the conception that “digital signal processing hearing instruments cannot be properly tested” has been projected to the hearing care field. The informed dispensing professional should know better. If a curve of predicted performance is displayed on the screen, then it must be the product of more than just wishful thinking. That curve represents information that has been collected in a series of tests—which means that the device must be capable of being tested. The question is "How?"
Noise Reduction
For decades, a goal of many hearing instrument manufacturers has been to solve noise problems. People wearing hearing instruments complain about noise of various types. One is circuit hiss: when the environment is quiet, the aid’s internal noise can be heard by the wearer. Another is that of steady-state environmental noise. Other types of noise, of course, also exist. For example, Widex, one of the first companies to offer digital technology, developed programs within their DSP aids to lower circuit hiss and improve steady-state environmental noise problems. This program can make the hearing instrument more difficult to test by conventional steady-state methods, so the company developed special testing procedures. Working out a good testing method is essential, and several manufacturers have developed digital instruments with similar algorithms and testing procedures.
A graph called a spectrogram is shown in Figs. 2a-b which were produced by a FONIX program called Tempus3D. They show a color mapped, one-sixth octave spectral presentation of the word “make.” Time is represented in the horizontal direction (x-axis) of the graph; frequency in the vertical direction (y-axis) and color as amplitude. The color-map bar can be seen below Figs. 2a-b. Modern hearing instruments break the spectrum into several ranges (or channels) and operate on each independently. These channels are shown in the spectrograms as horizontal boxes which, in order to preserve good sound quality, have a certain amount of overlap. In the Fig. 2a, the frequency of 700 Hz would actually influence both the lower and the middle frequency ranges.
a.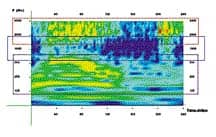
|

b. 
|
| Fig. 2a-b. Spectrogram of the word “make.” Time is presented in the x-axis, frequency in the y-axis and the colors reflect amplitude (see chart above). The three boxes delineate the portions of the spectrum that a three-channel hearing aid might use to separate the sound. Fig. 2b: Steady 250 Hz and pulsed 1500 Hz spectrogram. |
Fig. 2b demonstrates the reduction in gain from a steady-state 250 Hz tone as compared to a pulsed 1500 Hz tone which is not rejected. When a sound occurs that has frequency content in one band and not the others, it is treated as a single entity. In some advanced hearing instruments, if the sound is continuous, it is treated as noise; if the sound is not continuous, it is treated as speech. In Fig. 2b, the frequency band around 250 Hz is continuous, so it is treated as noise. The 1500 Hz band is pulsating, and the signal is treated as speech.
The hearing instrument does not immediately act on the application of a steady tone. It first waits for an interval of time to make sure that the signal is continuous before it starts to reject it. The amount of rejection and the waiting period are under control of the hearing aid’s internal program.
Pure Tone Testing
Traditionally, all measurements on acoustic devices have been done in steady state. A pure tone of a selected frequency and amplitude is applied to the hearing instrument and the output of the aid is measured with a coupler and microphone. Sometimes, the coupler is the client’s actual ear (real ear test). A digital aid, as described above, will work to reject the steady tone. After a period of time it considers the tone a noise signal. The gain measured with such a system will thus be erratic. It may start high, but then drop as the hearing instrument noise rejection program "kicks in." The first tone of the test may be amplified at full gain. The next test tone in a digitally controlled sweep will probably still be in the same frequency range, and the hearing instrument will consider it to be the same as that of the first tone, thus considering the original tone to be continued for a longer period of time. Perhaps the second applied tone in the sweep, or maybe the third, will start to be rejected. When the sweep reaches the boundaries of the next frequency range, the rejection process is started over for that range.
Modifications to Overcome Pure Tone Rejection
If the traditional approach were modified by making the tone present only a short time, the hearing instrument’s steady-state algorithm can be bypassed and a correct gain figure obtained. If the initial test frequency is followed immediately by a different one in order to make a different measurement, one would think that the rejection problem could be avoided. Unfortunately, as mentioned above, the hearing instrument’s filter ranges are not zero in width. Unless the new frequency is switched to a range different than the one preceding it, the hearing instrument does not know that the second frequency is different from the first, and it may activate the steady state noise algorithm. Waiting a substantial period of time between applications of the test tones is also possible, but the measurement of a complete response curve will then take more time.
A principle problem with the pure tone test scheme outlined above is that the width of the hearing instrument filter band is not known at the time the test procedure is designed. Therefore, it is possible that the frequency selection scheme used by the test program may not operate as expected. With some hearing instruments, changing test amplitudes also solves the rejection problem. Of course, a test with changing amplitudes does not directly compare with that of a normal pure tone sweep.
Fortunately, there are other approaches.
The Composite Signal
In the mid-1980s, an analyzer2 (FONIX 6500) was introduced that was capable of testing both pure tones and a composite signal. Normally presented in steady state, the composite signal consists of a series of pure tones, all added together. The lowest frequency is 100 Hz, with the other frequencies being multiples of this fundamental 100 Hz frequency (from 100-8000 Hz). The period of the lowest frequency is 10 milliseconds (ms). In its steady-state form, the composite signal presents a complete set of frequencies to the hearing instrument in every 10 ms interval. Thus, a single measurement that contains the complete response to all those frequencies contained in the hearing aid output signal can be made in one-hundredth of a second.
Composite testing is done in much the same way as pure tone testing, with the acoustic signal delivered to the hearing instrument with a calibrated sound source, and the sound from the hearing instrument delivered to the measurement microphone through a mechanical coupler or a real ear. When the signal is received from the hearing instrument, it is sampled, converted into a series of numbers with an analog-to-digital converter (A/D). These numbers are then analyzed by a technique known as the Fast Fourier Transform (FFT), which is a mathematical tool that allows the rapid dissection of the test signal into its individual frequency components. As stated above, a single 10 ms interval of time contains enough information to obtain a complete response analysis of the hearing aid to those frequencies present in the composite signal. Because of the speed of the mathematical and display processes, this response picture can be updated several times a second.
The composite system allowed interactive hearing aid measurements. As the response was seen on the CRT, the operator was able to adjust the controls and set power, AGC and frequency responses, in either coupler or real ear modes of operation.
Unfortunately, when the steady-state composite signal is presented to a digital hearing instrument that contains the noise reduction algorithm, the gain is shortly reduced in all ranges, because the composite signal covers the complete audio spectrum. It was noted, however, that a person operating a composite mode analyzer can make successful gain measurements by abruptly applying the signal and then pressing a “freeze” control to stop the procedure, then saving the results before the aid’s noise cancelling action swings into operation. While this system works, it lost the desirable interactive features of the standard composite test.
The Digital Speech Program
Fortunately, in composite testing, the complete spectrum is presented and measured in just 10 ms. It is, therefore, possible to switch the test signal on and off intermittently, mimicking speech. In the digital speech program, the speech signal is presented in bursts 300 ms wide, a period of time that approximates the time a person would take in sounding a word fragment. Natural speech occurs at a rate that varies, and therefore the rate that the intermittent test signal repeats is also made to be variable. These two time-related test signal considerations ensure that the hearing instrument considers the test signal to be speech. With this signal, the DSP (or any other) hearing aid may be examined at leisure.
It is now possible to perform interactive gain tests with modern digital hearing instruments. The amplitude of drive for the test should be set at a normal speech level, in the range of 65-70 dB SPL RMS. This is the level that would be recorded if a sound level meter were used to measure the acoustic power delivered to the hearing aid, and is the level that is selected by the test instrument’s source control. Quieter composite signals can be used for threshold tests, but a modulated pure tone signal has been found to be more desirable for the testing of the saturation or maximum power response of a hearing aid. (This program is really a mode or type of test signal and is available in coupler, as well as real ear testing, with commercially available equipment).
The Speech Spectrum
While the test system developed for analysis of digital hearing instruments gave repeatable and reliable results, they still did not match with those published by some manufacturers. The reason was that the spectrum used in the standard composite speech signal did not match that used by the manufacturer, and the program used in the hearing instrument is spectrum sensitive.
The normal spectrum used by most testing equipment is that proposed by the National Bureau of Standards a number of years ago and used today in the ANSI S3.42-1992/97 hearing aid test standard. This signal is designed to drop in intensity at the rate of 6 dB per octave as the frequency is raised above the 900 Hz knee-point, where it is down 3 dB. It represents an approximation of the short-term speech average, which is what is left after subtracting out the “dead spaces” in a time recording of speech.
The signal used by some hearing instrument manufacturers follows a spectrum suggested by the International Collegium of Rehabilitative Audiologists (ICRA), and represents an average across many languages at a normal speech level. The single male speaker equivalent has a spectrum that is flat to 500 Hz, where it then falls at the rate of 10 dB per octave (Fig. 3 compares the ANSI and ICRA digital speech spectra).

|
Fig. 3. Digital speech spectra of ANSI (—) vs. ICRA (n). This divergence has been a source of differences in test measurements. |

|
Fig. 4. Digital hearing instrument responses to steady state composite signals (—), and ICRA (n) and ANSI (q)digital speech signals. |

|
Fig. 5a. Low-frequency filter test showing no noise bias signal (q) and 500 Hz noise bias signal (—). |

|
Fig. 5b. Mid-frequency filter test showing no noise bias signal (—) and 1500 Hz noise bias signal (n). |

|
Fig. 5c. High-frequency filter test showing no noise bias signal (q) and 4000 Hz noise bias signal (—). |
The differences between the ANSI and ICRA systems were significant enough to cause some companies in the hearing industry to make special accommodations. For example, after Widex distributed its first testing CD, the company published a newer version in 1996 that includes different combinations of male and female speakers in different size groups and also in different speaking efforts. Analysis of all the speaking voices show the universal 10 dB/octave roll-off, starting at 1000 Hz.
The high frequencies are stronger in the ANSI spectrum, making it easier to define operation at high frequencies. This is because the stronger signal strength keeps operation of the analysis free from various sources of noise.
Selection of Test Spectrum
Because of the international challenges faced by hearing instrument manufacturers, the new digital speech program makes the ICRA spectrum standard for the speech-like test. With some test equipment, however, it is also possible to choose to use the ANSI spectrum.
It can be seen that Widex Senso operation using the ANSI spectrum shows stronger low-frequency and weaker high-frequency amplification because of spectral differences. The faster-acting AGC of the hearing instrument adjusts the gain according to the spectrum strength and is apparently a different program from that used for steady-state noise reduction.
Fig. 4 shows three curves taken with different signals. The first, lowest gain curve (open squares) shows a standard measurement of a digital hearing instrument with steady-state composite ANSI spectrum signal. The next curve shows the same hearing instrument with the same ANSI spectral drive, but presented with the digital speech format. The last curve (black squares) shows the same hearing instrument tested with the ICRA signal, again with digital speech. As can be seen, the hearing aid is very sensitive to the drive spectrum.
Testing the Hearing Aid’s Filter Action
Now that the basic job of checking the amplification of speech has been achieved, how about the operation of the hearing instrument filter bands? Is the steady state noise rejection program functional? Does it affect the gain at frequencies that are important to the reception of speech? To answer these questions, a steady state noise must be added to the speech test signal.
For example, using the Digital Speech in Noise program in the FONIX 6500, a pure tone can be used as a “noise” signal. The noise signal is added to the test signal by filling in the times between the speech bursts. Thus, it does not interfere with the measurement of the speech amplification but does influence the hearing instrument’s long-term filter action. Both amplitude and frequency of the pure tone can be controlled independently from the digital speech signal.
Three ranges of operation with steady state noise at a 65 dBSPL level are shown in Figs. 5a-c for a hearing aid. Each range is compared against the aid’s response with no noise, and with the digital speech signal at a level of 70 dBSPL. Fig. 5a displays the response with a "noise" input with 500 Hz, showing the effects of the low-frequency filter action. The midband filter action is affected by the higher bias or noise frequency of 1500 Hz, as can be seen in Fig. 5b. Finally, high frequency filter action is seen in Fig. 5c, where the bias was set to 4000 Hz. Significant filter action is seen in each case, with the gain reduced in the channel that is presented with the "noise" or bias signal.
It should be noted that this noise test is not the same as is used in a Speech Perception in Noise (SPIN) test, where the noise is added to check for intelligibility. The noise test used here is only intended to test the filter action of the hearing instrument.
Summary and Observations
It has been shown that the hearing care professional has good reasons to want to test the digital hearing instrument for proper operation. A review of the noise reduction program used by some manufacturers shows that the traditional methods of analysis will not yield consistent and reliable results when the hearing instrument incorporates steady-state noise-reduction programs. Two basic methods of testing are outlined: One uses pure tone drive signals; the other a speech-shaped composite signal. Both present the test signal to the hearing instrument in a non-steady-state manner. The composite method can be used to make interactive tests on the gain of the instrument, and steady “noise” in the form of a pure tone can be added to the composite signal to check filter action.
Some observations are also possible. If the hearing instrument is sensitive to the spectrum of the test signal, then it follows that it is also sensitive to the dynamic spectrum of a real speech signal. The term “dynamic” is used, because present forms of testing procedures always use speech spectrum averages, not the instantaneous instant-by-instant spectral characteristics of real speech.
What happens when the speech patterns of actual people are processed in these hearing aids? At the present, the hearing care professional relies on the person who wears the hearing aid to give a subjective opinion of its quality. A comprehensive system of dynamic measurement has not yet been developed. That remains as a future task. The tools are in place, however, that can inform the hearing care professional as to the operational status of the digital hearing instrument.

The author wishes to acknowledge the encouragement and contributions from Sören Westermann of Widex, who supplied a number of materials, including those describing the ICRA speech spectrum. Programming help was supplied by Dennis O’Doherty and Tim Russell of Frye Electronics.George J. Frye is an engineer and president of Frye Electronics, Tigard, OR.
Correspondence can be addressed to HR or George J. Frye, 9826 SW Tigard St., Tigard, OR 97281-3391; email: [email protected].
References
1. Frye GJ: A Perspective on digital hearing instruments. Hearing Review 1999; 6 (10): 61.
2. Heide J: Testing electroacoustic performance of ASP and nonlinear hearing aids. Hearing Jour 1987; 40 (4).