Just the Stats | December 2013 Hearing Review Products
Hearing Aid History in One Chart!
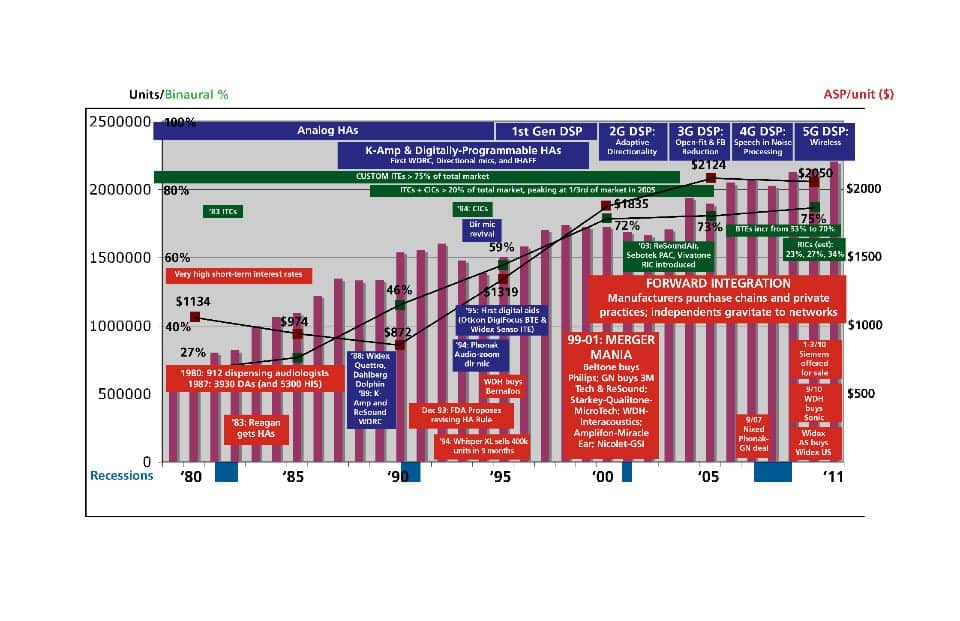
Okay, we know there is no way to summarize hearing aid history in one chart. Period. However, the graph shown here attempts to detail a number of important industry market parameters—from unit volumes to average sales prices and binaural market penetration—all in one place.
Key to Chart
Blue bars: IC development and functionality, as well as examples of breakthrough technologies.
Green bars: Instrument styles and usage.
Red bars: Significant industry events, highlights, and trends.
Background magenta bars: Private sector (non-VA) hearing aid sales (source: HIA).
Dollar values and red squares: Average sales prices (source: HR, HJ, and HI magazine surveys).
% Values and green squares: Binaural hearing aid penetration (source: HR and HI magazine surveys).
Bottom light blue bars: Official recessionary periods in United States.
Click on image to expand graphic.

Original citation for this article: Strom KE. Hearing aid history in one chart! Hearing Review Products. 2013;Winter:34.