Part 1: Gross revenues, staffing, and practice characteristics
During 2010, Phonak Hearing Systems commissioned Customer Care Measurement and Consulting, LLC, Alexandria, Va, to conduct a nationwide survey of dispensing professionals to establish basic industry metrics. Similar studies had been sponsored by Phonak in 2008 and 2009.
This benchmarking survey was designed to provide individual hearing practices with a tool they can use to compare their performance against industry standards. The industry benchmarks can be used as a basis for assessing and setting realistic, continuous, and fact-based improvement goals.
The information in this article was submitted by the Phonak market research department and adapted from the company’s publication Key Metrics of Hearing Practices: 2010 National Research Study, which reports on the independent survey results conducted by Customer Care Measurement & Consulting, Alexandria, Va. Correspondence can be addressed to HR or Phonak Senior Manager of Marketing Kimberly Rawn at .
Few hearing care practices have the means to conduct market research to define competitive performance norms that are statistically valid. Phonak’s ongoing national metrics research is designed to address this information need.
A Web-based survey methodology was utilized. Responses were collected in July 2010, and more than 400 hearing care professionals responded. About two-thirds (63%) of respondents were audiologists (38% AuD, 19% MS, and 6% PhD), and 44% were either hearing instrument specialists (38%) or audioprosthologists (6%). (Totals do not equal 100% due to multiple responses.) One-fifth (20%) of the practices indicated having both audiologists and hearing instrument specialists on staff.
Parts 1 and 2 of this article present the key findings. A worksheet and summary of the data are available for downloading at the end of this article.
TABLE 1. 2010 survey respondents’ type of hearing care practice.
To make best use of this report, compare your 2009 performance for the key metrics to that of the median and higher performance quintiles of hearing practices (20% groupings of practices). Identify those areas in which your practice does not currently achieve median or higher performance. These areas can become focal points for your improvement plan.
Part 1 of this article looks at some of the most important measures of a hearing care business, including gross revenues, staffing, and revenue per staff member. Part 2 will look at marketing, professional compensation issues, new patient sources, testing and fitting/service procedures, and other metrics.
Revenue and Characteristics by Practice Type
Professional staffing. The most common type of hearing care practice in the United States is a single full-time location, staffed by one hearing care professional (Table 1). (Unless otherwise noted, when the term “professional” is used in this report, the designation means a full-time licensed professional.) A total of 41% percent of practices are of this type, 19% have two or more professionals working at a single full-time location, and 28% have multiple full-time locations.
Gross revenues and revenue growth. The median hearing care practice earned gross revenues of $400,873 during 2009 (Table 2). The higher practice gross revenues reported by the top two quintiles can be explained by the higher revenue reported by the multi-full-time-unit and multi-professional practices (Figure 1 – see end of article for all figures).
Median practice gross revenue growth during 2009 was +5.5%. Larger practices tended to enjoy higher rates of growth during this period.

TABLE 2. Gross revenue by practice type/size.
Revenue, staffing, and office hours by practice type. For single full-time-location practices with one dispensing professional, median 2009 gross revenue was $300,000 (Table 2). Typically open 40 hours per week, the solo professional worked 2,000 hours annually (Table 3). The practices had median office space of 1,200 square feet, and they generally employed 2 non-hearing professional staff members.
TABLE 3. Practice characteristics by practice type/size.
Single full-time-location practices with two or more full-time professionals had median gross revenues of $650,000 during 2009—more than double the median of solo professional practices. These practices were also typically open 40 hours per week and had two full-time hearing professionals. The median square footage of these practices was 2,000. They usually employed 5 non-hearing professional staff members.
Multi-full-time-location practices had median gross revenues of $1 million. Most common are two full-time location practices, but the average number of locations is 3.9. Median square footage of these practices is 3,600, and the median number of non-hearing professional staff members in these practices is 8 workers.
Within each practice type, there is a considerable range of gross revenues reported (Table 4). For example, among solo professional practices, the largest third achieves a median gross revenue of $567,375—88% higher than the median for this type of practice. Multi-full-time-location practices in the top third of that practice type have median revenue of $2.4 million and account for nearly 41% of the total revenue of all of the practices that responded to the survey.
TABLE 4. Range in 2009 gross revenue by practice type/size.
Revenue per office location and per professional. The median gross revenue per full-time hearing location was $366,000 during 2009. Among multi-full-time-location practices, the median gross revenue per location was $394,444, while the median gross revenue for a solo professional working at one location was $300,000.
The median gross revenue earned per hearing professional was $308,096, and revenue reported per professional was highest in practices with multiple locations.
Non-professional staffing. For all hearing practice types and sizes, there is an average of 2.8 non-professional staff members per hearing professional. A similar average applies to solo professional/single full-time-location practices (an average of 2.7, as shown in Table 3), but single full-time-location/2+ professional practices employed an average of 2.3 non-professional staff members per professional. This suggests that staff is more efficiently deployed in single full-time-location/multi-professional practices (Table 3).
TABLE 5. Fees for hearing aids, per unit (product and services combined).
Sources of Revenue
In US dispensing practices during 2009, nearly three-quarters (74.9%) of revenue came from fitting hearing aids (Figure 2), compared to 79% in 2008. Diagnostic testing contributed more than 15% to gross revenue for the average practice. Source of revenue did not vary greatly by practice type or practice size. Practices in the largest quintile earned more than 40 times the hearing aid fitting revenue as those in the smallest quintile (Figure 3).
Hearing Aid Dispensing
Styles of hearing aids. Hearing care practices reported that an average of 21% of hearing aids dispensed during 2009 were in-the-ear (ITE) units, 40% were behind-the-ear (BTE) units, and 38% were receiver in the canal (RIC) units (Figure 4). Usage by instrument type did not vary significantly among practice types.
Pricing. Hearing professionals reported that an average of 42% of instruments sold had fitting fees (hearing aid and professional fees) of under $2,000, and an average of 58% over $2,000 (Table 5). The median cost of an aid dispensed by the surveyed practices is estimated to be $2,070. This is higher than reported for the median instrument revenue per unit dispensed, suggesting some over-statement of the usage of higher value products.
Number of hearing aids dispensed. Table 6 shows that all the practices surveyed dispensed a median of 225 instruments during 2009 (a median of 200 instruments per full-time location), compared to a median of 253 instruments in 2008. Single full-time-location/solo professional practices dispensed a median of 180 instruments.
TABLE 6. Number of hearing aids dispensed by practice type in 2009.
New vs repeat purchasers. An average of 63% of instruments dispensed are fit on patients new to the practice (Figure 5), compared to 59% in 2008. The new patient ratio does not vary significantly by practice type or with practice size. Professionals with higher ratios of new patients tended to be younger, at their current location for fewer years, and worked in smaller practices—all characteristics of newer practices.
Productivity Benchmarks
Gross revenue per professional hour. Gross revenue per professional hour is perhaps the most important productivity measure in hearing practices relative to the financial success/viability of a business. It reveals how effectively professionals use their time. It is calculated by dividing practice gross revenue by the total number of hours worked by all full-time and part-time hearing care professionals for any specified period.
TABLE 7. Gross revenue per professional hour by practice type.
The median 2009 gross revenue per professional hour for all practices is $144 (Table 7), compared to $180 in 2008. The most productive 20% of practices achieves hourly professional revenue of $374, more than twice the median (Figure 6). Although overall gross revenue per professional hour was lower in 2009 than in 2008, the most productive practices in 2009 performed better than the most productive practices in 2008 ($374 per hour in 2009 versus $363 per hour in 2008). The least productive 20% of practices gross just $24 per professional hour—83% lower than the median and 94% lower than the most productive 20% of practices.
As would be expected, revenue per professional hour is lowest in the smallest 20% of practices (Figure 7 and Table 8). However, these practices tend to be open fewer hours per week than larger practices; the smallest quartile of practices are open for a median of 32 hours per week versus all other practices, which are open a median of 40 hours per week.
TABLE 8. Practice characteristics by gross revenue per professional hour quintiles (see Fig 6).
Multi-full-time-location practices report the highest gross revenue per professional hour (Table 7). Professionals practicing in one full-time location produce somewhat less revenue per hour.
Not surprisingly, practices achieving the highest gross revenue per professional hour do so primarily by seeing more patients and dispensing more instruments each day (Table 8). High production practices also fit instruments with somewhat higher-than-average fitting fees.
Instruments dispensed per 8 hours of professional time. A metric highly correlated with revenue per professional hour is instruments dispensed per professional day. The median practice fits 0.61 hearing instruments per 8 hours of professional time (Figure 8). Productivity varies widely across practices. The most productive 20% of practices in 2009 fits 1.91 instruments per 8 hours, compared to 2008 when the most productive 20% fit a median of 1.44. The least productive 20% in 2009 fits just over one-tenth as many as the most productive.
Practices with a high ratio of units dispensed per professional day are successful in keeping their appointment calendars booked, unlike more typical practices that have considerable excess capacity. This is also demonstrated in Figure 9, which analyzes the same data by the practice gross revenue quintiles.
Gross revenue per non-professional staff member. The median hearing practice generates $123,375 gross revenue per non-hearing professional staff member (Table 9). The number of professionals in a practice does not seem to correlate much with median gross revenue per non-professional staff member. Gross revenues per non-professional staff member is not correlated with the number of these staff members that the practice employs (Figure 10).
TABLE 9. Gross revenues per non-professional staff member.
Gross revenue per instrument dispensed. The median practice gross revenue per instrument dispensed during 2009 was $1,886 (Figure 11), compared to a 2008 median of $1,625. This ratio is affected both by the fees charged for instruments and by the percent of practice revenue produced by instrument fittings.
Revenue per hearing aid dispensed (products and services). The median instrument revenue per unit dispensed in 2009 was $1,362 (Figure 12). The 20% of practices achieving the highest revenue per instrument realized a median of $2,552 per unit fitted, 87% higher than the overall median and 512% higher than practices in the lowest performance quintile.

Phonak 2010 Benchmarking Practice Performance Comparisons. Click on image to open pdf for download.
Increased revenue per unit can be attributable to both a greater usage ratio of high end technology, wider range of testing and services, and/or to higher mark-ups. The average wholesale price paid by practices in the top 20% of instrument revenue per unit dispensed was $1,029 compared to $900 for those in the bottom quintile. Practices realizing the most instrument revenue per unit achieved a median gross profit margin of 60% compared to an overall median of 55%.
Benchmarking Your Practice
To better gauge your business success, practice efficiencies, and staff production, and to identify strategies for new growth, a comparative benchmark study of critical success factors, or key performance indicators, is necessary. Benchmark studies allow for ongoing performance measurement, business decisions, and goal setting to be based on facts, rather than on unreliable and often misleading anecdotal information and subjective measurement.
This worksheet, called Practice Performance Comparisons (PDF), provides you with an opportunity to print out and fill in your own business metrics, for direct comparison of similar practice types and sizes.
For example, you can compare your practice’s hourly revenue production to the median for all hearing practices. Increasing hourly production is best done by thinking more strategically about the practice and implementing greater office efficiencies. More effective marketing is one strategy for increasing the number of new hearing instrument patients seen by the practice. Delegating non-revenue-producing administrative tasks to support personnel will free professional time to engage in marketing planning and patient outreach programs that will increase hourly revenue production. Hourly production can also be improved by increasing the ratio of higher-end technology instruments dispensed along with effective fee strategies.
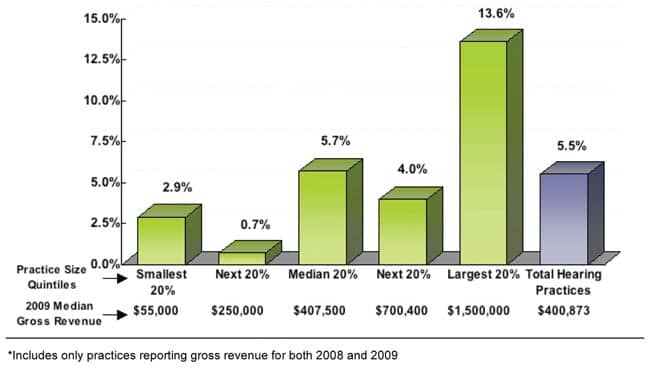
FIGURE 1. Gross revenue percentage change by practice size divided into quintiles (ie, five even groups).*

FIGURE 2. Source of gross revenues in 2009 for all practices in survey.

FIGURE 3. Revenues from hearing aid fitting by practice size quintiles.*

FIGURE 4. Types of hearing aids dispensed in 2009 for all practices in survey.

FIGURE 5. Percentage of new patients by performance quintiles relative to new patients in 2009.

FIGURE 6. Gross revenue per professional hour by performance quintiles, 2009.

FIGURE 7. Gross revenue per professional hour by practice size (re: 2009 revenue).

FIGURE 8. Hearing aids dispensed per 8 professional hours, in 2009 performance quintiles.

FIGURE 9. Hearing instruments dispensed per 8 professional hours by practice size relative to 2009 gross revenues.

FIGURE 10. Gross revenue per non-professional employee by number of staff members, 2009.

FIGURE 11. Practice gross revenue per hearing instrument dispensed, by performance quintiles.

FIGURE 12. Revenue per unit dispensed in performance quintiles.
Citation for this article:
Phonak Market Research. A survey of key metrics for benchmarking a hearing practice. Hearing Review. 2011;18(6):24-34.