7/21/06
According to Hearing Industries Association (HIA) statistics, net hearing aid sales in the US totaled 1.18 million in the first half of 2006. When comparing the total first-half unit volumes with those from 2005, there were 85,559 more hearing aids sold—a 7.8% increase.
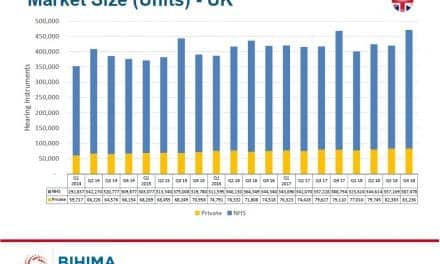
From April through June, unit volumes increased by 5.1% compared to the same period last year. Although this is less than the double-digit gain (10.7%) experienced in the first quarter of 2006, it still represents good news as sales figures have now been in the positive territory for three full years (ie, since the second quarter of 2003). Private sector sales–which made up 87% of the units dispensed by companies reporting to HIA in the first half–increased by 5.9%, while sales from the Department of Veterans Affairs (VA) continued to be flat at 0.3%.
These latest HIA statistics represent more good news for an industry that has been experiencing a steady, albeit slow, expansion of its sales. For example, since 1998, the hearing instrument market has experienced only two years (2003-2004) in which year-on-year sales approached or exceeded 5%. For more details, see Figure 2 of the article, "Rapid Product Changes Mark the New Mature Digital Market."
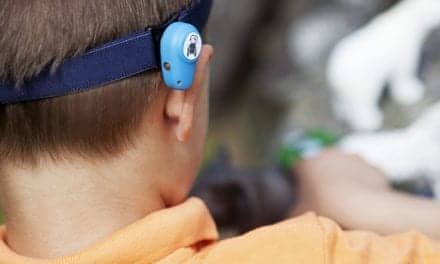
The new HIA figures also suggest that an astonishing 42.8% of the hearing aids dispensed by the private sector were behind-the-ear (BTE) type aids, reflecting the rapid acceptance of open-ear fitting technology. For reference, until 2 years ago, BTEs constituted only 19-23% of the market during the last decade. For details on the open-fitting trend, see David Fabry’s article, "Facts vs Myths: The Skinny on Slim-Tube Open Fittings".
How Did Your State Do?
Only one state (Maine, -17%) had sales that decreased by more than 5%, while 16 states experienced sales increases of 10% or more. When looking at hearing aid sales by state sales in the first half, the South and Southeast regions of the US appeared to be exceptionally strong, with Virginia, North Carolina, South Carolina, Tennessee, and Florida, as well as Texas, Oklahoma, and Texas, posting sales increases of more than 10%. Additional states that had sales increases of 10% or more included Colorado, Nevada, and Arizona in the Southeast; Minnesota, North Dakota, and Kansas in the Midwest; and the states of Washington and New Jersey.
State-by-State Hearing Instrument Sales Increases/Decreases, First Half of 2006
State % Change
Alabama 2.32
Alaska -2.16
Arizona 16.08
Arkansas 36.41
California 9.61
Colorado 12.45
Connecticut 8.72
Delaware 2.23
District of Columbia 1.48
Florida 10.29
Georgia 3.65
Hawaii 2.39
Idaho 9.33
Illinois 8.59
Indiana 4.32
Iowa 9.06
Kansas 11.95
Kentucky 2.55
Louisiana 9.82
Maine -16.92
Maryland -2.23
Massachusetts -0.29
Michigan 4.02
Minnesota 18.32
Mississippi 9.26
Missouri 8.57
Montana -0.69
Nebraska 5.62
Nevada 20.01
New Hampshire 19.72
New Jersey 5.94
New Mexico 8.81
New York 7.32
North Carolina 14.51
North Dakota 10.19
Ohio 9.11
Oklahoma 13.2
Oregon 6
Pennsylvania 3.78
Rhode Island -2.19
South Carolina 13.85
South Dakota 8.68
Tennessee 11.48
Texas 15.41
Utah 26.1
Vermont -1.18
Virginia 11.61
Washington 10.59
West Virginia 4.68
Wisconsin 9.2
Wyoming 4.33
Source: HIA