Innovation and marketing are keys to the 2005-2006 marketplace

Ten years ago if a company came out with a new faceplate it was big news. Today, you practically need a paradigm shift in the physical and/or electronic composition of the device to make waves. If one looks at the three preceding articles about the use of virtual reality in fitting rooms, or the January HR issue dedicated to the integration of wireless technology in hearing aids, or had a chance to peruse the AAA convention floor in April, it is immediately apparent how fast technology is changing in the hearing industry.
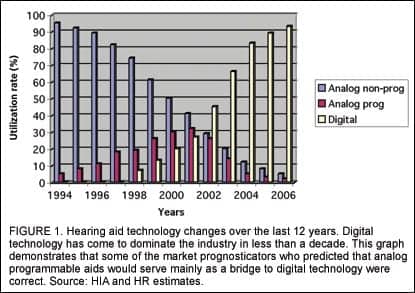
These changes are, at least in part, due to the maturity of the new digital signal processing (DSP) marketplace, which has become larger and increasingly stratified into premium, mid-level, and economy offerings—as well as points in between and sub-categories like power and open-fit hearing aids. In 2005, DSP technology appeared to be approaching its market saturation point at around 90% (Figure 1), a decade after the technology was first made widely available. DSP market penetration during the first quarter of 2006 was 90.4%, up from 86.0% in the first quarter of 2005, according to statistics compiled by the Hearing Industries Association (HIA).1
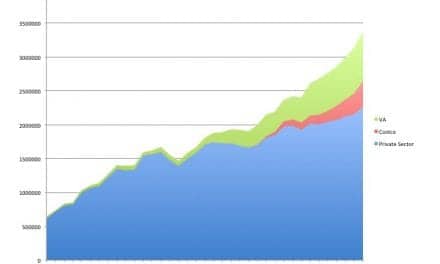
However, considering the sizable technological advancements that digital hearing aids represented, the effects of digital technology on unit volumes are less apparent. If you knew nothing about the hearing industry and looked at the net unit sales shown in Figure 2, you might guess that only minor, incremental technology and performance changes occurred during the last 12 years. The industry has not received a large “digital bump” in sales.
Some have argued that, when looking at the industry from a technical (selection and fitting) standpoint, the advent of programmable wide dynamic range compression (WDRC) technology was more important than digital technology. With the maturation of the digital market, however, far more features and “patient friendly” technologies have been implemented into digital aids. While it may be arguable how well the new advanced digital hearing aids are being fitted across the entire user population,2 few serious questions are raised about whether the digital aids offered today are superior to the analog programmable aids of 10 years ago.
Analog programmable instruments made up a relatively small part of the market from the late-80s until the introduction of DSP (Figure 1). Before 1994, programmable hearing aids constituted less than 5% of the market, and they never constituted more than one-third of the market, proving correct some industry analysts who suggested in the late-90s that this technology was only a bridge until DSP products were developed. In some ways, digital aids brought compression-type instruments to mainstream dispensing offices by fiat; the instant consumer appeal of “digital”—a consumer buzzword for “high-tech”—was impossible to ignore.

Dispensing Activity in 2006
Hearing instrument net unit sales increased by 10.7% from January-March 2006 compared to the same period last year, after the market realized an annual unit gain of only 2.53% in 2005, according to HIA statistics.1 Private sector gains—meaning those units dispensed that were not part of the Department of Veterans Affairs (VA)—were even stronger at 12.7%. (VA net unit dispensing activity declined by-1.4%.)
The first-quarter’s double-digit increase is welcomed news for some manufacturers and dispensing professionals who have experienced belt-tightening and hand-wringing on a scale that hasn’t been seen in awhile. Prior to the first quarter of 2006, the hearing instrument market had not witnessed quarterly net unit volume gains exceeding 5% since the first half of 2004, and the incremental unit gains that were experienced during 2005 were disproportionately consumed by a few select companies on the manufacturer side, and by the larger corporate retail networks on the dispensing side of the business, according to HR market estimates.
The last 2 years may have been roughest on the smaller players, manufacturers and dispensers alike. For example, preliminary data from the 2006 HR Dispenser Survey (published in June) show a tightening of gross revenues for a larger-than-usual percentage of dispensing professionals’ offices, and fewer office owners are predicting large gains in both revenue and profits for 2006. Meanwhile, the costs associated with products, staffing, and other operational costs have continued to rise and, by comparison, are outpacing revenues in terms of percentage change.
This would suggest that efficiency issues are going to be a larger issue than ever for dispensing professionals in 2006, particularly for those businesses that dispense a smaller-than-average number of units (eg, the 30% of offices/practices that dispense fewer than 15 units/month3).
Slight Increase in Units Dispensed
Companies reporting their US net sales figures to HIA in 2005 (estimated to be 90-95% of the US hearing aid market) distributed a total of 2.10 million units, for an increase of only 2.5% over 2004 sales figures.1 However, this paints a slightly gloomier picture than reality. Private sector dispensing experienced a unit volume increase of 4.0%, while the VA, which constituted 13.6% of the market, witnessed a net unit decrease of 6.2%. During the past 2 years, private sector sales have risen by 6.8% in 2004 and 4.0% in 2005, following a period of flat unit sales in the 5 years from 1998 to 2003 (0% to 2.6%), as shown by the yellow bars in Figure 3.
Over 1 million served—but not many more. The gradual increase in binaural fittings during the last two decades has been of great benefit to the hearing industry and dispensing professionals, and binaural fittings have become widely accepted as the choice for the majority of people who have bilateral hearing impairments.4 Binaural fittings are also responsible for much of the unit gains witnessed during the last 15 years. The red bars in Figure 3 represent the number of individual clients/patients who purchased hearing aids each year 1979-2005 from private practices/offices (eg, does not include VA) contrasted with the number of units dispensed in that year. The data are based on dispenser surveys from Hearing Instruments (1979-1993), The Hearing Review (1994-2005), and HIA yearly sales figures. The monaural/binaural ratio for 2005 is assumed to be the same as 2004.
Figure 3 suggests that the annual number of hearing aid purchasers who obtained their devices from the private sector rose from less than a half-million (489,000 people) in 1979 to more than double that amount (1.06 million people) in 1990. However, the number of people purchasing hearing aids leveled off drastically after 1990. Remarkably, there were only 30,600 fewer people who purchased a hearing aid in 1987 compared to those who purchased a hearing aid 16 years later in 2003, a 3% difference. During that same period, hearing instrument unit sales in the private sector increased by 363,000 units (27%)—far from dazzling, but significantly better than 3%. In the 13 years from 1991 to 2003, the number of people each year who visited an office/practice and purchased a hearing aid never varied by more than 190,000. Only during the last 2 years have these numbers experienced an upturn. An estimated 1.10 million people purchased a hearing aid in 2005.
The obvious explanation for why hearing aid unit volumes continue to increase while the volume of people served in the private sector remains essentially static is that the monaural-to-binaural fitting ratio has literally flip-flopped during the last 25+ years. Binaural aids constituted 27% of all patient fittings in 1979, but make up 73% of the fittings today. Further, we are now at a point where the binaural fitting rate is reaching its upper limits, making any further market expansion truly a function of fitting more people with hearing aids.
However, more puzzling is how there can be such limited growth in the numbers of people visiting private sector offices when the population of hearing-impaired people keeps getting larger. This question will be examined in relation to other studies, as well as the hearing aid distribution system, in an upcoming issue of The Hearing Review.

Changing Styles
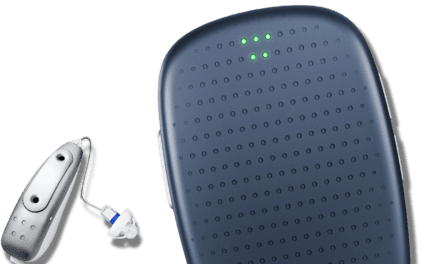
Perhaps the biggest story in 2005-2006 is the renaissance in behind-the-ear (BTE) hearing aids and the popularity of open-fit devices. In the first quarter of 2006, BTE fittings constituted a whopping 42.0% of the market, after consistently making up only one-fifth (18.1-19.05%) of all the hearing aids dispensed during the 1980s and 1990s.1 Starting in 1999, BTE percentages started drifting upward very gradually by about 0.5%-1% annually. This is probably due to the increasing use of directional hearing instruments, which arguably favor the BTE design, as well as the entrance of the Sebotek PAC device in 2003. Combined with these factors, the advent of open-fitting hearing aids precipitated a large increase in BTE usage in 2004 (to 26.4% of the market) and an even larger increase in 2005 (to 32.6%).
Table 1 suggests that the surging popularity of BTEs appears to come at the expense of ITEs, which fell by more than 5 percentage points last year, from 39.4% of the market in 2004 to 34.3% in 2005. CICs and ITCs fell by about 2 percentage points each. (Also see Figure 2 in David Fabry’s article on p 22 for a look at BTE versus custom ITE market share.)
Open-fit devices. HIA recently conducted a special survey5 in which companies reported that 12% of their BTEs used batteries that were smaller than Sizes 675 and 13, applications that would most likely be indicative of the smaller open-fit BTEs (eg, one might view this as the maximum market penetration of open fittings). Preliminary numbers from the 2006 HR Dispenser Survey (to be published in June) suggest that open fittings account for 14% of the BTE fittings in hearing instrument specialists’ (HIS) offices and as much as one-third of BTE fittings in dispensing audiologists’ (DA) offices.
Whatever the actual market share, open fittings have become a significant portion of the market in a very short period of time. And there is little doubt that this product category will continue to grow during 2006 and beyond.
Directional systems and telecoils. The HIA’s recent supplemental survey5 also asked reporting members about directional microphone and telecoil use. The results indicate that 35.2% of all hearing aids sold in 2005 contained directional systems, and almost half (47%) of all BTEs utilize them. As might be expected, directional microphone utilization rates in ITEs were about half that of BTEs. Only 18.9% of full-shell ITEs, 18.3% of half-shell ITEs, 17.8% of ITCs contained directional systems. These percentages are consistent with the 2005 HR Dispenser Survey which reported an overall market penetration of 36% for directional aids (DA 48%; HIS 24%).3
Telecoils are used in 45.2% of all hearing instrument fittings, according to the special HIA survey,5 with 58.3% of all BTEs containing these devices. With the exception of CICs (1.1% usage rate), which are generally too small to utilize telecoils, about 1 in 7 ITEs contain telecoils: full-shell ITE (14.5%), half-shell ITE (12.7%), and ITC (13.4%). The 2005 HR dispenser survey showed that telecoils were used in 39% of all hearing aids (DA 43%; HIS 35%).
Returns Return to “Normal”
After a two-year hiatus, return-for-credit rates returned to their historically normal levels of 16-20%. In 2005, a total of 17.04% of all hearing aids were returned for credit to the manufacturer for reasons of patient rejection or replacement/exchange for another hearing aid. Prior to that, reported return rates had fallen to 12.4% in 2004, and 13.7% in the fourth quarter of 2003, offering hope that this industry bugbear had finally been harnessed.
No such luck. Digital return for credit rates returned to 17.4% in 2005, a level that is better than the 25% rates experienced in the mid-90s when digital aids were first introduced but considerably higher than last year (which may have been more of a statistical artifact than reality). The overall return rate was 17.0%.
Revenues and Hearing Aid Pricing
| Table 1. Trends in Hearing Aid Styles in 2005 | |||
| Percentage of US net units dispensed by hearing aid style and technology type in 2005 (2004). | |||
| Analog | DSP | All 2005 (2004) | |
| BTE | 3.72% | 28.92% | 32.64% (26.41%) |
| CIC | 0.85% | 11.12% | 11.97% (14.27%) |
| ITC | 1.52% | 16.70% | 18.22% (19.91%) |
| ITE | 4.83% | 32.34% | 37.17% (39.41%) |
| Total % | 10.92 (16.89) | 89.08 (83.02) | 100.00% |
HR has offered estimations of the US retail dollar value of hearing instruments for several years as a rough gauge of dispensing activity. The estimations are drawn from HIA statistics1 on the instrument technologies and styles sold, as reported by manufacturers, and the average prices of these products as reported by dispensing professionals in the annual HR Dispenser Survey.3 However, with the dominance of digital hearing aids and the stratification of this technology type into very loosely defined categories (eg, premium, mid-level, and economy offerings), this task has proven to be dicey at best. Relatively small changes in the dispensing of a particular category of DSP aids (eg, economy-level instruments) can yield substantial changes to final sales figures and average prices. And, because there presently are no real definitions for these categories, dispensing professionals are essentially left to decide for themselves what constitutes a premium, mid-level, or economy digital aid. Additionally, with the market changing rapidly, exact product mixes and pricing are likely to be moving targets.
Acknowledging these caveats, dispensing professionals reported in the 2005 Dispenser Survey that, of their digital product offerings, 31% were from premium lines, 44% were from mid-level lines, and 25% were from economy lines (compared to 28%, 40%, and 20% from the previous year). When these are applied to pricing and HIA figures, one comes up with a retail dollar value of $3.65 billion for private sector dispensing offices. This would equate to approximately $332,000 in gross revenues per dispensing office/practice, and an average hearing aid price of $1,923 for aids obtained from a (non-VA) private practice or dispensing office. This represents a $39 (2.0%) decrease from the $1,962 average price reported in 2004.
When looking at both private sector and VA dispensing activity, the total retail dollar value of the market is estimated by HR to be $3.76 billion, a 4% increase over the 2004 estimated total market value of $3.71 billion. The average price of hearing aids from all distribution sources is estimated at $1708.
(Editor’s Note: Pricing figures do not consider free hearing aids or take into account pricing differences for discounted and third-party hearing aids. Additionally, considerable variances may exist in these estimations due to the predominant practice of “bundling” testing and service fees within hearing instrument prices. The prices are offered here only as a useful gauge for the actual dollar volume of the US market.)
Although one can certainly argue about the exact values of the dollar amounts presented here, if the above figures are used as intended (eg, as a rough gauge of pricing and revenues), one thing seems clear: gross revenues are getting tighter (at least) at the dispenser level, and pricing pressures are beginning to exert themselves on the market due to the popularity and wider offerings in the mid- and economy-level digital segments. In recent years, the retail dollar value of the hearing instrument market has climbed at an exceptional pace—in some years as high as 12-15%—due to consumers’ rapid acceptance of the higher-priced digital technology (Figure 1).
What is now emerging is a more mature digital market that is largely driven by innovative new product offerings at the top, and quality hearing aids that contain an often-surprising number of advanced features on the bottom. Further, product lines are increasingly being introduced to compete at specific price points and particular niche segments, as opposed to the traditional system of a premium product becoming relegated to the mid-level product category, etc, as it gets older.
All of this is certainly good for the consumer, and it presents a new and more challenging business environment for dispensing professionals and manufacturers alike.
Acknowlegements
The editor thanks Dick Green, assistant professor at the University of Minnesota Duluth, for assistance in the preparation of statistics in this article.
References
1. Hearing Industries Assn. HIA Statistical Reporting Program, Fourth Quarter 2006. Alexandria, Va; March 2006.
2. McSpaden JB. Ethics, accountability, and patient-driven hearing care practices. The Hearing Review. 2005;12(5): 34-37,80.
3. Strom KE. The HR 2005 dispenser survey. The Hearing Review. 2005; 12(6):18-36,72.
4. Symposium reviews 25 years of binaural hearing research. The Hearing Review. 2006;13(2):19.
5. Hearing Industries Assn. Supplemental survey on open-fittings, directional microphones, and telecoils. Alexandria, Va; February 2006.
6. Kochkin S. MarkeTrak VII: Hearing loss population tops 31 million people. The Hearing Review. 2005;12(7):16-29.
Karl E. Strom is editor-in-chief of The Hearing Review. Correspondence can be addressed to: Karl Strom, Hearing Review, 4131 E Superior St, Duluth, MN 55804; e-mail: [email protected].