Tech Topic | August 2021 Hearing Review
A study using the MUSHRA protocol comparing Oticon More™ to two other premium hearing aids, combined with a recent UBS Evidence Lab report, suggests Oticon More offers top sound quality—a key element in customer satisfaction.
By Douglas L. Beck, AuD; Danielle Tryanski, AuD; and Brian Kai Loong Man, MSc
Pirsig1 wrote Zen and the Art of Motorcycle Maintenance in 1974. The book quickly became an international best seller selling over 5 million copies globally. In many respects, the book is about quality: quality of life, quality of relationships, quality of understanding, and more. Pirsig notes the early Greeks used the same word for “quality” and “truth.” He states:
“If you can’t say what quality is…how do you know…it even exists? Further, if no one knows what it is, then for all practical purposes it doesn’t exist…But for all practical purposes it really does exist.”1
Quality is inherently subjective and is challenging to define as each of us has our own likes, dislikes, perspectives, and values. Regarding hearing aids, sound quality is of paramount importance as one typically wears their devices from the moment they wake-up until they go to sleep. From private conversations to lively party chatter to the melody and rhythm of music, most sounds a hearing aid wearer experiences are processed by the hearing aids. Carr2 reported MarkeTrak 10 underscored sound quality as a significant contributor to overall satisfaction, and 92% of hearing aid users are satisfied with their hearing aids.
Measurement Options
Knowing and measuring which aspects of sound are most representative of sound quality is challenging. Narendran and Humes3 reported eight dimensions of sound quality—softness, brightness, clarity, fullness, nearness, loudness, spaciousness, and total impression—as factors assessed in the Judgments of Sound Quality Test. Kochkin4 reported sound quality is strongly related to hearing aid satisfaction and is a pivotal factor in acceptance or rejection of hearing aids. Of the top-10 strongest factors which influence hearing aid user satisfaction, Kochkin reported 5 are related to some aspect of sound quality: sound clarity, naturalness, richness/fidelity, loud-sound comfort, and own voice.
Sockalingham et al5 reported that professionals might measure speech or musical quality from their own perspective. For example, psychologists may focus on the emotional aspects of sound, engineers and physicists may focus on attributes such as amplitude, phase, and spectral components, musicians may focus on timbre and resonance, and hearing care professionals may focus on audibility, most comfortable listening levels, listening effort, speech in noise ability and more. However, for the end-user, sound quality is based on their own experience, expectations, and personal preferences.
To address quality in hearing aids, questionnaires, interviews, and rating scales are most-often used to reflect and better understand the end-users’ listening experience. The UBS Evidence Lab recently issued its new report on March 30, 2021.6 This report is based on the responses of some 500 healthcare professionals (approximately 85% audiologists, 15% dispensers) who each perform 20-25 fittings per month. With regard to hearing aid sound quality, the authors reported Oticon More™ was rated highest. Additionally, Oticon More (released January 2021) was seen as the most attractive product.
The Multiple Stimuli with Hidden Reference and Anchor (MUSHRA)
In 2015, the International Telecommunications Union (ITU)7 described the Multiple Stimuli with Hidden Reference and Anchor (MUSHRA) protocol to evaluate and compare the quality of an audio signal. In the MUSHRA protocol, listeners are presented with multiple sound stimuli, including a reference, a test stimuli, and an anchor stimuli. The stimuli are presented randomly, and the listener does not know if they are listening to the reference, the test stimuli, or the anchor. The listener’s task is to listen to each of the sound recordings and rate each on a scale of 0 (poor) to 100 (excellent).
Glista et al8 examined sound quality ratings based on frequency lowering via adaptive non-linear frequency compression and non-linear frequency compression. They demonstrated that the MUSHRA protocol offered high reliability when used with adults and children with normal hearing and with hearing impairment.
MUSHRA and Oticon More
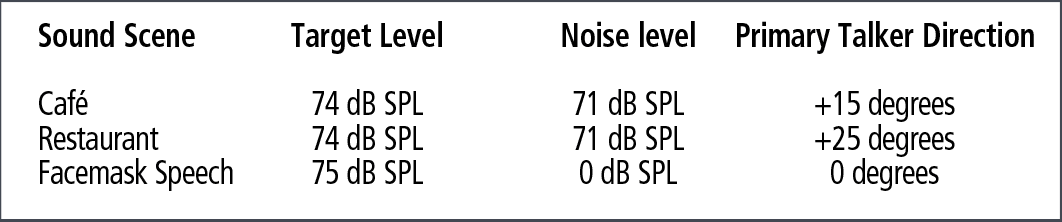
The MUSHRA protocol was adapted to be used on hearing aid wearers, taking inspiration from Sanchez-Lopez et al9 and Simonsen and Legarth.10 This modified paradigm was used to assess the perceived sound quality of Oticon More compared to two other premium competitor hearing aids, referred here as Competitor A and B. Test participants listened to high-quality recordings of three different sound scenes (cafe, restaurant, and facemask speech) recorded via a head-and-torso simulator (HATS) mannequin fitted with the three different test hearing aids. The cafe and restaurant scenes were captured using sophisticated recordings which involved a 29-loudspeaker array to realistically reconstruct the acoustic environments. The facemask speech involved a single loudspeaker/talker in the front (0° azimuth), with speech filtered by a surgical mask. A brief description of the properties of each sound scene is presented in Table 1.
As noted above, three test hearing aids were evaluated per the guidelines of ITU-1534-1 (2015).7 However, as there is no “golden” reference or “ideal” condition when it comes to hearing loss and hearing aids, and in accordance with Sanchez-Lopez et al9 and Simonsen and Legarth,10 the reference condition was discarded and the hidden anchor was maintained. The hidden anchor is critical to the MUSHRA paradigm, as it serves as the “worst sound quality” condition. By occupying the “worst spot,” it forces listeners to use the whole scale when rating the hearing devices of interest. In this particular case, the anchor was created by applying a distortion algorithm to the recording and subsequently filtering with a low-pass filter set to 7 kHz. Of note, the listeners/subjects were blinded to the presence of an anchor, and therefore believed there were 4 hearing aids in the test.
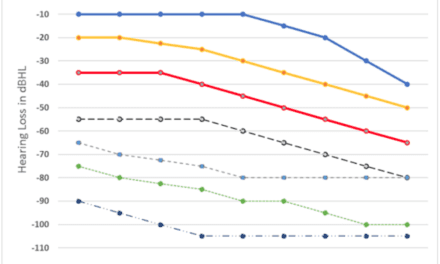
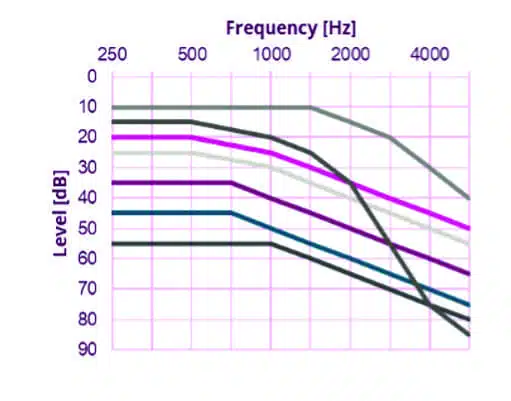
Hearing aids were inputted with the standard audiograms from Bisgaard et al.11 Additionally, intermediate audiometric configurations (defined as the mid-point between two standard adjacent audiograms) were created to allow more flexibility to better compensate for audibility. The range of audiograms used are shown in Figure 1.

Each of the three test hearing aids were programmed to “first-fit,” and each was set to 100% adaptation level to best simulate the listening experience a user would have from a typical clinic fitting. Closed fittings (sealed ear canals) were used to assure the listeners evaluated the quality of the sound produced from the hearing aids.
A total of 22 presbycusic subjects were recruited to take part in the study. Listeners were instructed to listen to the recordings through high-fidelity headphones and rate each of the audio systems (hearing aids) on a scale of 0 (worst) to 100 (best) for each sound scene; the protocol was repeated 3 times. The listeners used a computer mouse to click into each test hearing aid sound sample and rate the overall sound quality for each sound scene (cafe, restaurant, face mask). Subjects were allowed to switch/compare hearing aids as frequently as desired. The order of the experimental conditions was randomized, resulting in a double-blinded test.
Results
Data analysis was achieved in two ways: the first was to determine which model of hearing aid was rated significantly better; the second was to determine how often this hearing aid model was preferred.
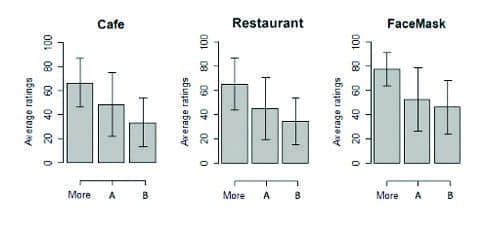
Oticon More was rated significantly better than competitors. General linear mixed effects models were fitted to the data of each individual scene to determine what effect the specific hearing aid had on the ratings. The model revealed a significant effect of hearing aids (p<0.05). A post-hoc Tukey’s honest significant differences test12 was completed to evaluate the pairwise differences across hearing aids with a significance level of 0.05 (p<0.05). The pairwise comparisons are displayed in Figure 2. Each bar plot displays the average ratings and standard deviations of a given hearing aid in each sound scene. All comparisons demonstrate a significant difference. Oticon More was rated significantly better than the other two competitors. The only non-significant difference was between Competitors A and B for the facemask scene.
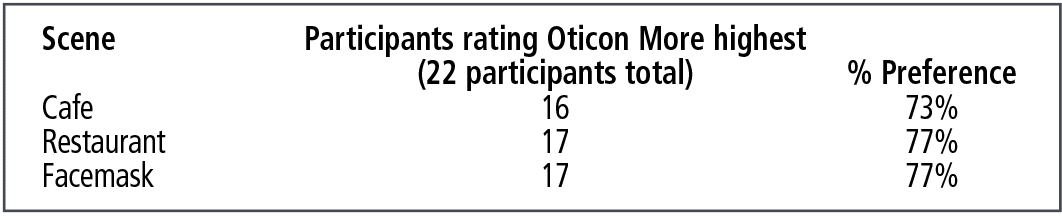
Listeners rated Oticon More to be significantly better than the two tested premium competitors across all the sound scenes. The percentage preference for Oticon More over its competitors is calculated in Table 2. This was carried out by extracting the number of participants (n = 22) that rated Oticon More as the highest in sound quality. On average—about 8 out of 10 participants—preferred Oticon More.
Discussion
Sound quality is a difficult concept to measure. In the final analysis, sound quality is a subjective measure of a difficult-to-define perception. Nonetheless, many reports define sound quality by engaging multiple concepts, factors, and dimensions, such as softness, brightness, clarity, fullness, nearness, loudness, spaciousness and total impression, naturalness, richness/fidelity, loud-sound comfort, and own voice. With specific regard to hearing aids, the perceived sound quality is pivotal to hearing aid satisfaction and a successful hearing aid experience. Although measurements of sound quality are difficult to quantify, assessment techniques (ie, MUSHRA) and large surveys (UBS Labs) suggest that Oticon More has been evaluated as having exceptionally high—if not the highest—sound quality, which very likely leads to more satisfied hearing aid wearers.
References
- Pirsig, RM. Zen and the Art of Motorcycle Maintenance. 1st ed. Bantam Books; 1974.
- Carr K, Mueller G. 20Q: Consumer Insights on Hearing Aids, PSAPs, OTC Devices, and more from MarkeTrak 10. AudiologyOnline. https://www.audiologyonline.com/articles/20q-understanding-today-s-consumers-26648. Published March 16, 2020.
- Narendran MM, Humes LE. Reliability and validity of judgments of sound quality in elderly hearing aid wearers. Ear Hear. 2003 Feb;24(1):4-11.
- Kochkin S. MarkeTrak VIII: Consumer satisfaction with hearing aids is slowly increasing. Hear Jour. 2010;63(1):19-32.
- Sockalingham R, Beilin J, Beck DL. Sound quality considerations of hearing instruments. Hearing Review. 2009;16(3):22-28.
- UBS Evidence Lab website. US Audiologist Satisfaction with Hearing Aids Physician Survey [Start Date: Sept 27, 2016; End Date Feb 19, 2021]. https://www.ubs.com/evidencelab-store/us-audiologist-satisfaction-with-hearing-aids-survey.html.
- International Telecommunication Union website. Recommendation ITU-R BS.1534-3: Method for the subjective assessment of intermediate quality levels of coding systems. https://www.itu.int/rec/R-REC-BS.1534/en. Published October 2015.
- Glista D, Hawkins M, Vaisberg JM, Pourmand N, Parsa V, Scollie S. Sound quality effects of an adaptive nonlinear frequency compression processor with normal-hearing and hearing-impaired listeners. J Am Acad Audiol. 2019;30(7):552-563.
- Sanchez-Lopez R, Fereczkowski M, Santurette S, Dau T, Neher T. Towards auditory profile-based hearing-aid fitting: Fitting rationale and pilot evaluation. Audiol Res. 2021;11(1):10-21.
- Simonsen CS, Legarth SV. A procedure for sound quality evaluation of hearing aids. Hearing Review. 2010;17(13):32-37.
- Bisgaard N, Vlaming MSMG, Dahlquist M. Standard audiograms for the IEC 60118-15 measurement procedure. Trends Amplif. 2010;14(2):113–120.
- Tukey JW. Comparing individual means in the analysis of variance. Biometrics. 1949;5(2):99-114.

Correspondence to Dr Beck at: [email protected].
Citation for this article: Beck D, Tryanski D, Man BKL. Sound quality and hearing aids. Hearing Review. 2021;28(8):30-31.