A review and regional sales analysis of the 2006-2007 hearing care market
Entering its fifth year of consecutive positive sales, the hearing industry has been on a roll, with new classes of products like open-canal and receiver-in-the-ear (RITE) BTEs, high-fidelity broadband and binaural integration devicees, and new adaptive directionality systems coming into the marketplace. Additionally, with the exception of premium products, the prices for most classes and styles of hearing aids have been static or going down in the last 2 years.1
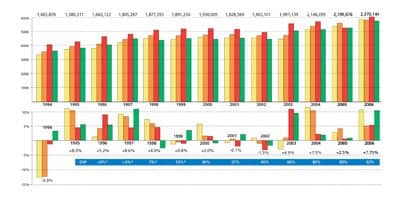
According to statistics generated by the Hearing Industries Association (HIA),2 hearing aid sales in the United States have followed something of an up-and-down pattern of positive growth during the last 4 years (Figure 1). In 2006, hearing instrument net unit volume sales increased by 7.8% to 2.37 million units, following a modest increase of 2.5% in 2005, a strong year of 7.5% growth in 2004, and a smaller increase of 4.9% in 2003. Perhaps the best news is that this makes 4 years of fairly solid growth; prior to 2003, the industry experienced 4 years of very flat (-1.3% to 2.0%) sales. Another reason to look on the bright side is that hearing aid sales have exceeded a half-million units in every quarter for three and a half years.

|
| FIGURE 1. Quarterly US hearing aid net unit sales (top) and percentage gains/losses for each quarter and year (bottom). Total net sales for each year are shown at the top of the figure, and the blue bar on the bottom represents market penetration of digital aids for each year. Source: HIA and HR estimates. |
Private sector 2006 sales rise by 8.1%. Private practice dispensing activity looks even rosier next to the overall industry statistics. Last year, hearing instrument units dispensed by the private sector rose by 8.1% to 2.05 million units (87.7% of the market), following increases of 4.0% in 2005, and 6.8% in 2004.
VA hearing instrument dispensing activity rose by 5.5% in 2006 to 316,382 units, or 13.3% of the market. Always an innovator and bellwether for the dispensing field, the VA initiated a new series of national contracts with manufacturers in 2006 that includes cochlear implants and assistive devices (TV amplifiers, FM, amplified telephones, TTY/VCO, etc). The VA maintains 157 audiology health care clinics, employing 630 audiologists and 134 health care technicians, as well as other personnel in audiology and speech-language pathology.
Sales flat in first quarter of 2007. First-quarter sales of hearing instruments this year increased by only 1.1% to 593,860 units, with VA sales increasing by 8.8% and private sector sales actually decreasing slightly by 0.1%. But the numbers are certainly nothing to panic over. Last year’s strong first quarter—a 10.7% overall increase with a 12.7% increase in the private sector—is largely to blame. However, if one looks at the up-and-down nature of the last 4 years of positive industry growth, the safe bet would be to lay odds on a more modest growth rate (2% to 5%) for 2007 sales.
Regional Hearing Aid Sales
Not all areas of the United States fared equally in 2006 (Table 1), according to HIA statistics.2 Generally speaking, the southern and western states experienced better-than-average sales, and this can be seen as a more general trend over the past 10 years of hearing aid sales—perhaps bolstered by the faster-growing populations of these Sunbelt areas.

|
| TABLE 1. Percentage change of hearing instrument unit volume by state and region compared to 1, 3, 5, and 10 years ago in private sector dispensing (ie, does not include VA dispensing). Units not allocated to a state in the HIA statistics are not included in this analysis; 1-year figures are calendar year 2006. Source: HIA. |
Sales in 2006. Referring to Table 1, the regions with the greatest hearing aid unit gains during 2006 were the South Central and Southwest regions, with 16.1% and 10.1% increases in unit volume, respectively. The Midwest (9.4%), South Atlantic (9.1%), and Pacific Northwest (8.5%) experienced unit volume increases that were slightly higher than the national average of 8.0% in this analysis, while the East South Central (6.0%), Mid-Atlantic (4.6%), New England (4.5%), and Great Lakes (3.9%) regions posted more modest unit volume increases.

|
| FIGURE 2. Hearing aid unit sales (1996-2006) divided into nine regions. The South Atlantic, Great Lakes, Southwest, and Mid-Atlantic regions dispensed between 250,000-365,000 hearing aids each in 2006, while the Pacific Northwest, South Central, and North Central regions dispensed between 179,000-192,000 units each. The two smallest regions, relative to units dispensed, were New England and the East South Central states (108,000 and 101,000 units, respectively). |
No region experienced negative sales growth in 2006; in fact, only three states (Maine, Delaware, and Alaska) and the District of Columbia saw hearing aid sales decrease by more than 1% last year.
Long-term sales growth. When looking at 3-year, 5-year, and 10-year hearing instrument sales statistics for the nine regions, it’s the southern and western states that clearly come out on top. Leading all regions in 10-year growth are the East South Central (50.5% hearing aid unit volume growth), South Central (49.4%), Pacific Northwest (45.1%), and Southwest (38.6%). Due to Florida’s surprisingly low growth in sales during the last decade (15.7%), the South Atlantic region has a 10-year growth rate that roughly parallels the US average of 31.1%; however, without Florida, these states have a growth rate that equals the South Central region (49.4%).
The New England (28.6%), Great Lakes (24.4%), and Midwest/North Central (22.5%) regions have 10-year growth rates that are lower than the nation’s 31.1%. The Mid-Atlantic region lags far behind the other regions, with an 11.6% growth rate.
The seven states of California, Florida, Texas, New York, Pennsylvania, Michigan, and Ohio dominate almost half (45.5%) of US dispensing activity (Figure 3).

|
| FIGURE 3. The Top-7 hearing aid dispensing states account for nearly half (45.5% in 2006) of US hearing aid unit sales. Texas leads the group with a 10-year growth rate of 54.0%, followed by California (35.7%). Florida, although a huge dispensing state, has had growth of about half (15.7%) the national average (30.2%). |
South Atlantic. All states in this region—except Florida, West Virginia, and Maryland—have been experiencing fast and consistent hearing aid unit sales growth (Figure 4), and this region is the third-fastest growing in this analysis. North Carolina, South Carolina, and Georgia have 10-year growth rates that top 61%, roughly double the national average. Additionally, North and South Carolina had 2006 unit increases of 12.2% and 15.1%. Virginia has also experienced exceptional growth, although the last 2 years have seen slower sales increases, whereas Maryland has had better sales in the last 3 years after suffering a sales decline in 2000 to 2002. The largest of the dispensing regions in this survey, the South Atlantic makes up 18.8% of the hearing aids dispensed by the private sector.

|
| FIGURE 4. South Atlantic (regional unit growth of 32.8% since 1996). Virginia and the Carolinas are three of the hottest dispensing states, with 10-year growth rates exceeding 61%. Georgia (49.3%) and Delaware (39.6%) are not far behind. By comparison, regional behemoth Florida (see Figure 3) has only a 15.7% unit growth rate since 1996. |
Mid-Atlantic and New England. Arguably no region has suffered through tougher times in the last 10 years relative to hearing aid sales than the Mid-Atlantic (Figure 5). Punctuated by steep sales losses in 1999 to 2002—including a 24.8% decline in Pennsylvania’s hearing aid sales in 2002—these three key dispensing states, which make up 12.8% of the nation’s sales, are only now beginning to reapproach or exceed their hearing aid unit levels of the late ‘90s.

|
| FIGURE 5. Mid-Atlantic. With two of the Top-7 high-volume dispensing states in the nation, this region has experienced the slowest sales growth (11.6%) during the last decade, mostly due to the huge decrease in Pennsylvania’s sales in 2002. |
In New England, better-than-average unit gains in Connecticut (41.1% growth over 10 years) and New Hampshire (75.3%) have helped buffer what might otherwise be considered similar sluggish unit volume growth (Figure 6). However, some of the lowest long-term hearing aid sales growth rates in the country belong to New England, including the smaller population states of Vermont (10.2% growth in last decade), Rhode Island (13.4%), and Maine (14.8%). Massachusetts, the largest dispensing state in the region, has a 10-year unit growth rate of 23.2%.

|
| FIGURE 6. New England (regional growth of 28.6% since 1996). With the exception of New Hampshire, which boasts the second highest growth rate (75.3%) in the nation, and Connecticut (41.1%), sales have been steady but unremarkable. |
Great Lakes and North Central/Midwest. Ten-year hearing aid sales growth statistics for the Great Lakes’ three largest dispensing states of Michigan (26.1%), Ohio (19.6%), and Illinois (18.9%) are considerably lower than the national average of 31.1% (Figure 7). Indiana has experienced above-average (35.8%) 10-year sales growth, although the last 5 years have seen flat sales. Wisconsin has done very well in the last 5 years, experiencing a 40.7% gain in unit volume, although its 10-year growth statistics (29.7%) are just below the US norm.

|
| FIGURE 7. Great Lakes (regional growth of 24.4% since 1996). Only Indiana has experienced above-average sales growth (35.8%) during the past decade, although it has hit flat sales in the past 3 years. |
The North Central/Midwest region (Figure 8), like the Great Lakes, has seen lukewarm hearing aid unit sales growth in recent years. The small population states of North and South Dakota have experienced the largest hearing aid unit volume increases in the region (33.0% and 49.4%, respectively) since 1996. Kansas has seen unit sales grow by 32.1% over the last decade, while Minnesota (19.9%), Iowa (22.0%), and Nebraska (25.4%) have seen below-average unit volume growth. Missouri has experienced only a 15.1% increase in hearing aids sales since 2006.

|
| FIGURE 8. North Central (regional growth of 22.5% since 1996). The states with the best 10-year growth rates are South Dakota (49.4%), North Dakota (33.0%), and Nebraska (32.1%). Minnesota has had better-than-average sales in the last 5 years (30.4%). |
South Central and East South Central. These are the two fastest growing regions in the United States (Figures 9 and 10). The South Central region, dominated by Texas hearing aid sales, grew in unit volume by 49.4% in 10 years. Texas’ sales (see Figure 3) have increased by 54.0% in that time span to replace New York as the third-largest dispensing state in the country (after California and Florida). Louisiana (43.1%), Oklahoma (43.8%), and Arkansas (36.7%) have experienced sales during the last decade that are well above the national average. Last year was very good to most of these states, with Texas (15.5%), Arkansas (26.1%), and Louisiana (21.1%) posting excellent hearing aid unit volume increases.

|
| FIGURE 9. South Central (for Texas, see Figure 3). Except for Arkansas (36.7%), all these states have 10-year unit growth rates above 43%, making it the second-fastest hearing aid dispensing region, with a 49.4% increase in unit volume. |

|
| FIGURE 10. East South Central (unit growth of 50.5% since 1996) is the fastest-growing region. Tennessee has a 67.9% increase in sales since 2006, while Alabama (46.9%), Mississippi (42.3%), and Kentucky (34.2%) have also grown faster than the US average. |
Dispensing activity in the East South Central region, which has grown 50.5% in unit volume since 1996, has been led by Tennessee (67.9% unit growth in 10 years), Alabama (46.9%), and Mississippi (42.3%), while Kentucky (34.2%) has seen its hearing aid sales grow more in line with the rest of the country.
Southwest and Hawaii. Another southern region experiencing relatively robust growth figures, the Southwest is dominated by California, which has seen unit volumes increase by 35.7% over the last decade (see Figure 3). However, California is just part of the story. The region has been led in hearing aid unit sales growth during the last decade by New Mexico (62.6%), Nevada (54.3%), Hawaii (42.6%), and Arizona (40.3%), as retirees and workers pour into these states.

|
| FIGURE 11. Southwest and Hawaii (see Figure 3 for California) is the fourth fastest-growing region. With a unit growth rate of 38.6% in the last decade, this has been aided by exceptional s 10-year sales growth in New Mexico (62.6%), Nevada (54%), Hawaii (42.6%), and Arizona (40.3%). |
Pacific Northwest, Mountains, and Alaska. The larger states in this region, Washington and Colorado, have enjoyed a 10-year hearing aid unit volume increase of 47.6% and 40.7%, respectively, while Oregon (29.7%) has experienced sales growth that is just under the national average of 31.1%. Utah has experienced an excellent 69.8% growth rate during the same period, and the smaller dispensing states of Idaho (43.5%), Montana (46.1%), Wyoming (92.8%), and Alaska (62.3%) have all made relatively good sales gains during the last decade.

|
| FIGURE 12. Pacific Northwest, Mountains, and Alaska (unit growth of 45.1% since 1996). The third fastest growing of the nine regions, all these states except Oregon (29.7%) have grown in units by more than 40% since 1996. |
Hearing Aid Styles
Perhaps the biggest story in 2004 to 2006 is the renaissance in BTE hearing aids and the popularity of open-fit devices. In 2006, BTE fittings constituted 43.9% of the market (Table 2), after consistently making up only a fifth (18.1% to 19.0%) of all the hearing aids dispensed during the 1980s and 1990s. Starting in 1999, BTE percentages started drifting upward gradually by about 0.5% to 1% annually, probably due to the increasing use of directional hearing instruments, which arguably favor BTEs. By 2004, BTE market share had increased to 26.4%, and to 32.6% by 2005. In these more recent years, vastly better cosmetic options in thin tubing, as well as the entrance of the Sebotek PAC and open canal devices (ReSoundAir) in 2003 have spurred on BTE usage.

|
Digital hearing instruments have dominated the market since 2002. They now constitute 91.7% of all hearing aids dispensed in the United States.
References
- Strom KE. The HR 2006 dispenser survey. Hearing Review. 2006;13(6):16-39.
- Hearing Industries Association (HIA). Statistical Reporting Program. Fourth Quarter 2006. Alexandria, Va: HIA; March 2007.