This article looks at MarkeTrak customer satisfaction data from the last 10 years. Evidence suggests that hearing aids are still providing only limited satisfaction in the listening situations measured by MarkeTrak, directional hearing instruments still make up only about 10% of the newer hearing aids in use, and value (price vs performance) has remained constant over 10 years as the cost of the aids has risen by 77%. Customer satisfaction with hearing aids has improved substantially relative to satisfaction with dispensing professionals, greater usage (fewer in-the-drawer aids), comfort, feedback, less dissatisfaction in noisy situations, and use with telephones and in the outdoors.
This is the second installment of a multi-part series that covers significant trends in the hearing instrument market. Since 1989, Knowles has conducted six MarkeTrak surveys of the US hearing-impaired market following the landmark 1984 Hearing Industries Association (HIA) study. Future articles will explore the improvements that consumers seek in hearing instruments, factors impacting consumer choices, and the use of ALDs and computers in hearing health care.
The first article1 of this series summarized overall customer satisfaction trends over the previous 10 years, using the MarkeTrak survey. The most significant results indicated that:
- Overall satisfaction with hearing instruments is virtually unchanged despite increased penetration of programmable and DSP technology.
- Hearing instruments in the drawer have decreased (improved) to 11.7% (from 16.2% in 1997).
- Satisfaction with new hearing instruments (eg, less than one year old) declined to 62.9% in 2000.
The purpose of this article is to explore customer satisfaction findings in detail over the past 10 years.
Methods
The methodology of the MarkeTrak VI study appears in the first publication of this series.1 After an initial screening survey, using the National Family Opinion panel in January 2001, an extensive customer satisfaction survey was sent to 3,000 hearing instrument owners with tabulation of the data occurring in April 2001. The response rate for the hearing instrument owner survey was 87%. Detailed demographics of the hearing aid owner population are also documented in the first publication.1
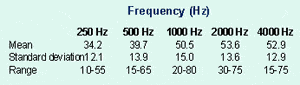
Table 1. Hearing instrument sample characteristics.
In evaluating customer satisfaction trends, this paper focuses on hearing aids less than 6 years old and also new instruments less than 1 year old. Table 1 shows the hearing loss characteristics of the hearing aid owner population and their hearing instruments. Regarding the hearing aid owner, their perceived degree of hearing loss has not changed over the previous 10 years. However, bilateral loss has increased from 75% in 1991 to 82% in 2000. In the past 10 years, the binaural penetration rate has improved 13 points to 68%. Since 1994, we have seen both slight increases in BTE usage as well as significant increases in “invisible” ITC hearing instruments.
Since the previous MarkeTrak survey, programmable/DSP technology has grown from 13% to 28% of hearing instrument sales, according to the survey, while instruments without volume controls increased from 11% to 22% of hearing instruments. Consumers report that 20% of their hearing instruments have telecoils and 10% have dual microphones. With respect to the latter feature, a list of popular “directional” brands and trademarked names were supplied to the consumer.
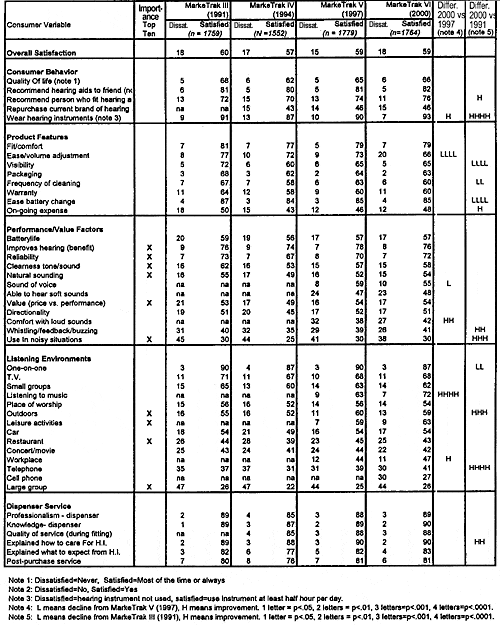
Table 2. Customer satisfaction, 1991-2000 (hearing instruments less than 6 years old).
10-Year Trends
Table 2 documents the percent satisfaction and dissatisfaction with hearing instruments for each of the previous four MarkeTrak surveys. This is followed by a statistical comparison between the 2000 and 1997 MarkeTrak surveys and the 1991 (benchmark) MarkeTrak surveys. Figures 1-5 visually portray the MarkeTrak VI customer satisfaction/dissatisfaction ratings.
In reviewing these findings, it is important to keep in mind the top 10 correlates of overall customer satisfaction.2 In other words, these are the areas that tend to co-vary the most with overall satisfaction: 1) Benefit; 2) Sound clarity; 3) Value (price/performance); 4) Reliability; 5) Use of hearing instrument during leisure activities; 6) Natural sounding; 7) Use in noisy situations; 8) Use in large group situations; 9) Use in restaurants; 10) Use outdoors. The implication is that incremental improvements in these areas will lead to improvements in overall satisfaction.
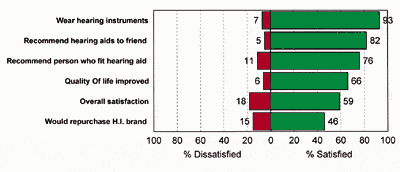
Figure 1a. Overall indices of customer satisfaction with hearing instruments, where the hearing instruments are less than 6 years old. |
Overall Indices (Figure 1a): Customer satisfaction with hearing instruments is currently 59%—virtually unchanged over the past 10 years. Similarly, the extent to which users would recommend hearing aids to their friends (82%) or repurchase their current brand of hearing aid (46%) is unchanged. The majority of consumers are thus unlikely to repurchase their current brand of hearing aid 4-5 years from now when it is time to replace their instrument. On the positive side, small improvements were seen in the likelihood that the consumer would recommend the dispenser (76% in 2000 versus 70% in 1994). People are wearing their hearing aids more hours per day, and we see a gradual decline of hearing aids in the drawer since 1994.
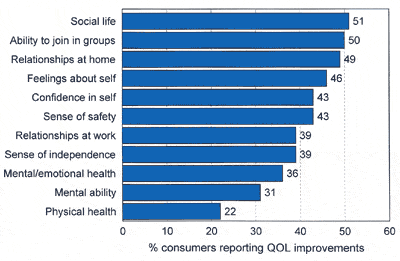
Figure 1b. Percent of current hearing instrument users reporting improved quality of life due to hearing instruments (hearing instruments less than 6 years old). |
Importantly, of those consumers who used their hearing aids “most of the time” to “always,” 66% indicated that their quality of life had been impacted positively by their hearing instrument. Areas most affected by hearing instrument usage are as follows (Figure 1b):
- One in two report their social life, ability to join in groups, and relationships at home have improved due to hearing aids;
- Two in five report improvements in their feelings and confidence in self, their personal sense of safety, relationships at work, and sense of independence;
- About one in three report improved emotional/mental health and mental/cognitive ability;
- One in five report improved physical health.
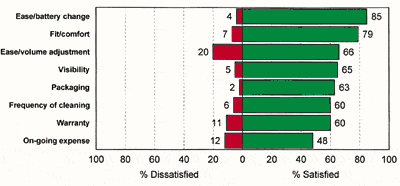
Figure 2a. Customer satisfaction with hearing instrument product features (hearing instruments less than 6 years old). |
Product Features (Figure 2a): While none of the factors in Figure 2a make the “top 10” list of issues impacting overall satisfaction, it is important to summarize trends. The most significant trend is the continued decline of ratings related to control of volume on the hearing instrument. Currently, nearly one in four consumers do not have a volume control on their hearing aid. Thus, we see a significant drop in satisfaction of 11% points since 1991, and 7% points since 1997. Dissatisfaction has increased to 20% in 2000 from 8% in 1991.
Some argue that it is unfair to ask this question since so many newer hearing instruments no longer have a VC. Thus, I have asked a second question of the consumer: “Do you want or need a volume control on your hearing instrument.” The consumer was permitted to answer “yes,” “no,” or “unsure.” Approximately one-third (35%) of consumers without a volume control indicate they want one. There are no significant differences between new users and experienced users on VC need.
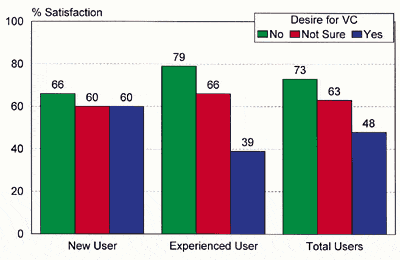
Figure 2b. Customer satisfaction with hearing instruments as a function of the users’ desire for a volume control (hearing instruments less than 6 years old). |
The overall satisfaction ratings for new and experienced users as a function of “VC need” are shown in Figure 2b. The customer satisfaction rating differences between consumers “wanting a VC” and “not wanting/needing a VC” are astounding: 40% customer satisfaction difference for experienced users, 8% points for new users, and 25% customer satisfaction points for all users. Clearly the lack of a volume control primarily impacts the customer satisfaction of experienced users. A future publication will dedicate itself to this issue with the intent of isolating the VC impact on consumer satisfaction.
Only 79% of current users are satisfied with the fit and comfort of their hearing aids. This is the third most frequently mentioned reason why hearing aids are in the drawer.3 Over the last 10 years, satisfaction with visibility of the hearing aids, frequency of cleaning, and ease of battery change have declined. This decline is probably due to the increased penetration of CICs. MarkeTrak V4 showed that the advent of smaller hearing aids have most likely caused individuals who use larger models (eg, BTEs and full-shell ITEs) to be less satisfied with larger aids.
Figure 3. Customer satisfaction with hearing instrument performance (hearing instruments less than 6 years old). |
Hearing Instrument Performance (Figure 3): Hearing instrument performance is an important category, since six of the top 10 correlates of overall customer satisfaction are in this section: benefit, reliability, sound quality (sound clarity, natural sounding), value, and use in noise. The remaining four most important factors deal with hearing aid effectiveness in difficult listening situations.
Only three in four consumers (76%) are satisfied with the benefit they get from their hearing instrument, and only 7 in 10 with its reliability. Lack of sufficient benefit is rated as the primary reason why hearing aids are in the drawer.4 Only six in 10 are satisfied with the clearness of tone and sound (58%), while only about half are satisfied with such important factors as: sound of voice, natural sounding, value (price versus performance), ability to tell location of sound, and ability to hear soft sounds. Only four in 10 are satisfied with the ability of the hearing instrument to make loud sounds comfortable and the ability of the instrument to curtail whistling, feedback, and buzzing. Finally, only 30% of consumers are satisfied with the hearing instrument in noisy situations while 38% are dissatisfied; this is the #3 reason why hearing aids are in the drawer.4
While only 54% of consumers are satisfied with the value of the product, it is important to keep in mind that perceptions of value are statistically equivalent over the last 10 years despite the fact that the average retail price experienced by the consumer (taking into account free VA hearing aids and third-party reimbursement) has increased 77%.1 Undoubtedly, the consumer is perceiving an improved experience with their more modern hearing instrument (perhaps on factors not measured by MarkeTrak) for “value” to remain constant when prices have increased. Due to the complexity of this issue, a future publication on the topic of value is planned.
Since 1997, customer satisfaction with “sound of voice” has declined 4% points while “comfort with loud sounds” has increased 4% points. Since 1991, mean scores for “whistling/feedback/buzzing” and “use in noise” have improved while satisfaction scores have remained constant. This is due to a reduction in “dissatisfaction,” but not a corresponding increase in satisfaction in these categories.
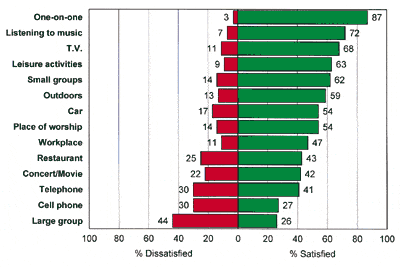
Figure 4a. Customer satisfaction with hearing instruments in selected listening situations (hearing instruments less than 6 years old). |
Consumer Satisfaction in Selected Listening Situations (Figure 4a): MarkeTrak currently measures satisfaction in 14 listening situations, up from 10 in 1991. Since the 1997 MarkeTrak survey, “cell phone” satisfaction has been added.
Eighty-seven percent of consumers are satisfied in one-on-one situations, which is statistically lower than 1991. Since 1997, the industry has significantly improved satisfaction with the consumer’s musical listening experience by 9% and by 3% in the workplace. Since 1991, customer satisfaction with hearing aids has improved in outdoor environments and on the telephone by 4%; however, in all likelihood the small gains on the telephone are due to CIC hearing instruments. Still, only about half of consumers are satisfied with their hearing instruments in cars, places of worship, and in the workplace; four in 10 are satisfied with their instruments in restaurants, concert/movies, and on the telephone; and only one in four are satisfied with their hearing instruments on cell phones and in large groups.
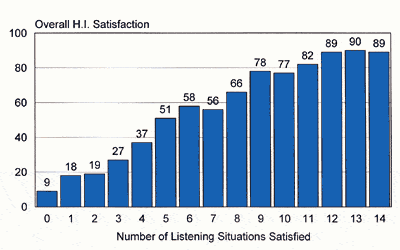
Figure 4b. Impact of improving multiple environmental listening utility (MELU) on overall satisfaction (all hearing aid owners, n = 2,572). |
Figure 4b shows the powerful impact of improving multiple environmental listening utility (MELU) for the consumer. In this chart, the results for the entire hearing aid owner population are shown. Consumers who are satisfied in no listening situation (eg, they could be dissatisfied or neutral) can be expected to be satisfied with their hearing instruments 9% of the time. Consumers who achieve satisfaction in only half of their listening situations (ie, seven MarkeTrak situations) report an overall satisfaction rating of 56%. Clearly consumers expect their hearing aids to perform in the majority of listening situations. I estimate we must provide value (eg, listening utility) in 85% of the listening situations to achieve an overall 90% customer satisfaction rating.
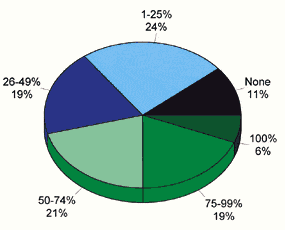
Key Black —satisfied in 0 listening situations Light Blue — satisfied in 1%-25% of listening situations Blue — satisfied in 26%-49% of listening situations Light Green — satisfied in 50%-74% of listening situations Green — satisfied in 75-99% of listening situations Dark Green — satisfied in 100% of listening situations |
| Figure 4c. Estimated percentage of hearing instrument users who are satisfied in the 14 different MarkeTrak VI listening situations (hearing instruments less than 6 years old). |
Using the MELU yardstick measure on hearing aids less than 6 years old, I estimate that (Figure 4c):
- 11% of users are satisfied in no listening environment—not even 1-on-1 situations;
- 35% of users are satisfied in 25% or less of listening situations;
- 25% of users are satisfied in 75% or more of listening situations.
Figure 5. Customer satisfaction with dispenser (hearing instrument less than 6 years old). |
The Dispenser Experience (Figure 5). One area has improved statistically over the previous 10 years: explanation on care of the hearing instrument.
In general, most of the dispenser ratings remain impressively high—in the 90% range. The exceptions are creating expectations (83%) and post-purchase service (81%). A future article will discuss factors consumers consider when choosing a dispenser, as well as sources deemed most trustworthy when choosing a brand of hearing aid.
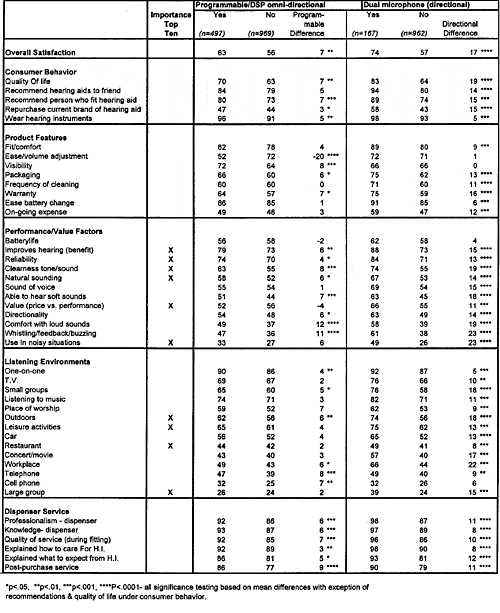
Table 3. Customer satisfaction with advanced technology hearing aids (MarkeTrak VI: hearing aids less than 6 years old).
Impact of Advanced Technology (Table 3). MarkeTrak now queries consumers regarding features of their hearing aid system including: VC, remote control, telecoil, programmability, DSP, dual microphones, and the extent to which they use ALDs along with their hearing aids. With respect to dual microphone technology (directional hearing aids), popular brand names and trade names denoting dual microphones were supplied to the consumer to help them decide if this feature was in their hearing instrument. For each feature the consumer indicated “yes,” “no,” or “not sure.” In previous MarkeTrak research, we have reported on the binaural, telecoil and programmable effect3 using this technique; this should be contrasted with the numerous studies published using MarkeTrak surveys, where we knew precisely what product the consumer received.
Table 3 focuses on two hearing system features: omni-directional programmability (analog or DSP) versus non-programmable product, and dual microphone (directional) technology versus single microphone technology (analog or DSP). For both features, only “Yes” and “No” responses are compared in terms of satisfaction (ie, “not-sures” are excluded).
Omni-directional programmable product achieved a 7% customer satisfaction improvement (63%) compared to a 17% improvement for directional hearing aids (74%). Consistent with previous MarkeTrak research, the programmable product showed significant improvements in customer satisfaction when compared to non-programmable product on 27 factors; however, only two of the improvements proved to be double-digit improvements. These two areas were: comfort with loud sounds, and whistling, feedback and buzzing. Ease of volume control adjustment declined 20% for the programmable product.
Figure 6. Customer satisfaction improvements of at least 15% due to dual-microphone (directional) technology (hearing instruments less than 6 years old). |
In comparison, the dual microphone product demonstrated significant improvement on 42 of 46 factors measured in MarkeTrak. Thirty-three of the factors showed double-digit improvements, 17 factors 15% or more, and three factors 20% or more. The 17 factors with a 15% or more improvement are graphed in Figure 6. Five of these improvements are in the top 10 list of issues impacting overall satisfaction. Referring back to Table 3, nine of the top 10 factors show double-digit improvement if the consumer uses dual microphone technology.
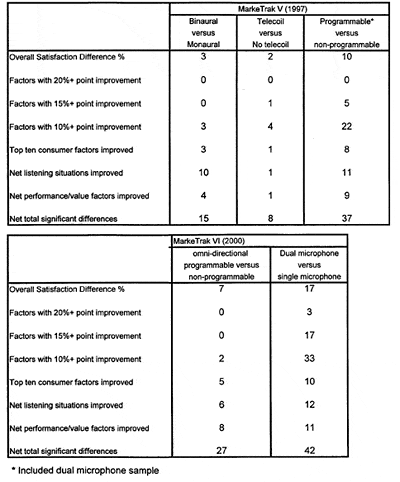
Table 4. Summary of impact of technology on customer satisfaction.
In Table 4 is a brief summary of the MarkeTrak V findings for binaural, telecoil, and programmable product (which included directional technology). The final two columns summarize the MarkeTrak VI findings in Table 3, comparing omni-directional programmable versus non-programmable technology, and single versus dual microphone technology. The new MarkeTrak findings are consistent with independent large-scale customer satisfaction studies on the impact of programmability5-9 and dual microphone (directional) technology.2,10-11 In this sample of directional users, we found a 17% difference in customer satisfaction in favor of directional technology versus omni-directional instruments.
Previously in a large sample study with one manufacturer, we also found a 17% difference in favor of directional DSP instruments. In this latter study, the directional DSP product was found to be statistically superior to MarkeTrak hearing aids on 25 factors; 14 of the factors showed double-digit (>10%) customer satisfaction improvements, while 6 of the top 10 factors were significantly higher.
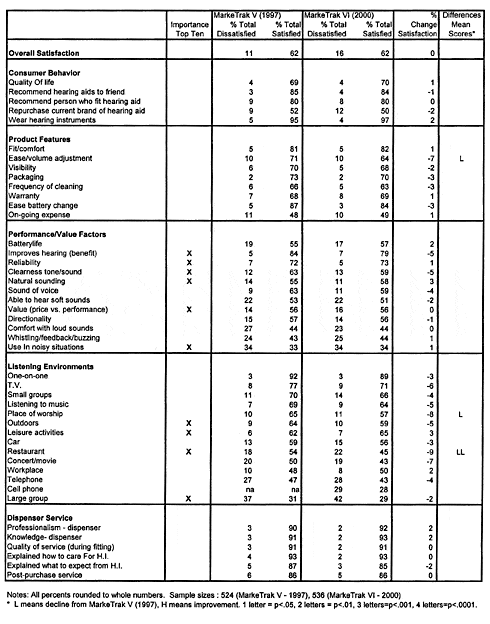
Table 5. Short-term customer satisfaction, 1997 versus 2000 (hearing instruments 3-12 months of age).
New Hearing Instruments (Tables 5-6): In Table 5, dissatisfaction and satisfaction scores for new hearing instruments (ages 3-12 months) are documented. Over the past 3 years, overall satisfaction was constant. However, significant declines in customer satisfaction scores were found on three factors: ease of volume control adjustment, listening experiences in place of worship, and experiences in restaurants.
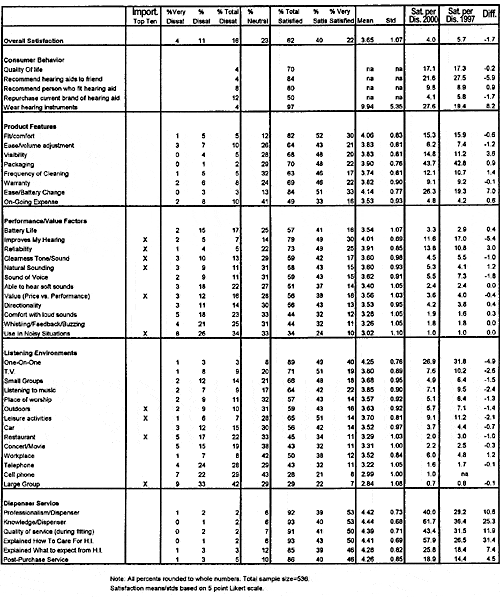
Table 6. Customer satisfaction: MarkeTrak VI (2000) norms for new hearing instruments (3-12 months old).
Finally, detailed norms for new hearing instruments (3-12 months of age) are found in Table 6. This table is provided primarily for researchers studying new technology less than a year old but greater than a 3-month acclimatization period.
Summary and Conclusions
• Overall customer satisfaction has remained static over the previous 10 years. Improved areas are: satisfaction with the dispenser, greater usage of hearing aids, less hearing aids in the drawer, less whistling and feedback, less dissatisfaction in noisy situations (but not greater satisfaction), on-going expense associated with hearing aid usage, greater enjoyment with hearing instruments on the telephone and outdoors. Declining areas of satisfaction are: ease of volume adjustment, frequency of cleaning, ease of battery change, visibility of the instrument, and one-on-one communication. With the availability of “invisible” hearing instruments, it is probable that the BTE and ITE products appear to be “more visible” to the world.
• Since the 1997 MarkeTrak survey, small improvements in customer satisfaction were seen in: comfort with loud sounds (still low at 42%), greater enjoyment while listening to music and in the workplace. Two areas declined since 1997: ease of volume adjustment and satisfaction with “sound of voice.”
• Close to one in four individuals report that their hearing instrument lacks a volume control; yet, one in three indicate they want one. This finding is consistent across new and experienced users. However, the lack of a VC would appear to be negatively related only to the customer satisfaction ratings of experienced users.
• Customer satisfaction with value (price versus performance) has remained constant over the last 10 years despite a 77% increase in realized price to the consumer.
• 11% of consumers are satisfied in no listening environment—not even one-on-one—while 25% of users are satisfied in three out of four listening situations.
• Omni-directional programmable product achieved a 7% improvement in customer satisfaction and demonstrated improvements on 27 of 46 MarkeTrak factors.
• Despite the mounting evidence for the value of directional hearing aids, only about 10% of hearing aids less than 6 years of age are directional, according to consumers. This result is consistent with our independent analysis of the market. In this study, dual microphone (directional) technology achieved a 17% improvement in customer satisfaction and demonstrated improvements on 42 of 46 MarkeTrak factors. Seventeen factors had improved satisfaction ratings of 15% or more when compared to omni-directional technology. Factors most positively impacted by directional hearing instruments are: hearing in noise, whistling & buzzing (+23%), workplace usage (+22%), clearness of tone & sound, comfort with loud sounds and quality of life (+19%), able to hear soft sounds, usage outdoors, in small groups ,and at concerts or movies (+18%).

|
Correspondence can be addressed to HR or Sergei Kochkin, PhD, Knowles Electronics, 1151 Maplewood Dr., Itasca, IL 60143; email: [email protected].
References
1. Kochkin S. MarkeTrak VI: The VA and direct mail sales spark growth in hearing aid market. Hearing Review. 2001;8(12):16-24, 63-65.
2. Kochkin S. Customer satisfaction with single and multiple microphone digital hearing aids. Hearing Review. 2000;7(11):24-29.
3. Kochkin S. MarkeTrak V: Customer satisfaction revisited. Hear Jour. 2000; 53(1):38-55.
4. Kochkin S. MarkeTrak V: Why my hearing aids are in the drawer: The consumer’s perspective. Hear Jour. 2000;53(2):34-42.
5. Kochkin S. Customer satisfaction and subjective benefit with high-performance hearing instruments. Hearing Review. 1996;3(12):16-26.
6. Davis PB, Pogash R. Power for kids. Hearing Review. 2002; 9(3): 52-57.
7. Jedidi K, Estelami H. Measuring user satisfaction with programmables. Hear Instrum. 1994;5(5):22-23.
8. Whichard S. Auditory benefits of ReSound sound processing technology. Seminars in Hear. 1997;18(1):63-66.
9. Sandridge S. Customer satisfaction with MultiFocus hearing aids. Seminars in Hear 1997;18(1):67-72.
10. Kuk F. Hearing aid survey tests user satisfaction. Hear Instrum. 1996;47(1):24-29.
11. Schuchman G, Valente M, Beck LB. Potts L. User satisfaction with an ITE directional hearing aid. Hearing Review. 1999;6(7):12-22.