This is the third article in a three-part series. The first two articles discussed myths that hold back hearing aid design1 and myths about hearing in noise and directional microphones.2
The original goal of this third article was to relate user satisfaction to benefit in some new and useful way. During its preparation, I spent the better part of a day each with Sergei Kochkin, Larry Humes, Brian and Therese Walden, Robyn Cox, and Gus Mueller—all of whom have contributed greatly to our collective understanding of benefit and satisfaction with hearing instruments. Each of them recounted, in one way or another, how elusive it can be to find an iron-clad relationship between overall satisfaction and specific benefit. I finally concluded that it was unlikely that I could add substantially to their contributions.
Thus, this article attempts to dispel some of the common myths about hearing aid fitting and satisfaction. In the process, data on overall satisfaction over the past 60 years are summarized, followed by speculations as to why our expectations for increased satisfaction have not been realized.
Significant Improvements in Hearing Aids and Fittings
In the past decade, hearing aid technology has changed from analog circuits with trimpot adjustments to digitally programmable analog circuits, to all-digital circuits, and from one or two channels to 16 or more channels of signal processing. New fitting formulae have appeared: NAL-NL1, CAMFIT, DSL[i/o], and FIG6. Each arguably has an improved fitting accuracy over previous formulae in their ability to achieve the minimum goals summarized by the Independent Hearing Aid Fitting Forum (IHAFF): “to make 1) soft sounds audible, 2) conversational speech comfortable, and 3) loud sounds not uncomfortable.”3
New hearing aid probe-microphone and 2cc-coupler test equipment have been introduced, allowing the gain and output of a hearing aid to be measured with an actual speech signal rather than with pure-tones or a steady-state composite or noise. Using speech, it is now possible to accurately test every digital hearing aid—regardless of type of signal processing, noise-reduction, and feedback-management algorithms employed. Likewise, new fitting software has been introduced to allow for easy adjustment, flexibility, and precision that was only imagined 10 years ago. New tests such as the QuickSIN and HINT tests have been developed so that dispensing professionals can readily predict the patient’s degree of difficulty hearing in noise, and counsel them appropriately. Additionally, the general educational level of those dispensing hearing aids has risen.
Someone acquainted with these facts might conclude that a significantly increased percentage of hearing aid purchasers express satisfaction today compared to 10 years ago, and that a growing percentage are obtaining hearing aids on the recommendation of current users. Neither of these conclusions is true.
Subjective and objective measures of benefit and satisfaction have been developed in an effort to determine how well we are doing with our hearing aid designs and fittings. Subjective benefit is measured with tools such as the APHAB4 and COSI.5 Objective benefit is measured by improvements in word scores, aided thresholds, and the signal-to-noise ratios (SNR). Unfortunately, subjective and objective benefits often don’t correlate well with each other or with satisfaction ratings.
In trying to explain why, six commonly held assumptions or “myths” can be proposed:
Myth #1. Significant technology improvements will consistently increase expressed satisfaction with hearing aids.
Most of us expected that patient satisfaction would increase along with the dramatically greater circuit flexibility that allows us to do a more precise job of adjusting hearing aids for each patient’s hearing loss. By 1994, 80% of hearing aids in the United States were ITE or ITC construction.6 At that time, as many as three trimmers could fit on the faceplate of an ITE hearing aid, but one or two trimmers were more common. One trimmer might provide a simple tone control, and another might control the level at which output limiting took effect. The hearing aid had to go back to the factory if adequate adjustments could not be made with the available trimmers.
Today, the hearing aid that arrives from the manufacturer can be rapidly programmed to fit a wide range of hearing losses—flat, moderate, sloping, cookie bite, or ski slope. The manufacturer needs only to choose a receiver with adequate output capacity for the hearing loss, and the appropriate microphone(s); digital programming allows the dispenser to do the rest. Just as with the simpler circuits of 10 years ago, the manufacturer typically preprograms the hearing aid from the audiogram submitted with the order, and dispensing professionals now have a “First-Fit” button on their computer screen.
How has overall satisfaction progressed during this period? Figure 1 shows Kochkin’s data7 on satisfaction obtained from approximately 16,000 subjects over the last 10 years. Satisfaction with all hearing instruments in 2000 was 59%. Customer satisfaction with the value (price vs performance) of hearing aids has also remained constant over the last 10 years (although it should be noted that the price of hearing aids has increased by 77% during that time). Kochkin noted that the difference in customer satisfaction from 10 years ago was not statistically significant, and—pertinent to Myth #1—the writer adds the observation that this trend in satisfaction is not an upward one as expected.
Not only has reported satisfaction not improved over the last 10 years, but data obtained by the noted hearing aid engineer Samuel Lybarger (as recorded in his lab notebook) in 1967—a time when 40% of hearing aids were body or eyeglass aids—indicate just the opposite may be true. Lybarger reported that 84% of those who were regularly wearing their hearing aids were satisfied (Figure 2). Accounting for those who were not wearing their hearing aids (ie, assuming that everyone who had consigned their aids to a drawer was dissatisfied) left a total of 67% of hearing aid purchasers who classified themselves as “satisfied.”
More dramatic, perhaps, was the 1944 report of Hughson & Thompson8 that was based on the results of questionnaires sent to people who had their hearing aids selected for them at a hospital clinic. The researchers found that 90% of those fitted were satisfied with their hearing aids.
Since the methods in the three surveys shown in Figure 2 were radically different, and a higher percentage of hearing aid wearers in 1944 had a conductive hearing loss, we cannot conclude that satisfaction in an absolute sense has declined. As Brian Walden pointed out during the preparation of this article, satisfaction is directly related to patient expectation, and it is likely that patients in 2004 have dramatically higher expectations than patients in 1944 or 1967. We can imagine that patients in 1944 were amazed and delighted that they could hear anything at all, whereas today’s patients have reason to expect much more.
Two substantial studies of relatively new hearing aids have been reported. In the latest MarkeTrak article9 on newer (<2 years old) hearing aids, differences in satisfaction rates between hearing aid technologies were noted. Non-programmable hearing aids had an overall customer satisfaction rating of 58% (about the same as Internet and phone services), programmable omni-directional aids had a satisfaction rating of 72% (about the same as banks and the US Postal Service), and programmable directional aids had a rating of 81% (a relatively high rating on par with cars and consumer electronics).
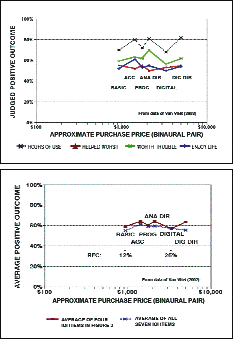
Van Vliet10 studied satisfaction and benefit versus technology on 1,493 well-fitted and well-counseled patients who had attended three 1-hour rehabilitation classes. He used the new IOI-HA scale,11 and the scores in Figures 3-4 reflect the percentage of those subjects giving the two highest ratings on that scale. For example, for the item, “When you use your hearing aids, how much difficulty do you STILL have (in the situation where you most wanted to hear better)?” those answering “No difficulty” or “Slight difficulty” were counted as reporting a positive outcome, while those answering “Moderate difficulty,” “Quite a lot of difficulty,” and “Very much difficulty” were not counted. The overall average across hearing aids and IOI items for the 1,493 patients who answered the questionnaire (49% response rate) was 58%—strikingly similar to the 59% obtained by Kochkin (Figure 1).
“Myth 1”—that improved technology consistently results in an improvement in expressed satisfaction—is supported by Kochkin’s latest MarkeTrak data on customer satisfaction with new hearing aid technology.9 However, it is contradicted indirectly by Kochkin’s 2002 data7 (ie, overall satisfaction with all aids in the time-period covering analog to digital technology) and contradicted directly by Van Vliet’s 2002 data.10 Additionally, Cox & Alexander12 reported that comparisons within each SADL (Satisfaction with Amplification in Daily Life) subscale revealed that “those who purchased conventional devices were more satisfied than those who purchased high-tech devices in every subscale except Personal Image, where the two device types were equal.”13
Conclusion: Significant improvement in expressed satisfaction has not consistently accompanied dramatic improvement in the technology of hearing aids. Possible reasons for this surprising conclusion are discussed in the following sections.
Myth #2. Increased benefit always results in increased patient satisfaction.
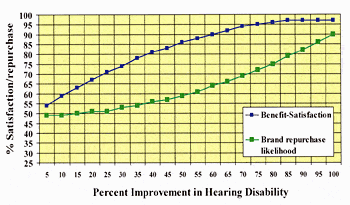
In some experiments, the correlation between benefit and satisfaction is very strong, as shown in Kochkin’s data9 which demonstrates that, on average, a 50% improvement in hearing disability equates to 57% satisfaction with value, 72% overall satisfaction, and 85% satisfaction with benefit (Figure 5).
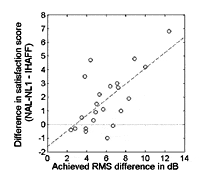
In other cases, it is hard to see any correlation. Figure 6 from Bentler, He & Wu (unpublished data) demonstrates that satisfaction measures (ie, IOI Question #4, a Kochkin subscale, and SADL) and benefit measures (ie, APHAB) can show little relationship to each other. The data in Figure 6 are for the APHAB Benefit in Noise (BN) subscale. The other APHAB dimensions—Ease of Communication, Reverberation, and Aversiveness—show the same lack of predictive ability for satisfaction. Kochkin9 argues that part of the problem results from our practice of ascribing the same 25% benefit score to patients who go from 100% hearing disability to 75% hearing disability as compared to those who go from 25% to 0% disability. Obviously, the latter persons have less hearing impairment to overcome and may also have nearly all of their communication difficulties remediated.
Wong et al.14 provided an elegant systematic survey of the 46 known studies of hearing aid satisfaction. Their most emphatic conclusion is that the performance of most hearing aids is rated as beneficial and at least partially satisfactory by purchasers when compared to listening without hearing aids. However, attempts to compare various circuit types (digital, analog, WDRC, linear, directional/omni mics, etc) resulted in less conclusive results. When the results were statistically significant, they often would not be judged as practically significant.
The following examples of excellent research further illustrate the problem. In the classic NIDCD-VA study involving 8 Veterans Administration audiology laboratories, 16 co-authors, and 360 patients, Larson et al.15 reported on three circuit technologies: 1) linear peak-clipper; 2) linear with compression limiter, and 3) wide-dynamic-range compression (WDRC). Most of us expected the lower-technology peak-clipper circuit to receive significantly lower ratings than the other two. Each circuit provided significant benefit in quiet and noisy listening situations compared to no hearing aids. The difference between circuits, however, was much less than the differences between aided and unaided conditions. Statistically, the patients preferred the compression limiting aid more frequently than the other two hearing aids, and the peak-clipper circuit scored about the same as the WDRC circuit used in these experiments.
In direct contrast to the NIDCD-VA study results, Humes et al.16 reported that 42 of 55 subjects found the WDRC instruments superior to the linear peak-clipper devices for many of the outcome measures. Humes17 also found that the dispensing professional was one of the more significant factors in the subjective benefit ratings. Walden et al.18 also found that WDRC amplification could be expected to supply slightly better performance than linear amplification with input compression limiting.
Cox & Alexander19 found that there was no significant difference in hearing-aid benefit among three different hearing aids having frequency-response slopes differing by a total of 8 dB/octave (24 dB difference in high-frequency boost between 500 Hz and 4000 Hz).
On the other hand, consider the comments of Villchur, whose basic research20 ultimately resulted in ReSound WDRC hearing aids and influenced the K-AMP design. Villchur reported that, in an experiment where he reprogrammed the hearing aids of 8 patients, he heard comments such as “The new settings are as much an improvement over the old ones as the ReSound aids were over my old hearing aids in the first place.” These comments accompanied dramatically improved objective benefit as measured using IEEE sentences in cafeteria noise in some cases.
The overall conclusion remains: Hearing aids can provide significant benefit and satisfaction. The difference in outcomes between technologies is much harder to document, especially if the manufacturer’s fitting algorithms are flawed (discussed later). This is not a happy finding, because it greatly complicates the task of designing better hearing aids.
Myth #3. Increased hearing aid cost increases perceived value.
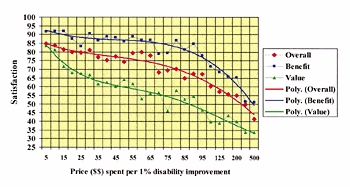
If we define “value” for the purpose of this article as the average of judged benefit, hours of use, and satisfaction as measured on the IOI-HA scales, then replot Van Vliet’s data10 relative to purchase price, it can be seen that there is an inverse relation between perceived benefit and cost (Figure 7).
In a related result, Cox & Alexander12 found that “free” (third-party pay) hearing aids were significantly more satisfactory in an absolute sense than purchased hearing aids. Similarly, Kochkin9 showed that, as price increases for each point of hearing disability improvement, value declines precipitously compared to overall satisfaction or satisfaction with benefit.
Myth #4. First-Fit algorithms provide sufficient gain to make quiet speech nderstandable.
Each of the current fitting formulae—NAL-NL1, CAMFIT, DSL[i/o], and FIG6—were designed to provide adequate gain so that soft elements of speech would be readily understood. In practice, however, many hearing aids are programmed using the “First-Fit” algorithms available in most fitting software. The person programming the hearing aid often assumes that the First-Fit option in the fitting software is faithful to the original fitting formula they select. This is a faulty assumption. Some First-Fit algorithms are nearly exact, while others are not, with the result that patients are often left unable to hear quiet sounds.
Keidser et al.21 reported First-Fit average gains (average of 500 Hz,1 kHz, 2 kHz, and 4 kHz) as low as 23 dB for a 60 dB flat hearing loss. This gain resulted in an aided audiogram average of 37 dB HL.
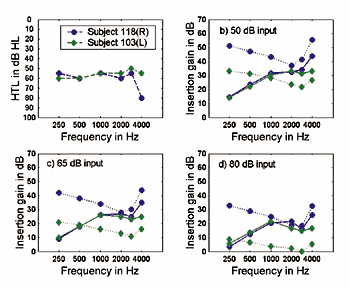
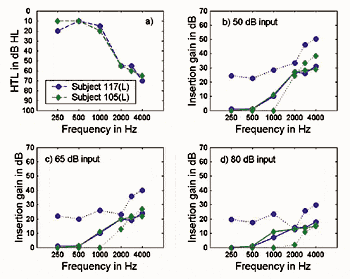
Killion et al.22 measured 7 hearing aids using the Speechmap™ system of Audioscan’s Verifit™ system. This system permits the use of real speech to provide a realistic measure of the operating gain of a hearing aid, without concern that a noise-reduction circuit will misinterpret the test signal as noise and decrease the gain in the frequency band nearest the test signal. The audiograms shown in Figure 8—which most of us would consider candidates for hearing aids—are the estimated aided audiograms that would have been produced by one of the hearing aids programmed to the default First-Fit settings.

These aided audiograms were estimated by subtracting the measured speech gain of the hearing aid at 55 dB SPL input from the unaided audiogram, which lifts the audiogram curve. (The hearing aid exhibited the same gain at 55 and 70 dB SPL, so it was assumed linear below 55 dB SPL.) Both unaided and estimated-aided audiograms are shown in Figure 9.
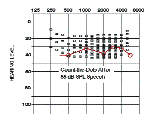
More than half the speech cues are missing in the aided audiogram shown in Figure 8, as illustrated in Figure 10. The calculated aided Articulation Index (AI) using Mueller & Killion’s Count-the-Dots method23 was 26% for the flat audiogram and 36% for the sloping one, corresponding to expected aided NU-6 word scores of 24% and 40%.
It might be argued that the 55 dB SPL (40 dB HL) speech level we used is unusually soft speech, but this intensity level is fairly common in face-to-face conversation at a 1-meter distance, not to mention the distance of several meters across a large table or in a church. Everyday speech from across the room or from one room to another often falls between 40-50 dB(A) SPL.
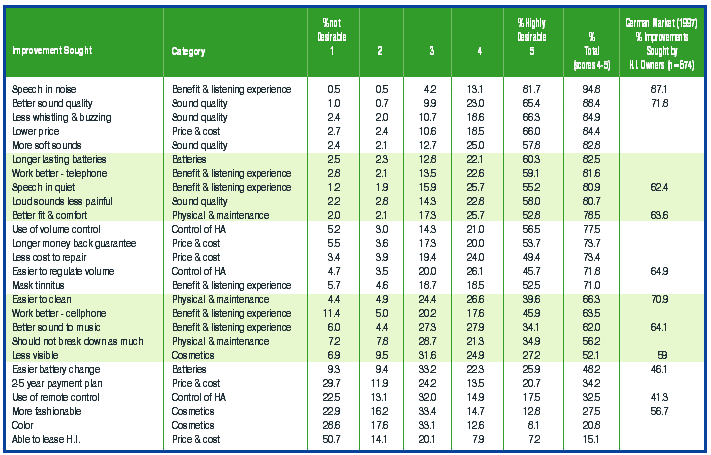
As an indication that the First-Fit problem illustrated in the previous figures is not an isolated one, Table 1 shows the range of Speech Intelligibility Index (SII) values obtained with Verifit SpeechMap measurements on a series of hearing aids with one of the two unaided audiograms shown in Figure 9 and with a third mild-moderate (40-60 dB) sloping-loss audiogram. Unfortunately, manufacturers whose First-Fit programs consistently provided excellent audibility for soft speech with one model, provided almost no gain for quiet speech with another model.
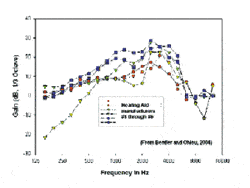
Unpublished data from Bentler & Chiou (“First-Fit data on Modern Hearing Aids from Six Manufacturers,” University of Iowa, 2004), using speech input of about 1 minute of a male talker, support these results (Figure 11). The default First-Fit program for a 50 dB HL flat hearing loss was used in each case, and the gain was calculated in 1/3 octaves. The response curves in Figure 11 show large variations among manufacturers and models similar to those described above.
An AI or SII of 100% for 60 dB SPL (45 dB HL) speech would require aided thresholds of 20 dB HL, which were the targets Pascoe24 used for those with gently sloping losses. Moreover, Margaret Skinner has reported in personal communication with the author that she and her colleagues routinely meet this goal with cochlear implants. She also stated that, if cochlear implant patients can benefit from quiet sounds (and do not reject their implants because of background noise), it seems reasonable to assume that hearing aid wearers also should not be deprived of those sounds.
There is probably nothing wrong with providing low gain to ease the patient into hearing aids, as long as vigorous follow up prevents the hearing aids from staying at the initial low-gain settings. But if patients seek help with sounds they can no longer hear, and are not told that they won’t be able to hear much of normal quiet speech with their new First-Fit hearing aids, they are likely to be keenly disappointed.
Kochkin7 found that 82% of those he surveyed desired to hear more soft sounds (58% said highly desirable, 24% said desirable), and a similar total wanted improvement in speech in quiet. The primary reason people purchase a hearing aid is to improve their ability to hear soft sounds and speech that are inaudible to their impaired ears. This requires relearning how to recognize and localize noise so that it is ignored by the “automatic brain-operated noise suppressor option” we are born with. As Pascoe25 eloquently stated: “Success in using hearing aids is learning to ignore the background noise and forgetting that you have them on.”
Aided word scores of 24% and 40% as in Figure 9 are indicative of an incompletely solved hearing problem. The 12%-16% of hearing aids in drawers, combined with the abovementioned desire of hearing aid wearers for an improved ability to hear soft sounds and soft speech, suggests that one part of the satisfaction problem may be that we regularly do not provide adequate gain for our patients, and we fail to perform adequate verification of performance after a short period of acclimitization.
According to Deming,26 a car industry study concluded that a satisfied person tells 8 others; a dissatisfied person tells 16 others. If only 60% of our patients report satisfaction and 17% report dissatisfaction, the math suggests that from each 10 hearing aid purchasers, 48 people who need hearing aids hear a positive report, and 27 hear a negative report. Hardly a ringing endorsement.
Myth #5. The gain and frequency response on the computer screen is what the hearing aid is delivering to your patient.
Hawkins & Cook27 reported measured insertion-gain values at 4 kHz that ranged from 13-23 dB below the value shown on the screen in one-third of the cases they examined. The answer to Myth #5 (that the frequency response on the computer screen is what is heard by your patient) appears to be “Maybe not.”
Given these findings, it is even more surprising that only about a third of dispensing professionals use probe-microphone verification, and only 30% routinely conduct aided speech measures.28 As with television, the information presented on the screen cannot be accepted on face value; as professionals, we cannot allow ourselves to be lulled asleep by pretty pictures and graphic displays.
If the screen does not accurately represent what hearing aids deliver and there is no verification at the time of the fitting, one can only guess at what the patient is receiving. The data in the previous sections indicate that many patients will be dissatisfied because they receive too little benefit.
Myth #6. Hearing aid fitting and adjustment by a professional will always increase patient satisfaction above the level of an aid that is not professionally fitted.
Hearing aids have been sold to consumers by mail for approximately 40 years. McLaughlin circulated a study (“Customer Satisfaction and Benefit with Direct-by-Mail Hearing Instruments,” unpublished study, 1995) of customers of two large mail-order companies (Excel Hearing Solutions of DeKalb, Ill, and Lloyd Hearing Aid Corp, of Rockford, Ill). Satisfaction with hearing aids purchased by mail was compared to the satisfaction of participants in a study of professionally fitted aids, using the same 34 criteria used by MarkeTrak.7 The 1,114 replies returned from a survey of direct-by-mail hearing aid users indicated that they were significantly more satisfied than purchasers of hearing aids through traditional channels. They tended to wear their hearing aids longer each day, were more likely to repurchase the same brand, and reported a higher quality of life than the MarkeTrak population.
It is reasonable to assume that their higher satisfaction rates reflected a judgment that a decent-quality hearing aid at a low cost was deemed better than a better-quality hearing aid at a higher cost. The assumption that they traded benefit for cost is supported by their APHAB benefit scores, which were significantly lower on nearly all items for the direct-by-mail consumers than for the MarkeTrak IV consumers. Overall average APHAB benefit scores were 23.3 vs 26.9, respectively. On the Ease of Communication (EC) subscale, the averages were 20.6 and 26.4, respectively. Those patients whose hearing aids had been selected and individually fitted by a dispensing professional reported the highest benefit, although all subjects reported benefit.
There are those whose incomes are so low that a traditional hearing aid is out of the question. For these people, an inexpensive over-the-counter (OTC) hearing aid has been proposed as a possible answer. In response to two Citizen Petitions submitted by Killion & Gudmundsen,29 and a subsequent article on OTC hearing aids that appeared in the Wall Street Journal,30 137 comments were received by letter or email. The substantial majority of comments were in favor of OTC hearing aids: 98% of the 63 consumers expressed support; 94% of the 17 MDs/educators were in favor; and 83% of the 18 from the hearing industry approved. Surprisingly, 49% of the 39 dispensing professionals who provided commentary were in favor of OTC hearing aids. Many expressed the intention to place such devices—if high quality—in their offices, and expressed a belief that it would ultimately be good for their practices. In contrast to these results, Kirkwood31 reported on an informal survey in which only 10% were “definitely” or “probably” in favor of an FDA category for OTC aids and 8% were “undecided.”
Conclusions
If satisfaction is not closely related to benefit in an easily measured sense, to what is it related? And what can be done to improve it?
All of us believe that we provide benefit and satisfaction, and that they are related—or we wouldn’t be in this business. And most of us believe that Myths #1 and #2 are true given proper technology and fitting. The writer and others have written on the importance of using improved technology to provide superior hearing-aid performance: wide bandwidth, smooth response, increased SNR using directional or close-talking microphones, WDRC, variable recovery time, undistorted reproduction of live music, etc.1,2
Part of the problem in relating the two is that—as in medicine—the charisma and counseling ability of the professional add greatly to the likelihood that his/her patients will be satisfied regardless of how well or poorly the hearing aid is fitted. Having said that, it is possible to clearly identify some of the things we have been doing wrong. It is satisfying to believe that correcting these things, combined with improved counseling on relearning how to hear in noise, will provide improved overall satisfaction as measured in some future survey. But this much we know: push-button fittings and doing without verification tests are not the best we can do.
Anecdotal evidence suggests to me that those dispensers who choose the best technology and truly understand the fitting process obtain satisfaction percentages in the region of 85%-90%—not 60%. This is consistent with Kochkin’s findings in surveys involving many practices across thousands of consumers (Kochkin, 2004; personal communication).
Work is underway to establish a “best practices” or “gold standard” protocol. As examples, Kochkin9 listed what might be viewed as 17 key components that need to be addressed in any model protocol. Ross32 provides an excellent consumer’s perspective of what he would expect from a good dispensing professional, including both objective tests and counseling. More recently, a feature session at the AAA convention looked at the need for employing consistent, evidence-based audiology in practices, and IHS published a model hearing instrument dispenser practice plan in The Hearing Professional (July-August 2004). Additionally, the IHAFF group is addressing evidence-based audiology practices at this year’s Jackson Hole Rendezvous.

|
Correspondence can be addressed to HR or Mead C. Killion, PhD, Etymotic Research, Elk Grove Village, IL 60007; email: [email protected].
References
1. Killion M. Myths that discourage improvements in hearing aid design. Hearing Review. 2004;11(1):32-40,70.
2. Killion M. Myths about hearing in noise and directional microphones. Hearing Review. 2004;11(2):14-19,72-73.
3. Valente M, Van Vliet D. The Independent Hearing Aid Fitting Forum (IHAFF) Protocol. Trends in Amplif 1997; 2(1):6-35.
4. Cox RM, Alexander GC. The Abbreviated Profile of Hearing Aid Benefit. Ear Hear. 1995;16:176-186.
5. Dillon H, Birtles G, Lovegrove R. Measuring the outcomes of a national rehabilitation program: Normative data for the Client Oriented Scale of Improvement (COSI) and the Hearing Aid User’s Questionnaire. J Am Acad Audiol. 1999;10:67-79.
6. Hearing Industries Assn. Quarterly Statistics Report for the Fourth Quarter 1994. Alexandria, Va: HIA;1995.
7. Kochkin S. 10-Year customer satisfaction trends in the US hearing instrument market. Hearing Review. 2002; 9(10):14-25, 46.
8. Hughson W, Thompson E. Hearing aids. Arch Otolaryngol. 1944; 39:245-249.
9. Kochkin S. On the issue of value: Hearing aid benefit, price, satisfaction and brand repurchase rates. Hearing Review. 2003;10(2):12-25.
10. Van Vliet D. User satisfaction as a function of hearing aid technology. Paper presented at: American Auditory Society Scientific/Technology Meeting, March 14-16, 2002, Scottsdale, Ariz.
11. Cox RM, Hyde M, Gatehouse S, Noble W, Dillon H, Bentler R, Stephens D, Arlinger S, Beck L, Wilkerson D, Kramer S, Kricos S, Gagne J-P, Bess F, Hallberg L. Optimal outcome measures, research priorities, and international cooperation. Ear Hear. 2000;21:106S-115S.
12. Cox RM, Alexander GC. Satisfaction with conventional versus high-tech hearing aids. Seminar presented at: IHCON-2000 Meeting, Lake Tahoe, Calif.
13. Cox RM, Alexander GC. Measuring satisfaction with amplification in daily life: The SADL scale. Ear Hear. 1999;20:306-320.
14. Wong LLN, Hickson L, McPherson B. Hearing aid satisfaction: What does research from the past 20 years say? Trends Amplif. 2003;7:117-161.
15. Larson V et al. Efficacy of three commonly used hearing aid circuits: A crossover trial. J Amer Medical Assn. 2000; 284 (14) [October 11]:1806-1813.
16. Humes L, Christensen L, Thomas T, Bess FH, Hedley-Williams A, Bentler R. A comparison of the aided performance and benefit provided by a linear and a two-channel wide dynamic range compression hearing aid. J Sp Lang Hear Res. 1999; 42(2);65-79.
17. Humes L. Dimensions of hearing aid outcome. J Am Acad Audiol. 1999; 10:26-39.
18. Walden B, Surr RK, Cord MT, Edwards B, Olson L. Comparison of benefits provided by different hearing aid technologies. J Am Acad Audiol. 2000;11:540-560.
19. Cox R, Alexander G. Hearing aid benefit in everyday environments. Ear Hear. 1991;12(2):127-139.
20. Villchur E. Signal processing to improve speech intelligibility in perceptive deafness. J Acous Soc Amer. 1973;53, 1646-1657.
21. Keidser G, Brew C, Peck A. Proprietary fitting algorithms compared with one another and with generic formulas. Hear Jour. 2003;56(3):28, 32-38.
22. Killion MC, Spankovich C, Schau N. Speechmap Measurements on Seven First Fit Digital Hearing Aids. Elk Grove Village, Ill: Etymotic Research; 2004.
23. Mueller HG, Killion MC. An easy method for calculating the Articulation Index. Hear Jour. 1990; 43(9):14-17.
24. Pascoe D. Frequency responses of hearing aids and their effects on the speech perception of hearing impaired subjects. Ann Otol Rhinol Laryngol. 1975; 84(Supplement 23):1-40.
25. Pascoe D. Hearing Aids: Who Needs Them? Big Bend Books, St. Louis; 1991.
26. Deming WE. Out of the Crisis. SPC PRESS, Knoxville, Tenn; 1982.
27. Hawkins DB, Cook JA. Hearing aid software predictive gain values: How accurate are they? Hear Jour. 2003;56(7):26-34.
28. Mueller HG: Fitting test protocols are “more honored in the breach than the observance.” Hear Jour. 2003; 56(10):19-26.
29. Killion M, Gudmundsen G. Citizen Petitions to the FDA. Submitted August 11, 2003.
30. Zimmerman A. The noisy debate over hearing aids; Why so expensive? Wall Street Journal; Mar 24, 2004:1.
31. Kirkwood D. Survey finds most dispensers bullish, but not on over-the-counter devices. Hear Jour. 2004; 57(3):19-28.
32. Ross M. Great Expectations…Regarding the performance of hearing aids. SHHH Jour. 1999; September/October:29-32.

