
Research | August 2016 Hearing Review
Despite the advantages and the popularity of hearing loop systems, there has been surprisingly little evidence-based research conducted to validate their benefits. This study examines whether hearing loop systems could improve speech understanding and perceived sound quality for listeners with normal hearing and hearing loss in a large area.
More than 36 million people in the United States have hearing loss.1 While hearing aids and cochlear implants compensate for the loss of hearing sensitivity and reduce background noise to a certain extent, the benefit of these devices are often limited in environments with high levels of background noise and reverberation, especially in large venues.
In theory, the hearing loop system can increase the signal level, reduce background noise and reverberation, and therefore increase the signal-to-noise ratio (SNR) in large listening areas. Yet limited evidence-based information is available to support the effectiveness and benefits of loop systems.
The primary goal of this study was to examine the benefits of a hearing loop system for listeners with normal hearing and with hearing aids in a large auditorium with poor acoustics when the participants listened to speech in noise while watching and listening to music and video clips.
Large-area Listening Systems
People with hearing loss require higher SNRs in order to recognize the same amount of speech as people with normal hearing.2,3 Although current hearing aids are often implemented with various noise-reduction strategies and directional microphones to improve speech understanding in background noise, hearing aid satisfaction in large areas remains relatively low compared to other listening conditions.4
Hearing aids have limited ability to improve speech understanding as the signal level decreases, as listening distance increases3,5 and the effectiveness of directional microphones also diminishes in reverberant environments.6-11 Assistive listening systems are designed to improve communication by increasing signal level, decreasing background noise and reverberation, and increasing the effective SNR in the transmitted signal.
Frequency modulated (FM) systems, infrared systems, digital transmission systems (eg, remote microphone clips), and hearing loop systems are four types of commonly used assistive listening systems. These systems often use a lapel microphone to pick up the desired signal and transmit the signal directly to the listener via radio wave, light wave, Bluetooth, or electromagnetic wave, respectively. FM, infrared, and digital transmission systems require the users to wear separately purchased receivers. Signals transmitted through hearing loop systems, however, can be picked up by telecoils that are already implemented in some hearing devices,5 making the hearing loop a convenient, cost-effective, low-maintenance, and inconspicuous option for large area amplification.
Loop systems and telecoils. Hearing loop systems, also known as audio-frequency induction loop systems, are one of the oldest large-area listening systems. The audio signal from the sound source (eg, microphone or public address system) is amplified and sent as an electromagnetic signal in the wire loop installed on the floor or the ceiling of a large area. The magnetic signal is then detected by personal listening devices, hearing aids, or cochlear implants with active telecoils.12
Telecoils are built into many hearing devices, and are often a standard feature in behind-the-ear (BTE) hearing aids and in all new cochlear implants. If it is not offered as a standard option, some hearing aid manufacturers provide remote accessories containing telecoils.13 The input signal from the telecoil either substitutes for (T mode) or is mixed with the microphone input (T+Mic mode), and the resulting output signal is amplified for the individual’s hearing loss, although the frequency responses of the telecoil mode may not be the same as the listening program for the microphone mode (Mic mode).
Telecoil orientation in hearing aids/CIs. The telecoil orientation is important in determining the strength of the detected magnetic signal. A telecoil is most sensitive to the signal carried in an induction system when the electromagnetic flux line in the induction system passes through the center opening of the telecoil. Assuming the person wearing hearing devices is sitting or standing upright, the telecoil is most sensitive to the induction loop system when it is placed vertically inside a hearing device (ie, the center opening of the coil is perpendicular to the hearing loop on the floor). For optimal telephone usage, however, the telecoil needs to be oriented horizontally because the center axis of the loudspeaker coil in the telephone is horizontal during phone conversations. In order to satisfy both criteria, some hearing device manufacturers place telecoils at a compromised 45° angle.14
Loop systems. Hearing loop systems are relatively cost-effective and require minimal maintenance because they allow listeners with telecoil-equipped hearing devices to use their own hearing device as the receiver.14 Once the hearing loop system is installed, there is no need for the user to remove the hearing devices or to use external receivers. Also, there is no need for management to allocate manpower to have and maintain hearing loop receivers in inventory, maintain or clean the receivers, or check the receivers in and out.15 Hearing loops also provide hearing aid users with a cosmetic and privacy option so that they are indistinguishable from the other members of the audience.13
Because of these advantages, telecoils are widely used in small or large venues, especially in Europe, to improve the audibility and increase the SNR of the signals for patrons with hearing loss. Places installed with hearing loop systems include train cars, ticket counters, public announcement systems, sports stadiums, grocery stores, theaters, courtrooms, auditoriums, airports, places of worship, home television rooms, drive thrus, elevators, buses, taxi cabs, museum exhibits, and reception desks.
Study Methods
A hearing loop system was installed by an experienced professional hearing loop dispenser in a university lecture hall. Speech understanding abilities of normal-hearing listeners and hearing aid users were measured using the Hearing in Noise Test (HINT)16 at two SNR levels (+3 and -3 dB). Perceived sound quality was assessed using HINT sentences, music samples, and sitcom television clips. Participants listened to the stimuli when the loop was turned on and off. The participants were also asked the amount of money they were willing to pay for a telecoil at the end of the testing session.
Listeners. As previous studies on a large area amplification system indicated that students with normal hearing benefited from the amplification systems,17,18 45 normal-hearing listeners (7 males, 40 females) ages 18-59 (mean = 27 years) were recruited to examine the benefits of the hearing loop in the lecture hall. All 45 normal-hearing listeners had pure-tone air conduction thresholds of ?25 dB HL at 500, 1000, 2000, and 4000 Hz using insert earphones (ER3-A).
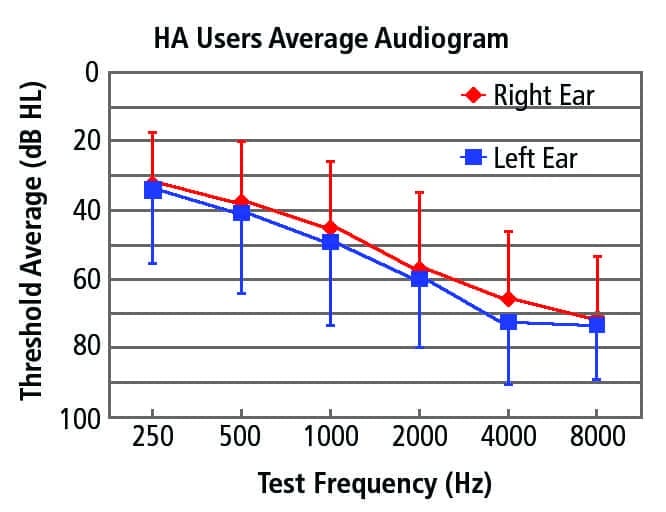
Figure 1. Left and right ear average air conduction hearing thresholds for hearing aid users. No response thresholds occurred from 2000-8000 Hz for some participants and were entered as the maximum audiometer outputs for the corresponding frequency before averaging. Error bars show the standard deviation.
A total of 26 bilateral hearing aid users (19 males, 7 females) with built-in telecoils in their hearing aids were recruited from the Northern Illinois University Hearing Clinic. Their ages ranged from 35-77 years (mean = 64). Participants’ hearing aids were from four manufacturers and included 13 BTE hearing aids, 10 receiver-in-the-ear (RITE) hearing aids, two in-the-ear (ITE) hearing aids, and one Bi-CROS hearing aid. Figure 1 shows their measured air conduction thresholds (ER3-A), and bone conduction thresholds were measured from 500-4000 Hz in octave intervals using a bone oscillator (B-71). The recorded NU-6 order-by-difficulty lists, an abbreviated 25-word list that was developed to predict 50-word list performance,19 were used at a most comfortable listening level to assess speech understanding in quiet. Convenience sampling was used to obtain all listeners.
Testing Site. A large lecture hall with relatively high reverberation (0.9 seconds) and background noise level (43dBA) was selected because of its poor acoustics. The room measured 143 square meters (13m x 11m) and seated 120 people in a stadium fashion with individual wood desks (Figures 2-3).
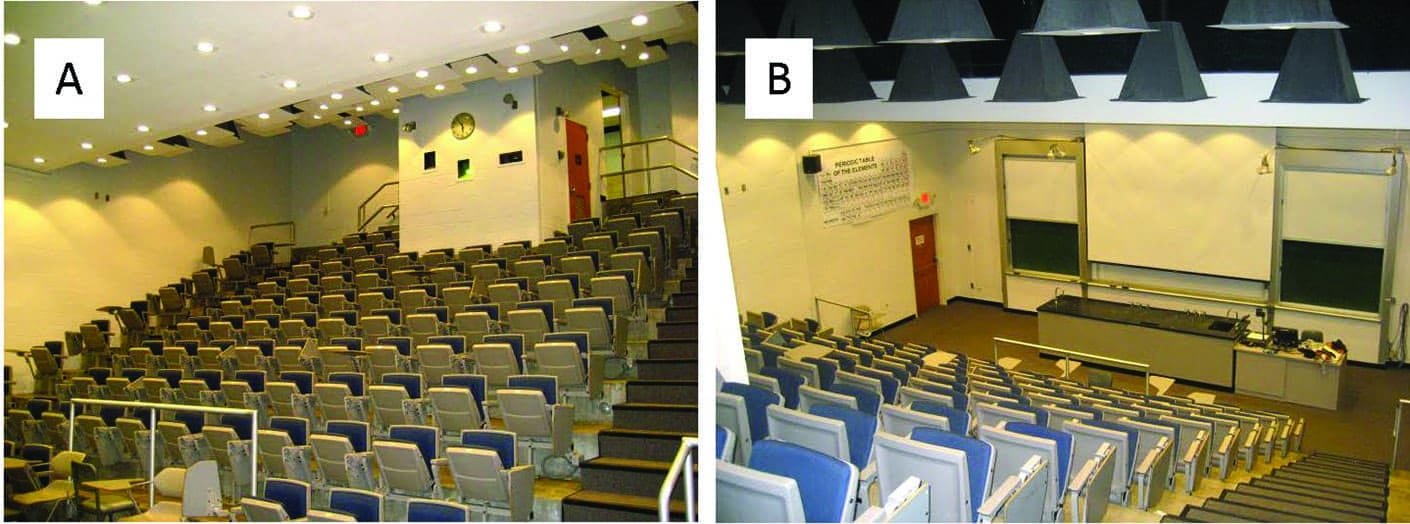
Figures 2a-b. Front and back views of the lecture hall.
The floor was primarily exposed concrete with some areas covered with industrial carpet. Blackboards and whiteboards covered the front wall of the lecture hall, while the remaining three walls consisted of concrete cinder blocks. Its floor construction was steel reinforced cast-in-place concrete. The average room reverberation time was measured by popping 10 balloons with a safety pin, a procedure commonly used to measure reverberation time in real-world environments. The reverberation time for the signal to decrease 60 dB (T60) was 0.9 seconds. The ambient noise level in the lecture hall was 43 dBA (A-weighted decibels) when the room was empty.
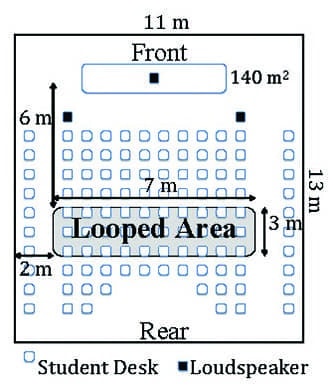
Figure 3. Lecture hall layout with installed perimeter style hearing loop. Speech was presented from the center loudspeaker and noise was presented from the sides.
Hearing loop calibration. A hearing loop system was installed in the lecture hall according to International Electrotechnical Commission (IEC) standards.12 The hearing loop system includes a lapel microphone, an audio induction loop driver (Ampetronic ILD1000G), and 18 American wire gauge (AWG) speaker wire. For the study, a wire encompassing a testing area of 21 square meters (7 x 3 meters) was installed approximately 6 meters from the front and 2 meters from the sides of the lecture hall and was taped securely to the floor with gaffer’s tape to reduce tripping hazard and wire movement (Figure 3).
The magnetic field strength, signal frequency response, and electrical noise within the looped area were measured using a field strength meter20 with the telecoil in the meter oriented and vertical position (see the online version of this article for details).
Sound-field calibration. Sound-field calibration was completed prior to evaluating listeners’ speech understanding abilities with and without using the hearing loop system. The SNRs of the HINT sentences and speech spectrum noise were adjusted to -3 and +3 dB. A -3 SNR presentation level was chosen because HINT protocol suggests people with normal hearing, on average, will score 50% correct on sentence identification in noise with a -3 SNR. A +3 SNR presentation level was chosen to avoid the potential floor effect at -3 dB SNR for the hearing aid users.
For calibration, the calibration noise for HINT sentences was presented from a computer via Audition 5 to a powered loudspeaker (Mackie SRM 420), which was located at 0° azimuth at the front and center of the lecture hall. A sound level meter (Quest Technologies SoundPro SE) was placed at the center of the looped testing area, 6 meters from the speaker. The input level of the Audition software and the powered loudspeaker was adjusted so the sound-level meter recorded 68 dB SPL.
Next, the calibration noise for the background noise was presented from another computer to two amplifiers and two loudspeakers located at 15° and 345° azimuth on the front sides of the lecture hall. The calibration of the noise level was measured separately for each loudspeaker. The input level of the amplifier was adjusted so the noise from each loudspeaker measured 62 or 68 dB SPL from the sound-level meter placed at the center of the looped testing area. Precaution was taken so the noise from the two loudspeakers was uncorrelated in order to avoid unrealistic enhancement of speech understanding in noise.21-23 The two noise tracks were then presented simultaneously. The combined noise level from the sound-level meter placed at the center of the looped testing area was 65 and 71 dB SPL, which corresponded to SNRs of +3 and -3 dB, respectively, for speech understanding testing.
Telecoil verification. Telecoil performance of the hearing aids was verified at the hearing clinic prior to testing. Hearing aids were connected to the manufacturer software in a hearing clinic prior to testing, and the telecoil function was added and/or verified using the simulated-in-box telecoil test function using real-ear measurement.24,25 The telecoil frequency response was compared to a 65 dB SPL acoustic microphone frequency response. The magnetic field strength produced in the test box was 56.2 mA/m, which was equivalent to the IEC specification (70 dB SPL = 100mA/m) when verified using the telecoil function.24 Although some hearing aid manufacturers allow frequency-specific telecoil gain adjustments to be made on their hearing aids, many other manufacturers did not provide this option. For consistency, we only allowed telecoil program volume adjustments per the listener’s request until the telecoil sound quality was satisfactory. Instructions and practices were also given to familiarize them with accessing the telecoil function on their hearing aid so that they knew how to turn on and off their telecoil during testing.
Speech recognition testing. Speech and noise were presented from three loudspeakers placed at 0° azimuth at the front center (speech) and at 15° and 345° azimuth, front sides (noise) at SNRs of +3 and -3 dB. Listeners with normal hearing were instructed to adjust the volume control on the receivers to their comfortable listening level during practice sessions. Listeners with hearing loss used the same telecoil setting as used in the hearing clinic.
During testing, the participants were instructed to write down what they heard after each presentation. HINT scores were calculated by number of words accurately identified. The two SNR conditions were evaluated with the hearing loop system turned on and off, for a total of four randomly selected 10-sentence lists. The assignment of the HINT lists and the order of the hearing loop on and off conditions were counterbalanced.
Preparation of stimuli for sound quality ratings. Listeners rated the listening effort, sound quality, loudness, pleasantness, naturalness, and overall preference of HINT sentences (6 music clips and 6 television clips) using a 5-point scale (eg, 1 = poor and 5 = perfect, or 1 = 0% and 5 = 100%). These sound quality dimensions were selected to examine different aspects of audition and listeners’ preferences.
Six 1-2 minute music video clips were selected from Lord of the Rings Symphony, the Final Lair scene in Phantom of the Opera, and Hallelujah performed by the Choir of King’s College in Cambridge (ie, two clips per genre). Music clips were included to simulate concert performance. Different aspects such as dynamic range, and types of instruments, timbre of vocalists, and amount of musical versus vocal elements were taken into consideration when deciding which music clip to include. These three musical genres were selected because hearing loops are commonly used in concert halls, music theaters, and houses of worship where people with hearing impairment report poor speech understanding.26
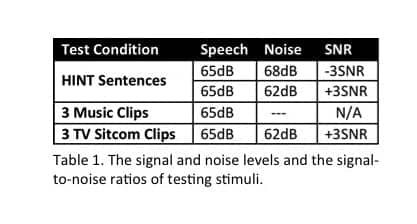
Table 1. The signal and noise levels and signal-to-noise (SNR) ratios of the testing stimuli.
Two 2-3 minute sitcom clips from I Love Lucy, The Cosby Show, and Seinfeld were selected. Television clips were included to simulate movie theater experiences. Different aspects such as dynamic range, compression, background noise, and varying speaker characteristics (eg, young female child, adult males and females, multi-talker situations, and non-English accent) were taken into consideration when deciding which sitcom clips to include.
Prior to testing, the RMS level of each music and television clip was measured using Audition 5 and adjusted so each clip had the same RMS level as the calibration noise of the HINT sentences (Table 1). This procedure allowed the investigators to use the same HINT calibration noise to calibrate the presentation levels of the clips in the large lecture hall.
Sound quality ratings. During testing, one music clip from each genre and one television clip from each sitcom were presented when the listeners’ hearing aids were adjusted to the telecoil mode, and the other clips were presented when the hearing aids were adjusted to the microphone mode. The clips used in the telecoil and the microphone modes were counter-balanced for different groups of listeners to avoid systematic error that might be introduced by potential differences between clips. The speech signal was presented at 68 dB SPL from the powered loudspeaker as measured from the sound-level meter placed at the center of the looped testing area. The video was viewed on a screen at the front of the lecture hall.
After each HINT sentence list, music presentation, and television sitcom was presented, a questionnaire was provided to each listener to assess sound of the clips they heard. Note that the questions provided to the normal-hearing and hearing aid user groups were slightly different in order to incorporate hearing aid satisfaction assessment in different listening environments for the hearing aid users.
Results
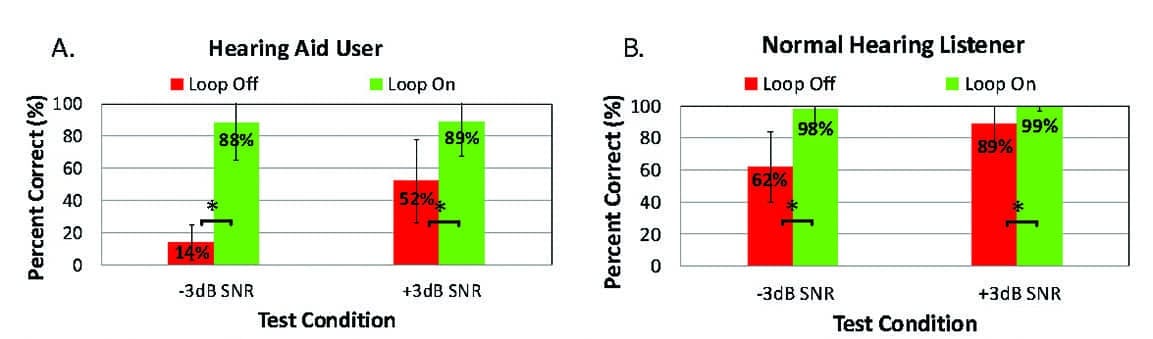
Figure 4. Average HINT scores for hearing aid users (A) and normal-hearing listeners (B) with the hearing loop turned off and on at -3 dB SNR and +3 dB SNR. *Asterisks mark significant conditions (p<.01). Error bars show the standard deviations.
Speech Understanding. A two (hearing aid user vs normal hearing) x two (loop on vs. off) x two (+3 vs. -3 dB SNR) multivariate analysis of variance (MANOVA) was conducted to examine the statistical differences of the speech understanding scores. Significant differences were reported for the main factors of Listener Group (p<0.01), Loop Setting (p<0.01), and SNR (p<0.01). Significant two factor interactions for the loop conditions between +3 dB SNR HINT and -3 dB SNR HINT were also reported (p<0.01).
Post hoc Tukey tests revealed significant statistical differences between normal-hearing listeners and hearing aid users (p<0.0033, p adjusted for the number of tests conducted), the Loop on and off conditions (p<0.0033), and the two SNRs (p<0.033). Summarized in Figure 4, the results indicated that:
1) Normal-hearing listeners obtained significantly higher speech understanding scores than hearing aid listeners;
2) Both groups revealed significantly improved speech understanding in noise when listening through the hearing loop system, and
3) Both groups also obtained significantly higher speech understanding scores at SNR of 3 dB than -3 dB in the loop on and off conditions.
Sound quality ratings. A two (hearing aid user vs. normal hearing listeners) x two (loop on vs. off) x three (speech vs. music vs. television) MANOVA was conducted for perceived speech understanding, listening effort, sound quality, pleasantness, and naturalness. Significant differences were revealed for the main factors of Listener Group (p<0.01), Loop setting (p<0.01), and Listening Condition (p<0.01). Significant two factor interactions for the test conditions between speech and music clip presentations, between the music clip and television clip presentations, and between HINT and television presentations were also found (p<0.01).
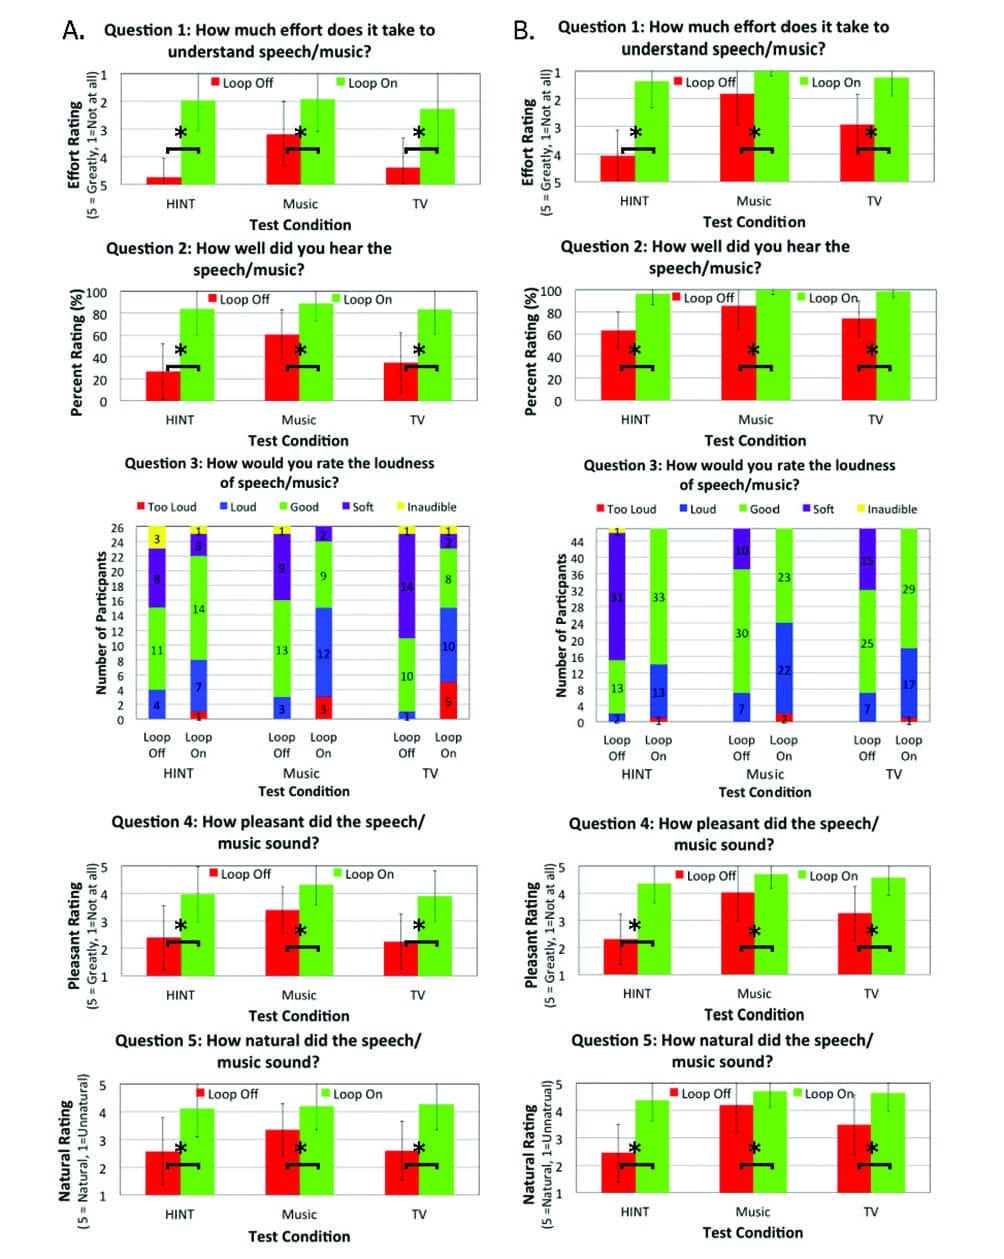
Figure 5. Answers to questions from hearing aid users (Column A) and normal-hearing listeners (Column B). *Asterisks mark significant conditions (p<.01). Error bars show the standard deviations.
Post hoc Tukey tests reported significant differences between normal-hearing listeners and hearing aid users (p<0.0033, p adjusted for the number of tests conducted, F=), between the loop on and off conditions (p<0.0033), and between the three listening conditions (p<0.033). These results indicated that when the hearing loop system was on, normal hearing listeners and hearing aid users perceived:
1) Reduced listening effort;
2) Improved understanding of speech and music;
3) More pleasant and natural sounds; and
4) Better overall sound quality (Figure 5).
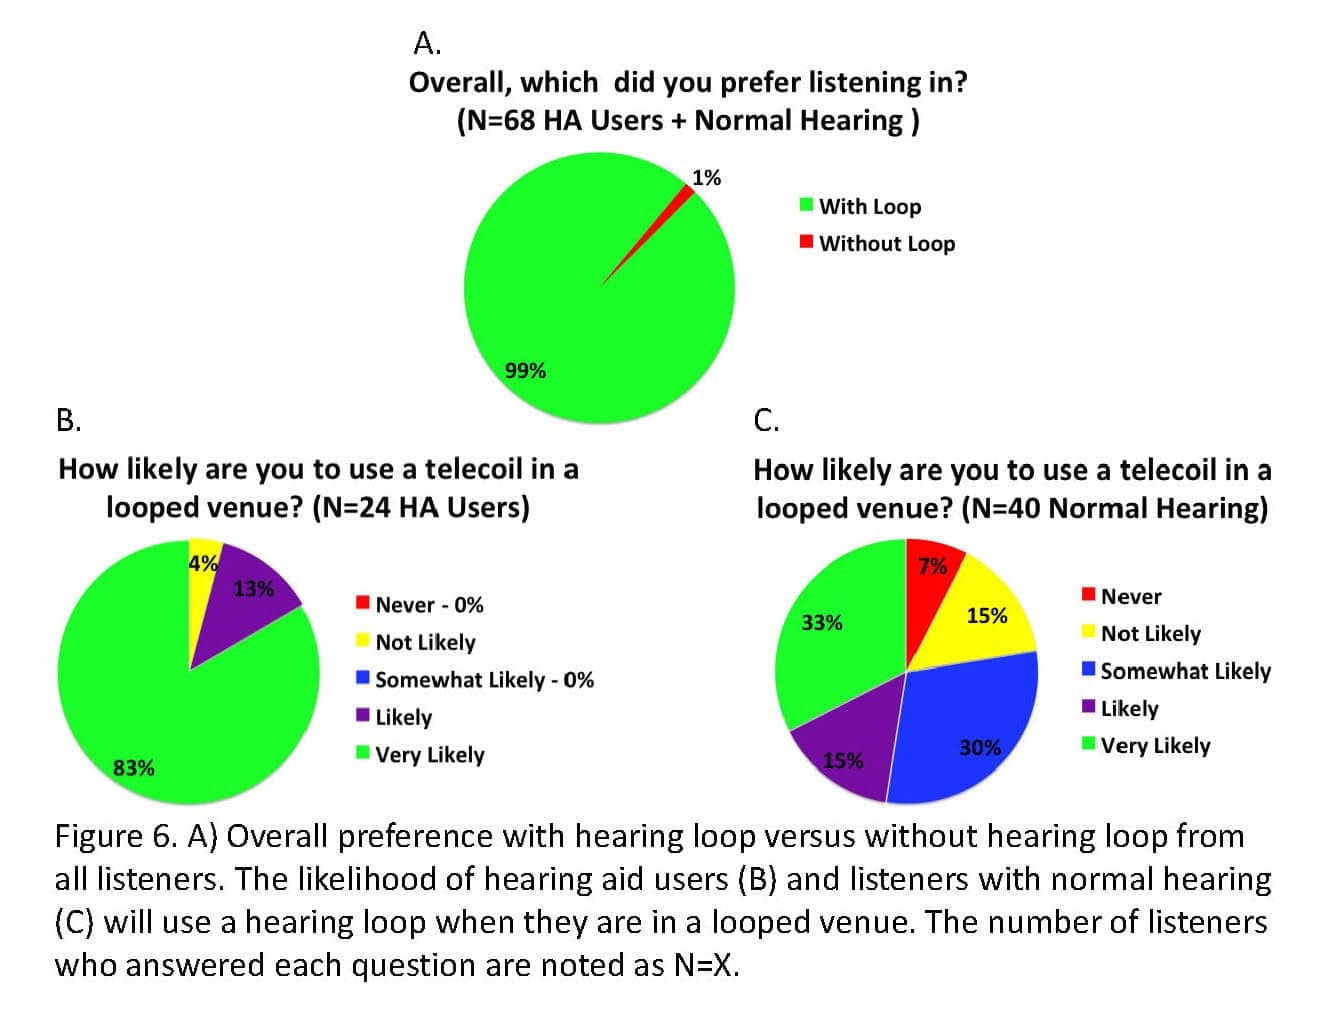
Figure 6a-c. A) Overall preference with hearing loop versus without hearing loop from all listeners. The likelihood hearing aid users (B) and listeners with normal hearing (C) will use a hearing loop when they are in a looped venue.
Nearly all participants (99%) preferred using the hearing loop system when listening in the large lecture hall. Nearly half of normal-hearing listeners and 9 of 10 hearing aid users reported they were very likely or likely to use a hearing loop when one was installed (Figure 6). Of those who responded, over half of both test groups were willing to spend between $50 and $500 on a telecoil in order to use a hearing loop system (Table 2).
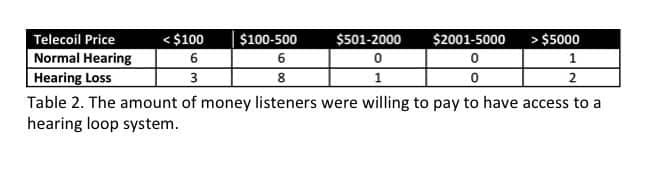
Table 2. The amount of money (in dollars) listeners were willing to pay to have access to a hearing loop system.
Discussion
Both listener groups obtained significantly better speech understanding scores with the loop on than off. The percent correct for the listeners with normal hearing improved 36% (SD) in the -3 dB SNR HINT condition (62% to 98% correct) and 10% (SD) (89% to 99% correct) in the +3 dB SNR HINT condition. The percent correct for the listeners with hearing aids improved 74% (SD) (14% to 88% correct) in the -3 dB SNR HINT condition and 37% (SD) (52% to 89% correct) in the +3 dB SNR HINT condition.
Both listener groups reported significantly higher ratings in all sound quality rating dimensions when the loop was turned on, except loudness. On a scale of 1-5, listeners with normal hearing reported on average:
1) The effort required to understand speech and music was reduced 2.70 points (SD) on the HINT sentences, 0.81 points (SD) on the music clips, and 1.70 points (SD) on the television clips;
2) The pleasantness of the speech and music improved 2.07 points (SD) on the HINT sentences, 0.68 points (SD) on the music clips, and 1.32 points (SD) on the television clips; and
3) The naturalness of the speech and music improved 1.92 points (SD) on the HINT sentences, 0.51 points (SD) on the music clips, and 1.17 points (SD) on the television clips.
In addition, normal-hearing listeners perceived speech and music understanding increased 34% (SD) on the HINT sentences, 13% (SD) on the music clips, and 24% (SD) on the television clips on a scale of 1-100%.
The results of listeners with hearing aids were similar. On a scale of 1-5, they reported on average:
1) Their effort was reduced 2.77 points (SD) for HINT sentences, 1.27 points (SD) for the music clips, and 2.12 points (SD) for the television clips;
2) The pleasantness of sounds improved 1.58 points (SD) on HINT sentences, 0.92 points (SD) on the music clips, and 1.65 points (SD) on the television clips; and
3) The naturalness of sounds improved 1.54 points (SD) on the HINT sentences, 0.85 points (SD) on the music clips, and 1.67 points (SD) on the television clips.
Additionally, their perceived speech understanding was increased 57% (SD) on the HINT, 28% (SD) on the music clips, and 49% (SD) on the television clips. Almost all participants, except one normal-hearing listener, preferred listening through a hearing loop system.
These results indicate that the hearing loop system was effective in helping listeners with and without hearing loss improve speech understanding and perceived sound quality in a large and reverberant lecture hall with and without background noise present.
Study Limitations
Ratings of loudness preference were not found to be significant because the testing protocol did not define whether louder or softer was desirable. The desired preference of each listener, therefore, could not be determined (it was unclear whether louder [4 or 5] was better or whether it was too loud.) Future studies are needed to study the effect of hearing loop systems on perceived loudness, with a clear definition of desirable loudness on the rating scale.
Hearing loop systems are very common in European countries. In the United States, there is currently a joint “Let’s Loop America” initiative led by the American Academy of Audiology and the Hearing Loss Association of America. The initiative aims to make hearing loops commonplace in public venues across the nation. It is important to note that hearing loop systems should always be installed by skilled professionals to ensure the electromagnetic field is maintained within the loop, all metal loss has been accounted for, distortion is limited, and the field strength is relatively equal at all locations within the loop to ensure maximum benefit. An experienced installer should be able to assess how the hearing loop will be used in a particular venue considering factors such as whether the users will be seated, standing, or walking around. The loop wire must be placed above or below the listening plane/ear level, which is usually at 1.2 m when listeners are seated. If the wire is placed at the level of hearing aids, large fluctuations in signal loudness can occur within the looped area. The ideal placement is either the floor or the ceiling, discreetly placed behind decorative features, underneath carpeting, within a suspended ceiling, or dropped in a routed floor groove.20
“Metal loss” is another concern. When metal is contained within a site’s construction, the hearing loop system’s electromagnetic signal is reduced, resulting in metal loss. Sound quality is affected because the high frequencies are attenuated disproportionally more than the low frequencies, and signal strength is reduced unevenly across the listening plane.20,27 Thus, the impact of metal loss needs to be measured with a field strength meter and addressed using proper hearing loop design, such as incorporating a larger amplifier or a phased array loop configuration.20
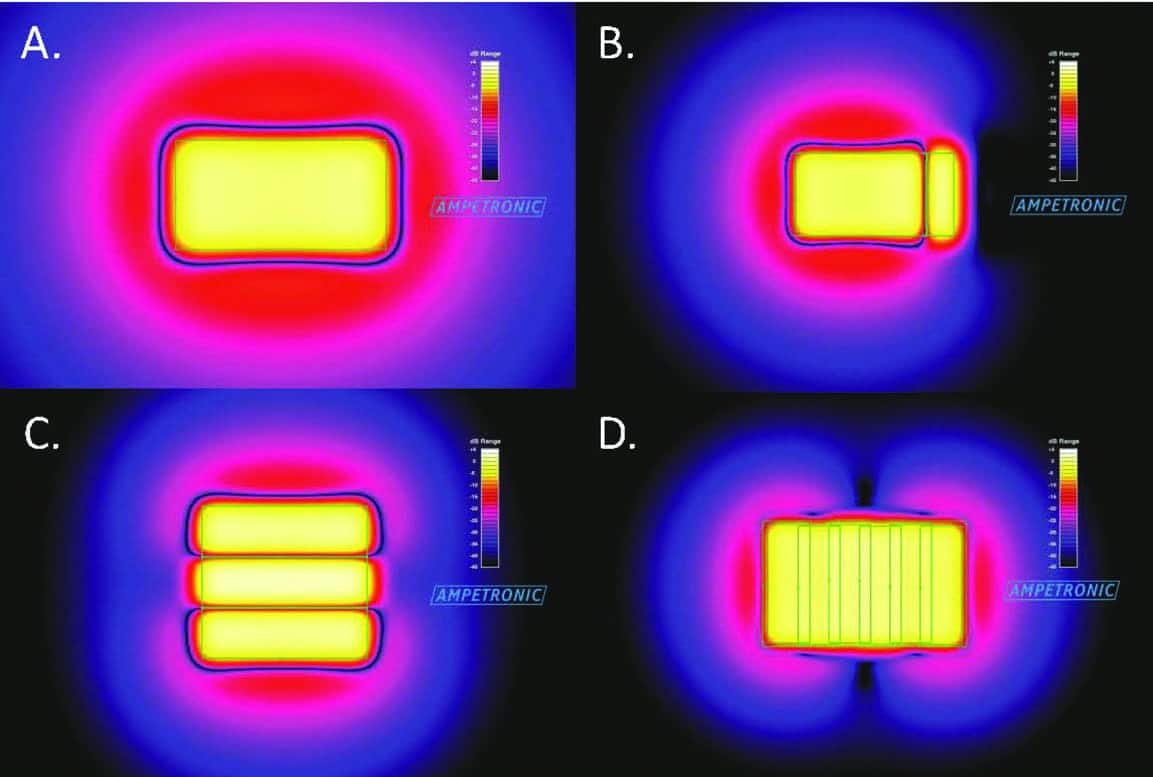
Figure 7a-d. Four examples of hearing loop designs: A) Perimeter loop; B) Cancellation loop; C) Single array loop, and D) Standard phase array loop. Black indicates the field strength is -40 dB below the target feld strength, effectively background noise only. Yellow areas meet the target field strength, while white exceeds it. Green lines show the loop cables and arrows indicate the direction of electrical current. Courtesy of Ampetronic.
A hearing loop can be installed in many configurations to maximize signal strength and quality. For most loop systems, the maximum magnitude of electromagnetic energy is measured within the perimeter of a hearing loop. A null line exists just outside the wire of the hearing loop system and the electromagnetic field magnitude drops off rapidly outside the loop perimeter.
A skilled installer can assess which loop configuration to use in order to overcome metal loss and contain potential magnetic field overspill for security reasons. In general, there are four commonly used hearing loop system designs (Figures 7a-d). The online version of this article outlines each of the designs and their applications.
The results of this study are encouraging. With a properly installed hearing loop system, both normal-hearing listeners and hearing aid users benefit from using the hearing loop system. Doing so significantly improves speech understanding, perceived understanding of speech and music, pleasantness and naturalness of sounds, and ease of listening in a large lecture hall.
Hearing care providers should consider the utilization of telecoils and hearing loop systems, and counsel their patients on how to maximize the use of telecoils in everyday listening situations.
Acknowledgements
This research was funded by The David & Carol Myers Foundation, GN ReSound, and Listen Technologies. Portions of this paper were presented at the 3rd International Hearing Loop Conference, Eastbourne, England, October 7, 2013. Special thanks to Steve Thunder, BSE, COHC, with Assistive Hearing Systems LLC, for helping install the hearing loop system in the lecture hall and for continuous technical support to make this research possible.
References
-
National Institute on Deafness and Other Communication Disorders (NIDCD). Statistics and epidemiology: Quick statistics. Retrieved from National Institute on Deafness and Other Communication Disorders. Bethesda, Md: NIDCD;2010. Available at: https://www.nidcd.nih.gov/health/statistics/quick-statistics-hearing
-
Valente M. Use of microphone technology to improve user performance in noise. Trends Amplif. 1999;4(3):112-135.
-
George E, Goverts T, Festen J. Measuring the effects of reverberation and noise on sentence intelligibility for hearing-impaired listeners. J Speech Lang Hear Res. 2010;53(6):1429-1439.
-
Kochkin S. MarkeTrak VIII: Consumer satisfaction with hearing aids is slowly increasing. Hear Jour. 2010;63(1):19-32.
-
Anderson K, Goldstein H. Speech perception benefits of FM and infrared devices to children with hearing aids in a typical classroom. Lang Speech Hear Ser. 2004;35:169-184.
-
Studebaker G, Cox R, Formby C. The effect of environment on the directional performance of headworn hearing aids. In: Studebaker G, Hochberg I, eds. Acoustical Factors Affecting Hearing Aid Performance. Baltimore, MD: University Park Press;1980.
-
Hawkins D, Yacullo W. Signal-to-noise ratio advantage of binaural hearing aids and directional microphones under different levels of reverberation. J Speech Hear Disord. 1984;49:278-286.
-
Ricketts T, Dhar S. Aided benefit across directional and omni-directional hearing aid microphones for behind-the-ear hearing aids. J Am Acad Audiol. 1999;10(4):180-189.
-
Ricketts T. Directivity quantification in hearing aids: Fitting and measurement effects. Ear Hear. 2000;21:45-58.
-
Ricketts T, Hornsby B. Distance and reverberation effects on directional benefit. Ear Hear. 2003;24(6):472-484.
-
Chung K. Challenges and recent developments in hearing aids. Part I. Speech understanding in noise, microphone technologies and noise reduction algorithms. Trends Amplif. 2004;8(3):83-124.
-
International Electrotechnical Commission (IEC). IEC 60118-4:2014: Electroacoustics-Hearing aids-Part 4: Induction-loop systems for hearing aid purposes-System performance requirements. Geneva, Switzerland:IEC. Available at: https://webstore.iec.ch/publication/798
-
Sheehan J. Understanding hearing loops. December 5, 2011. Available at: http://www.audiologyonline.com/articles/understanding-hearing-loops-794
-
Ross, M. Telecoils: The powerful assistive listening device. Hearing Review. 2002; 9(9):22-26,57. Available at: https://hearingreview.com/2002/09/telecoils-the-powerful-assistive-listening-device
-
Ross M. Telecoils are about more than telephones. Hear Jour. 2006;59(5):24-28.
-
Nilsson M, Soli SD, Sullivan JA. Development of the Hearing in Noise Test for the measurement of speech reception thresholds in quiet and in noise. J Acoust Soc Am. 1994;95(2):1085-1099.
-
Crandell C, Smaldino J. (Classroom acoustics for children with normal hearing and with hearing impairment. J Speech Lang Hear Ser. 2000;31:362-370.
-
Kreisman B, Crandell C. Frequency modulation (FM) systems for children with normal hearing. July 29, 2002. Available at: http://www.audiologyonline.com/articles/frequency-modulation-fm-systems-for-1166
-
Hurley R, Sells J. An abbreviated word recognition protocol based on item difficulty. Ear Hear. 2003;24(2):111-118.
-
Ampetronic. Installation Guide. Retrieved from Newark, UK: Ampetronic Ltd;2014.
-
Cox H. Line array performance when the signal coherence is spatially dependent. J Acoust Soc Am. 1973;54:1743.
-
Francart T, Wouters J. Perception of across-frequency interaural level differences. J Acoust Soc Am. 2007;122(5):2826-2831.
-
Benesty J, Chen J, Arden Huang Y, Gaensler T. Time-domain noise reduction based on an orthogonal decomposition for desired signal extraction. J Acoust Soc Am. 2012;132(1):452-464.
-
Audioscan. Verifit User’s Manual. Dorchester, Ontario, Canada: Audioscan. June 2016. Available at: https://www.audioscan.com/Docs/vf2manual.pdf
-
Teder H. Quantifying telecoil performance: Understanding historical and current ANSI standards. Sem Hear. 2003;24(1):63-70.
-
Tierney J. A hearing aid that cuts out all the clatter. The New York Times. October 23, 2011. A14. Available at: http://www.nytimes.com/2011/10/24/science/24loops.html?_r=0
-
Sturma A. Ampetronic ILD1000G Peer Review. March 30, 2009. Available at: http://www.inavateonthenet.net/features/article/peer-review—ampetronic-ild1000g

Correspondence can be addressed to Dr Sterkens at: [email protected]
Original citation for this article: Faivre RM, Ismail F, Sterkens J, Thunder T, Chung K. Effects of Hearing Loop Systems on Speech Understanding and Sound Quality of Normal-hearing Listeners and Hearing Aid Users. Hearing Review. 2016;23(8):28.


thanks so much! I get so tired of hearing that loops and t-coils are “long in the tooth” (quoting a high-level BT alpha-geek), and that many hard-of-hearing people don’t need them. You think we don’t need them? Just try making sense out of the PA system at 31st street Amtrak Station in Philadelphia. The normal-hearing people have no idea what’s being said, either.
Thank you for this absolutely wonderful study confirming how what’s old is now new and simply amazing.