RESEARCH | Smartphone-based Apps | December 2013 Hearing Review
Utility of Smartphone-based Hearing Aid Applications as a Substitute to Traditional Hearing Aids
Study suggests that a smartphone app provides adequate temporary/starter solution
By Amyn M. Amlani, PhD; Brian Taylor, AuD; Charla Levy; and Rachel Robbins
The historically low hearing aid adoption rates in the United States stem from constricted consumer-purchasing behavior. When these behaviors are quantified using the price elasticity of demand (?), the relationship between price and quantity demanded is inelastic (? < |1.0|). Historically, demand for hearing aids ranges between -.31 and -.54 for the years 1980 to 2008.1
Improving hearing aid adoption rates is contingent on the profession and industry implementing strategies that highlight diagnostic and rehabilitative services, and various treatment options. From an economic standpoint, such strategies include improving brand loyalty through standardized clinical service delivery,2,3 implementing a transparent (ie, unbundled) pricing strategy,4 and, most importantly, providing substitute products that offer similar features and outcomes to traditional products.5
In this paper, we address the issue of whether a substitute product—namely, smartphone-based hearing aid applications—can serve as an alternative treatment option to the traditional hearing aid. Theoretically, smartphone-based hearing aid applications offer several advantages that promote an increase in demand:
1) Use of a smartphone as a proxy hearing aid is not limited by the negative perceptions associated with stigma.
2) Smartphone-based hearing aid applications offer the end user a less-restrictive service delivery model, while increasing the patient decision-making process.
3) Use of a smartphone-based hearing aid application increases hearing awareness.
4) Smartphone-based hearing aid applications offer global accessibility and lower prices to those who cannot afford, or have restricted access to, traditional amplification.
5) Most importantly, smartphone-based amplification offers impaired listeners the advantage to temper declines in cognitive function stemming from prolonged auditory desensitization6,7 that, on average, spans 5 to 7 years.8
Despite these advantages, there is no evidence to support the notion that a smartphone-based hearing aid application can serve as a substitute to the traditional hearing aid. That is the purpose of the proposed study. Specifically, the proposed study compares the aided subjective (as measured by self-assessment responses of benefit, improving quality of life, and satisfaction) and aided objective (as measured by speech-recognition in noise) performance obtained on a group of hearing-impaired listeners between two smartphone-based applications and a traditional hearing aid.
Methods
|
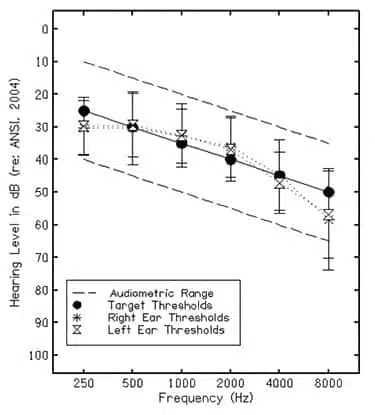
| Figure 1. Target thresholds, audiometric range, and mean audiometric thresholds (±1 standard deviation) for participants |
Participants
We recruited one group of 18 participants based on an a priori power analysis (within-factors MANOVA with repeated measures: alpha = .05, power = .8). All participants were recruited from the greater Dallas-Fort Worth metropolitan area, based on the following criteria: 1) age between 50 and 90 years, 2) demonstrate a bilateral mild-to-moderately severe sensorineural hearing loss, 3) demonstrate <3 months=”” experience=”” with=”” amplification=”” devices=”” and=”” 4=”” pass=”” a=”” cognitive=”” screening=”” task=”” mini-mental=”” state=”” examination=”” mmse=”” score=”” of=”” 27=”” or=”” higher=”” ie=”” maximum=”” is=”” 30=”” sup=””>9 Figure 1 displays target thresholds, audiometric range, and mean audiometric thresholds (±1 standard deviation) for participants’ right and left ears.
Amplification
During the investigation, each participant was tested with a traditional hearing aid and two smartphone-based applications installed on an Apple iPod Touch (4th Generation). The two smartphone-based hearing aid applications assessed were Ears (Ear Machine, LLC) and Microphone (PocketLab), both of which were downloaded from iTunes. Both applications allow the user to adjust gain by means of a volume control, and the Ears application further allows the user to manipulate the frequency response of the left and right channels either collectively or independently in real time. The iPod’s output was delivered by means of a hardwired in-ear headphone with an inline microphone (Klipsch Image S4i). The headphone was coupled to the iPod audio jack by means of a standard 3.5-mm connector. The headphone was fit with open domed tips to reduce the occlusion effect perceived by participants, and the inline microphone served as the input transducer to the iPod.
The bilateral devices used in this study were Unitron Shine + Moda II 312, behind-the-ear (BTE) hearing aids fit with open domed tips. This economy-line digital hearing aid features 3 memories, speech enhancement, omni- and directional-microphone, feedback management, and noise reduction in 4 channels and 8 bands. The device also allows for either wide-dynamic range or linear-limiting compression. Manufacturer specifications indicate a high-frequency average (HFA) output and gain of 109 dB SPL and 33 dB, respectively, for this device.
Prior to experimental testing, each participant was counseled on the features of the smartphone-based applications and the BTE devices. The Ears application was configured so that participants could only adjust the frequency-gain response collectively for the left and right channels. During testing, the smartphone-based hearing aid application under investigation was placed on the front page by itself and the iPod was placed in airplane mode to prevent accessibility to other online applications. In addition, participants positioned the inline microphone component of the headphone to their shirt/blouse at the mid-point region of their sternum using a plastic clip.
Each participant’s BTEs were programmed to their audiometric thresholds, with target gain predicted by the NAL-NL1 prescriptive formula. To avoid biased judgments between smartphone-based applications and the hearing aid stemming from differences in signal processing capabilities, the hearing aid’s advanced features were disabled.
Speech-in-noise performance
Unaided and aided speech-intelligibility performance in noise was evaluated using the Connected Speech Test (CST). The CST consists of 28 passage pairs (24 test and 4 practice pairs), with each passage pair containing 50 key words. Passage pairs are equivalent in difficulty for normal-hearing10 and hearing-impaired listeners11 in quiet and in noise. The CST is scored by determining the percentage of key words correctly identified. Prior to data analysis, the percentage was converted to rau scores.12
In this study, each participant was presented 4 CST passages per aided condition at a fixed signal-to-noise ratio (SNR) of 0 dB, based on a pilot study that revealed roughly 50% intelligibility in a sample of normal-hearing listeners. During the experiment, participants were seated in the center of a sound-treated room having a reverberation time of 208 msec. The speech signal was presented at a distance of 1 meter from a loudspeaker positioned at 0° azimuth relative to the participant, while the competing noise was presented simultaneously at a distance of 1 meter from 3 loudspeakers located at the azimuths of 90°, 180°, and 270°.
Surveys
Three surveys were utilized in this study. Self-perceived benefit for hearing aid use was measured using the Abbreviated Profile of Hearing Aid Benefit (APHAB).13 The second survey administered to participants was the International Outcome Inventory for Hearing Aids (IOI-HA).14 The third survey provided to participants was a 15-question survey that assessed perceived satisfaction provided by each aided condition, as well as perception regarding each condition’s features and sound quality. Questions for this survey were adopted from various MarkeTrak surveys with each participant providing magnitude-estimation responses ranging from 0 (no perceived satisfaction) to 100 (complete perceived satisfaction).
Procedures
At the initial session, we obtained responses to the unaided portion of the APHAB and assessed the participant’s unaided speech-intelligibility performance in noise. Prior to the fitting of either the hearing aid or iPod, electroacoustic measurements were made by mounting the BTE or headphone receiver to an HA-1 coupler. In the case of the headphone, measurements were made using the inline microphone with separate electroacoustic measurements obtained for the left and right receivers. During electroacoustic testing, the hearing aid was programmed to test mode.
Test mode for both smartphone-based applications consisted of the volume control setting placed at maximum volume, and with the frequency-gain response set to flat (ie, center position on the grid) for the Ears application. A given aided condition was then fit on the participant based on a Latin square design, and real-ear aided responses were then obtained at input levels of 50, 65, and 80 dB SPL. During objective testing, subjects were permitted to set the volume control of the smartphone-based applications to their preferred setting, and for the Ears application, testing occurred at the subject’s preferred frequency-gain response. Lastly, each participant was counseled on how to operate that device and a second session was scheduled a minimum of 2 weeks later, but no more than 3 weeks later.
At the second session, participants completed the aided portion of the APHAB for the device used during the previous trial period and completed the IOI-HA and the satisfaction survey based on their aided experiences. Electroacoustic measures were then obtained, followed by aided speech-intelligibility performance in noise and real-ear measures. After data collection, the participant was fit with the second aided condition and counseled on how to operate that device. A third session was scheduled a minimum of 2 weeks later, but no more than 3 weeks later.
Testing at the third session was identical to that of the second aided session. At the conclusion of the third session, the participant was fit with the remaining aided condition and counseled on how to operate that device.
A fourth session was scheduled a minimum of 2 weeks later, but no more than 3 weeks later. Data collection at the fourth and final session mirrored the previous two appointments. At the conclusion of this session, participants were provided the Unitron hearing aids as a honorarium.
Results: Electroacoustic Measures
Electroacoustic measures were made prior to dispensing of an amplification condition and upon the return of the device at the conclusion of a trial period. Hearing aids were coupled to the 2cc coupler in the traditional manner. Electroacoustic measures of the iPod were made by coupling the receiver portion of one channel to the 2cc coupler via Fun-Tack, and then repeating the measurement on the other channel. During the measurement, the volume control for each smartphone application was set to full-on. The Ears application, which allowed the user to adjust the frequency response in real time, was set to the flat position during electroacoustic testing.

|
|
Figure 2. Mean high-frequency average output saturation sound pressure level (HFA-OSPL90, in dB SPL) results for the traditional hearing aid (HA) and iPod Touch device installed with both smartphone applications (Ears, Microphone) |

|
| Figure 3. Mean high-frequency average full-on gain (HFA-FOG, in dB) results for the traditional hearing aid (HA) and iPod Touch device installed with both smartphone applications (Ears, Microphone) |
Figures 2 and 3 show the mean high-frequency average (HFA) 2cc coupler output (OSPL90) and full-on gain (FOG) results, respectively, for the three aided conditions as a function of left and right ears. As seen in Figure 2, mean HFA-OSPL90 for the hearing aid was consistent with manufacturer specifications (ie, 109 dB SPL), but produced a mean output that was 5 dB less than the mean OSPL90-HFA measured for both smartphone applications. This finding was statistically significant (F2,102 = 99.32, p < .001). No significant differences (p > .05) were found between ears.
Figure 3 depicts mean HFA-FOG across amplification conditions and ears. Here, mean FOG for the hearing aid was also consistent with manufacturer’s specifications (ie, 33 dB). Results for the Ears application yielded similar mean gain results to the hearing aid (p < .05), while the microphone application provided significantly less gain—about 5 dB—compared to the other aided conditions (F2,102 = 47.03, p < .001). No significant differences (p > .05) were found between ears.
Audibility
Audibility was quantified using the Ao(4) method.15 In this method, audibility is quantified on a scale from 0.0 to 1.0, with values closer to 0.00 representing fewer speech cues audible to the listener and values closer to 1.00 representing more speech cues audible to the listener. Audibility is sometimes shown as a percentage and derived by multiplying the audibility value by 100.
Audibility is determined using an audiogram, where speech cues important to speech recognition range between 20 and 50 dB (ie, 30 dB dynamic range of speech) and from 500 to 4000 Hz in octave bands. Audiometric thresholds less than 20 dB HL (ie, closer to 0 dB HL) provide 30 dB of audibility, while audiometric thresholds over 50 dB HL provide 0 dB of audibility. Audibility for audiometric thresholds between 20 and 50 dB HL is determined by subtracting the threshold, at a given frequency, from 50 dB HL. The amount of audibility available to listeners is calculated by summing the values obtained at the four octave bands (ie, 500 to 4000 Hz) and dividing by 120, which is the maximum number of audible decibels. Table 1 indicates that mean unaided audibility for subjects in this study was 0.54 and 0.50 for the right and left ears, respectively.
Audibility was also calculated for each of the three aided conditions, by transforming each participant’s REAR data to real-ear aided gain (REAG; derived as REAR minus input signal [ie, 65 dB in this study]) and subtracting the real-ear unaided gain (REUG) at the four octave-band frequencies. These transformations resulted in real-ear insertion gain (ie, REIG = REAG-REUG), which was then subtracted from the unaided thresholds. Mean aided audibility is shown in Table 1.

|
| Table 1. Amount of audibility provided by the three aided conditions compared to the unaided condition. |
A two-way repeated-measures ANOVA was run for the independent variables of listening condition (ie, unaided, hearing aid, Ears, Microphone) and ears (ie, right, left) as a function of audibility. Results revealed a statistically significant main effect for listening condition (F3,32 = 56.25, p < .001). Post hoc results revealed that audibility was significantly improved in each of the three aided conditions over the unaided condition. In addition, aided audibility was found to be statistically similar (p > .05) between the bare-bones hearing aid and the Microphone application.
Statistically, the Ears application provided subjects with significantly (p < .05) more audibility than the hearing aid and Microphone application. This finding was not surprising given that subjects were able to adjust the frequency-gain response to their listening preference. No statistical significance was found between ears (p > .05).

|
|
Figure 4. Mean rau speech performance in noise by participants while wearing the traditional hearing aid (HA) and iPod Touch device installed with both smartphone applications (Ears, Microphone) |
Speech-in-noise performance.
Speech-intelligibility performance in noise was examined using a one-way repeated-measures analysis of variance (ANOVA). Results are displayed in Figure 4. Overall, findings indicated that the three aided conditions significantly improved the participant’s ability to hear speech passages presented against a competing noise compared to the unaided condition (F3,15 = 23.95, p < .001).
A post hoc analysis, however, failed to find significant differences between the hearing aid and both smartphone-based applications. This finding suggests that a bare-bones hearing aid and a smartphone hearing aid application provided the listener with similar performance under the conditions used in this study. However, this finding must be tempered given the differences in microphone placement between the hearing aid and headphones coupled to the iPod.
Results: Surveys
APHAB
We compared clinically significant benefit between amplification schemes at the 90% confidence interval. Specifically, clinical significance occurs when there is a difference of 1) Less than 22% between conditions on a single subscale, or 2) When scores for the subscales of EC, RV, and BN each are 5% better across conditions.11 Results are plotted in Figure 5.

|
| Figure 5. Mean frequency of problems reported by participants on the four subscales of the Abbreviated Profile for Hearing Aid Benefit. Key: Unaided = red solid line; Hearing aid (HA) = black solid line; Ears = dashed black line; Microphone = dash-dot black line |
For conditions on a single subscale, both the Ears and Microphone applications neared clinical significance as each condition reduced the mean frequency of problems by 19.63% and 21.36%, respectively, compared to the unaided condition. In addition, the Ears and Microphone applications did provide clinically significant benefit compared to the unaided condition, with differences of 24.76% and 26.47%. The hearing aid condition did not reach clinical significance for any of the single subscales when compared to the unaided condition. Further, mean benefit among amplification conditions was not clinically significant for any single subscale.
Results did reveal that all three amplification conditions provided at least 5% improvement in the three subscales of EC, RV, and BN compared to the unaided condition (Figure 5). This result suggests that the findings reported only have a 10% likelihood of occurring by chance. Interestingly, a comparison across the three amplification schemes reveals at least a 5% improvement in Ears and Microphone over the hearing aid in all three subscales. This finding suggests that the smartphone applications provided significantly more global benefit to the end user compared to the hearing aid.
IOI-HA
Main effects were determined for participant responses using the Friedman test. Specifically, participant responses were compared for each question individually across the three aided conditions. Main effects revealed statistically significant differences among the aided conditions for questions 2 (Friedman’s Chi-Square = 8.53; df = 2; p <.05) and 4 (Friedman’s Chi-Square = 12.87; df = 2; p <.01). Questions 2 and 4 query participants’ perception related to the benefit and satisfaction, respectively, received from amplification.
Post hoc results revealed greater self-perceived benefit for Ears (Wilcoxon Signed Ranks; Z = -2.50, p < .05) and Microphone (Wilcoxon Signed Ranks; Z = -2.32, p < .05) compared to the hearing aid. This finding corroborates the results obtained with the APHAB. For satisfaction, the hearing aid was found to provide an increased perception over Ears (Wilcoxon Signed Ranks; Z = -2.59, p = .01) and Microphone (Wilcoxon Signed Ranks; Z = -2.57, p = .01). In both instances, responses between the two smartphone applications were not significantly different.
Satisfaction Survey

|
| Figure 6. Mean magnitude estimation responses obtained on the satisfaction survey for overall satisfaction and overall benefit. |
Statistical differences between aided conditions were assessed using a one-way repeated-measures ANOVA. The first three questions queried the participant’s overall satisfaction and overall benefit for the three aided conditions. Results, shown in Figure 6, revealed significantly greater satisfaction for the hearing aid compared to either smartphone application (F2,16 = 4.35, p < .05). Ratings for benefit, however, were not statistically significant (p > .05) among the aided conditions. The final question queried the likelihood of recommending the hearing aid or smartphone application to family and friends, with responses overwhelmingly favoring the hearing aid to the smartphone applications (F2,16 = 4.53, p < .05).
Together, these findings suggest that all three aided conditions provided similar benefit. The hearing aid, however, provided greater satisfaction, increasing the likelihood that the traditional device will be recommended to friends and family compared to a smartphone-based hearing aid application. Thus, it appears that the intended use of smartphone-based hearing aid applications is to provide temporary assistance to listeners with hearing deficits.

|
|
Figure 7. Mean magnitude estimation responses obtained on the satisfaction survey for features |
The next four questions assessed satisfaction with the features of the three aided conditions. As Figure 7 shows, mean responses yielded significantly greater satisfaction for the smartphone hearing aid applications compared to the hearing aid with respect to battery changing or charging the device (F2,16 = 5.53, p < .05). The smartphone-based applications also were found to provide significantly greater satisfaction with respect to adjustments provided to participants compared to the hearing aid (F2,16 = 9.49, p < .01). The only factor favoring the hearing aid was its lack of visibility (F2,16 = 4.28, p < .05), which was expected given the hardwired configuration of the smartphone application conditions. No statistically significant differences (p > .05) were found for ease of insertion and removal among the aided conditions.
The final eight questions queried the participant’s satisfaction with the sound quality provided by each aided condition. Four aspects of sound quality—clarity (ie, understandability), own voice, naturalness, and localization—were no significantly different (p > .05) among aided conditions (Figure 8). Fidelity, which we defined as the perceived resolution of the amplified signal, significantly favored the hearing aid and Ears application over the Microphone application (F2,16 = 4.24, p < .05). For sounds amplified at soft-input levels, the hearing aid was also found to provide significantly (F2,16 = 11.58, p = .001) greater satisfaction responses than both smartphone applications (Figure 8).

|
| Figure 8. Mean magnitude estimation responses obtained on the satisfaction survey for sound quality |
Also shown in Figure 8, both smartphone-based applications provided significantly (F2,16 = 4.51, p < .05) greater satisfaction responses for sounds amplified at high-input levels. We suspect the former finding is related to the linear gain provided prior to the compression threshold in the WDRC amplification scheme, and the latter finding is related to the user’s ability to modify the amount of amplification using the gain control available in the smartphone-based applications.
Participant responses indicated significantly greater satisfaction in noise with the smartphone applications compared to the hearing aids (F2,16 = 5.53, p < .05), despite no objective differences found in this study. As indicated earlier, this finding stems from microphone placement differences among the hearing aid and smartphone-based applications.
A Temporary/Starter Solution
The purpose of this study was to determine whether a smartphone-based application is a viable substitute to the traditional hearing aid. Objective testing revealed similar electroacoustic results between smartphone applications housed on the iPod and the traditional hearing aid. In addition, speech-in-noise performance was similar across all three aided conditions. Subjective testing revealed mean responses favoring the two smartphone-based applications with respect to providing an advantage (ie, benefit) for the global component of the APHAB and for self-perceived benefit component of the IOI-HA, while the traditional hearing aid fulfilled subjects’ overall needs and expectations (ie, satisfaction) as determined by mean responses to the IOI-HA and satisfaction surveys.
Results from this study indicate that the intended use of smartphone-based hearing aid applications is to provide temporary assistance to individuals with hearing deficits. Despite this positive finding, there is a primary barrier to hearing aid adoption for previous users of smartphone hearing aid applications. Specifically, many smartphone-based applications afford the end user the opportunity to adjust volume, frequency-gain response, or both, manually. Presently, not all hearing aids available on the market provide user-adjustable controls.
To overcome this barrier, it is imperative that manufacturers provide listeners with an adjustable control—minimally, a volume control. For devices that allow the user to adjust volume and other features from an external remote control, the remote control should be packaged together with the hearing aid as a single unit. The simple addition of a volume control or remote control provides the functional perception that traditional hearing aids offer similar features (ie, benefits) to their lesser substitutes, while providing greater satisfaction through advantages provided by the advanced signal processing capabilities and the counseling strategies provided by dispensers.
In a future paper, we provide the theoretical and practical basis of how smartphone-based hearing aid applications can improve adoption rates, while promoting professional care as the entry point to hearing healthcare.
References:
1. Amlani AM. Will federal subsidies increase the US hearing aid market penetration rate? Audiology Today. 2010;22(2):40-46.
2. Amlani AM. Influence of perceived value on hearing aid adoption and re-adoption intent. Hearing Review Products. 2013;20(3):8-12.
3. Kochkin S, Beck DL, Christensen LA, Compton-Conley C, Fligor BJ, Kricos PB, McSpaden JB, Mueller HG, Nilsson MJ, Northern JL, Powers TZ, Sweetow RW, Taylor B, Turner RG. MarkeTrak VIII: The impact of the hearing healthcare professional on hearing aid success. Hearing Review. 2010;17(4):12-34.
4. Amlani AM, Taylor B, Weinberg T. Increasing hearing aid adoption rates through value-based advertising and price unbundling. Hearing Review. 2011;18(13):10-17.
5. Gwartney JD, Stroup RL, Sobel RS, MacPherson DA. Macroeconomics: Private and Public Choice. 13th ed. Mason, Ohio: Cengage Learning; 2011.
6. Lin FR, Metter EJ, O’Brien RJ, Resnick SM, Zonderman AB, Ferrucci L. Hearing loss and incident dementia. Arch Neurol. 2011;68(2):214-220.
7. Lin FR, Yaffe K, Xia J, et al. Hearing loss and cognitive decline in older adults. JAMA Intern Med. 2013;173(4):293-299.
8. Gagné JP, Southall H, Jennings MB. Stigma and self-stigma associated with acquired hearing loss in adults. Hearing Review. 2011;18(8):16-22.
9. Folstein MF, Folstein SE, McHugh PR. Mini-mental state. A practical method for grading the cognitive state of patients for the clinician. J Psych Res. 1975;12(3):189–98.
10. Cox RM, Alexander GC, Gilmore CA. Development of the connected speech test (CST). Ear Hear. 1987;8:119S-126S.
11. Cox RM, Alexander GC, Gilmore C, Pusakulich KM. Use of the Connected Speech Test (CST) with hearing-impaired listeners. Ear Hear. 1988;9:198-207.
12. Studebaker GA. A “rationalized” arcsine transform. J Speech Hear Res. 1985;28:455-462.
13. Cox RM, Alexander GC. The Abbreviated Profile of Hearing Aid Benefit (APHAB). Ear Hear. 1995;16:176-186.
14. Cox R, Hyde M, Gatehouse S, et al. Optimal outcome measures, research priorities, and international cooperation. Ear Hear. 2000;21:106S-115S.
15. Pavlovic CV. Articulation index predictions of speech intelligibility in hearing aid selection. Asha. 1988;30:63-65.
Amyn M. Amlani, PhD, is an associate professor of audiology in the Department of Speech and Hearing Sciences at the University of North Texas, Denton, Tex, and Brian Taylor, AuD, is the director of practice development/clinical affairs at Unitron, Plymouth, Minn. Charla Levy, BA, and Rachel Robbins, BA, are AuD students at the University of North Texas.
Original citation for this article: Amlani, A., B. Taylor, C. Levy, R. Robbins. Utility of smartphone-based hearing aid applications as a substitute to traditional hearing aids. Hearing Review. 2013, December: 16-23.