While remaining optimistic about their business prospects for 2001, dispensing professionals are noticeably more cautious when predicting future unit volume gains, according to this year’s Hearing Review survey of hearing instrument specialists and dispensing audiologists. This year’s survey suggests that, in 2000, the percentage of first-time hearing aid users continued to fall (to 45%, down from 75% in 1983) and the average number of hearing instruments dispensed per month by dispensing offices is also declining. Meanwhile, binaural fittings continued to increase (to 72%), programmable and digital instruments have surpassed conventional technologies in number of units dispensed (accounting for more than half of all instruments), and the number of brands offered by the average dispensing office continues to decline (64% offer four or fewer brands).
|
About this survey…..
FIG 1 – Survey respondents by region vs. hearing instruments dispensed by region In March 2001, The Hearing Review (HR) mailed four-page questionnaires to 750 hearing care professionals whose names were chosen at random from the HR mailing list. Both dispensing audiologists (DAs) and hearing instrument specialists (HIS) were included. A total of 21% of the questionnaires were completed and returned to HR (HIS 63% and DA 37%). Returned questionnaires were received from every state except WY and NC. 97% of the respondents stated that they had controlling interest in their practices/businesses, with 86% owners and 11% co-owners. The above map compares the number of responses received from each region (in terms of the percentage of total responses received) to the percentage each region comprises in terms of hearing instruments dispensed (disregarding VA sales). This year’s survey represents the dispensing activity of the nation fairly well, with the caveat that hearing instrument specialists may be slightly over-represented within the final “all” column of the statistics.1 |

In March, this year’s survey was sent at random to 750 dispensing offices, with a representative amount of surveys sent to each state (corresponding to the number of dispensing offices per state). A total of 21% of the surveys were returned, generating a sample that is relatively close to the actual distribution of dispensing activity in the U.S. (Fig. 1).
|
Fig. 2 – Profile of Dispensing Professionals
|
Of those responding to this year’s survey (Fig. 2), 63% were hearing instrument specialists (HIS) and 37% were dispensing audiologists (DAs). (Editor’s note: 1% of respondents were medical doctors. Because of this small sample size, and the fact that the MDs employed audiologists, these responses were included as part of the DA statistics.) MarkeTrak1 statistics suggest that the “perceived profession” from whom users purchase their hearing aids are 43.4% hearing instrument specialists and 53.6% audiologists, with MDs and other professions comprising the remaining 3%.
The average respondent to this year’s survey was an owner (86%, HIS 88%; DA 81%) or co-owner (11%, HIS 10%; DA 15%) of an independent practice with two offices. This “average” dispensing professional was 41-60 years old (69%, HIS 69%; DA 72%), had a college or post-graduate degree (63%, HIS 40%; DA 100%) and had been dispensing hearing instruments for 18.1 years (HIS 18.4 years; DA 17.6 years).
Tempered Enthusiasm for 2001 Sales and Revenues

In total, half (51%) of all dispensing professionals said their sales increased in 2000, which compares to 55% who reported unit increases in last year’s survey (Fig. 4). The survey responses parallel Hearing Industries Assn. (HIA) reports of flat Y2000 sales (2% total, and 0% when disregarding VA purchases).

Regionally, the majority of dispensing professionals reported unit volume gains (Fig. 5) during 2000. The exceptions occurred in the Midwest, where only 18% of all dispensing professionals (15% HIS, 25% DA) reported unit volume gains by an average of 25%, whereas 41% reported a sales shortfall (39% HIS, 50% DA) by an average of 5%. Hearing Industries Assn. (HIA) statistics for this region indicate that sales were flat (-1% sales decrease) during 2000.2 In the Northeast, only 40% of HIS reported unit volume increases during 2000; however, 86% of DAs in that region reported sales gains. It is interesting to note that HIA figures for this region were the lowest (-4%) in the nation for 2000. In the Northwest, only 38% of DAs reported unit volume gains compared to 55% of HIS; however, HIA statistics for this region indicate a unit volume increase of 2%.
|
Fig. 5. Reported regional unit volume gains
|

Predictions on 2001 unit volume gains/losses: In last year’s HR Dispenser Survey3, both hearing instrument specialists and dispensing audiologists were bullish on the prospect of increased hearing instrument sales. Seventy-eight percent of all dispensing professionals predicted that, for 2000, they would experience unit volume increases of 15%. There is slightly less optimism for 2001. In this year’s survey, 62% of dispensing professionals predicted unit volume increases of 14% (Fig. 3b). However, one-in-ten dispensing professionals predicted that their sales would take a turn for the worse in 2001 (by an average of -6%)—double the number who predicted losses last year.
|
Fig. 6. Regional predictions for unit volume
|

As with the survey reports on unit volume gains, predictions on how dispensing professionals would prosper during 2001 differed according to region (Fig. 6). The vast majority (67-75%) of dispensing professionals in the southern regions of the U.S. expected unit volume sales increases of 13-18%. However, those professionals in the northern regions (50-58%) were less optimistic, predicting increases of 6-18%. In particular, only 36% of HIS in the Great Lakes, 40% of HIS in the Northeast and 44% of HIS in the Northwest regions thought that their unit volumes would increase during 2001. In contrast, DAs in all regions were exceptionally bullish (71%-80%) on 2001’s prospects for unit gains, except in the Midwest where only one-third predicted gains.

For the fourth consecutive year, more than half of all dispensing professionals surveyed have reported gains in gross revenues (Fig. 8). The data corresponds to Hearing Review statistics indicating that the average dispensing professional witnessed gross revenue gains of 8-12% during 2000.4 This is largely due to the influence of more programmable and digital signal processing (DSP) instruments being dispensed (discussed later in this article).

Predictions of 2001 revenues: While the predictions of revenue growth for this year (Fig. 7b) appear to be rosy, it actually pales when compared to survey predictions of the last three years. Revenue growth predictions by dispensing professionals for 1998-2000 ranged from 80-92%. This year, predictions ranged from 65-66%, indicating a lot less optimism in the field. No significant differences between HIS and DA responses were observed, with 7% of all professionals indicating that they expected revenue decreases of about -6%, and 27% expecting revenues to remain at the same level as Y2000.
Hearing Instrument Fitting and Dispensing Trends
|
Fig 9a – Trends in circuitry types, ‘96-’00
*Note: For 1996-97 surveys, numbers do not always add up to 100% because several respondents’ answers did not add up to 100%. Fig 9b – Trends in circuitry types, ‘97-’00
|
||||||||||||||||||||||||||||||||||||||||||||||||||||||||||||||||||||||||||||||||||||
Technology types and the surge in high performance instruments: Programmable and digital signal processing (DSP) instruments are changing the face of hearing instrument dispensing, and the burgeoning popularity of these instruments is evident in this year’s survey of dispensing professionals (Fig. 9a). Hearing Review surveys3,5,6,7 indicate that, from 1996-2000, DSP instruments have grown from 6% to 23% of all instruments dispensed, while programmable instruments have grown from 29% to 37%. As a single class, high performance hearing instruments (i.e., programmable and DSP combined) were reported by hearing care professionals to constitute three-fifths (60%) of all hearing aids dispensed. This corresponds well with Hearing Industries Assn. (HIA) statistics which indicated that half (50%) of all instruments dispensed (20% DSP and 30% programmable) are high performance aids.


The trend of decreased use of non-programmable linear aids has appeared to level off somewhat (i.e., only fluctuating from 25-30% from 1998-00). Meanwhile, the use of non-programmable non-linear aids is still falling fairly rapidly, decreasing from 38% in 1997 to 15% in 2000.
Hearing instrument specialists appear to be responding to the utilization of DSP instruments with more reserve compared to their dispensing audiologist counterparts (Fig. 9b). DAs reported using exactly twice as many DSP instruments (34%) than HIS (17%) in Y2000. Moreover, this trend has prevailed, more or less, since 1997, with HIS utilizing about twice as many non-programmable linear instruments than DAs.
In terms of regional differences in technology usage, this year’s survey suggests that the western states used slightly more digital aids than other regions. Dispensing professionals in the Southwest and Northwest reported using DSP aids for 32-34% of their patients compared to 15-22% for all other regions. However, use of programmable instruments in the west (32-34%) was slightly below average (probably affected by the high use of DSP aids). The survey also suggests that programmable aids enjoy substantially more popularity than DSP aids in the Midwest (44% programmable/19% DSP), Mid-Atlantic & New England (40%/21%), South Atlantic (39%/22%) and Great Lakes (35%/15%). The South Central and East South Central had the lowest utilization of high performance instruments as a group (32%/20%).
Admittedly, there is a need for more data on these regional differences before jumping to any conclusions; however, the survey may reflect at least some of the regional economic factors, consumer preferences/tendencies, as well as general dispensing practices. For example, it is interesting to note that, according to HIA statistics, the lowest per-capita use of hearing instruments occurs in the South Central and East South Central regions8—where market penetration of DSP and programmable aids is also the lowest. Does this suggest that more economical and/or entry-level aids might help expand these regions’ sales? Or does the dearth of dispensing offices2 in these regions create less competition for higher-technology products (and all hearing care products in general)?
Trends in instrument styles: Similar to HIA statistics, HR dispenser survey statistics since 1997 show little change in instrument styles. In 2000, BTEs were reportedly used 16% of the time, ITEs 35%, ITCs 27% and CICs 22% (Fig. 10). This compares with HIA figures of 20% for BTEs, ITEs 43%, ITCs 22% and CICs 15%. The HR Survey suggests that, over the past three years, DAs use slightly more BTEs and slightly fewer CICs that their HIS counterparts.
Binaural vs. monaural fittings: Binaural fittings increased to 72% in 2000 (Fig. 11), up from 24% in 1980 and 46% in 1989.9 This shift to binaural fittings is widely attributed to be responsible for much of the industry’s growth during the past decade. Looking at it in a more pessimistic viewpoint, it has also acted as a buffer for the reduced market penetration of hearing aids. Using HIA statistics to estimate the total number of hearing instrument purchasers in 2000, there were 574,000 monaural purchasers and 738,000 binaural purchasers—a total of 1.31 million users. This isn’t substantially different than in years past. More than a decade ago, in 1989, there were 1.07 million users, and 20 years ago, in 1980, there were 646,000 users.10 Several industry experts believe that the industry is now reaching the upper limits of binaural market penetration.

Prices of hearing instruments: Depending on the style and technology of the hearing aid, price changes ranged from -6.5-7.2% in 2000 compared to the previous year (Fig. 12). The largest price increases were realized in the ITE ($917) and ITC ($1148) styles (increases of 6.5% and 7.2% respectively). BTE ($893) and CIC ($1525) price changes were negligible. In 2000, programmable instrument prices ($1618) fell by $114, or -6.5%, while the price of digital instruments ($2496) rose by 4.2%.
Although it may appear that hearing aid prices have risen significantly in the past decade (Fig. 13), they have actually remained fairly static when the prices are adjusted for inflation.4 There is also good news in that hearing instruments now enjoy a relatively wide price range; many survey responses clearly demonstrated that large numbers of dispensing offices make available a number of economical aids (<$650). Additionally, the advent of entry-level and disposable aids may bring further changes in hearing instrument pricing options, broadening the choices for consumers.

When the above survey prices are weighted by the appropriate HIA statistics for unit volume, the average price of a hearing instrument in 2000 is estimated by HR to be about $1480. However, it should be noted that 84% of all survey respondents (HIS 93%, DA 68%) bundle their fees (i.e., charges for testing and fitting are combined with the cost of the instrument). Only 7% of HIS and 32% of DAs reported itemizing costs for the various services (Fig. 14).


Even more interesting, the average office dispensed more than two-thirds (68%) of its instruments from one brand (Fig. 16b). Hearing instrument specialists, on average, dispensed almost four-fifths (79%) of all their hearing aids from one brand, while dispensing audiologists reported that they dispensed over half (51%) of their aids from one brand. This underscores the current emphasis on hearing industry marketing to dispensing professionals, as well as providing support services/incentives and the development of easy-to-use fitting software.

It should be recognized that dispensing professionals and manufacturers define a “return” differently. Unlike most dispensing professionals, manufacturers report returns as any “return for credit,” including exchanged instruments, remakes and those aids that cannot be repaired (i.e., essentially any aid that must be replaced). Conversely, certain methods of dispensing, including those that are greatly discouraged due to their cost to all parties (e.g., a dispenser letting a customer “try out” multiple aids at the same time) may lead to divergent reports of return rates (e.g., a manufacturer reports all the returned aids while the dispenser might report none). HIA reported return rates in Y2000 totalled 19.5% for all instruments, with CICs at 23.0%, programmables at 18.9% and DSP at 27.7%. Survey respondents reported that on-quarter (26%) of their clients returned to their offices with the instruments, and one-fifth (21%) of the instruments returned were later exchanged for another model/type of hearing aid. 
Client visits: On average, it takes 3-5 client visits before a hearing instrument can be properly fitted, said 72% of this year’s survey respondents (Fig. 18). 16% of respondents reported that it took two visits, 8% said it took six or more visits and only 4% said it took one visit. Differences in responses between the professions were relatively minor.

Age of clients: Almost two-thirds (65%) of all clients of a dispensing practice are age 65 or older, and 87% are age 45 or older, according to survey respondents (Fig. 19). This corresponds to Kochkin’s data that says clients age 65 and older make up 65.1% of current users and those 45 and older comprise 90.2% of users.1 Hearing instrument specialists see almost exclusively older adults (92% age 45+), while dispensing audiologists report that nearly one-quarter (22%) of their clients are younger than age 45. As might be expected, HIS reported that only 1% of their clients were under 18 years old, as compared to 8% for DAs.
Previous surveys3,10,11 have indicated that the average age of clients is getting older. In 1980, dispensing professionals reported that 49% of their clients were age 65 or older, compared to 57% in 1987, and 65% in this year’s survey. MarkeTrak data indicates that the average age of a new user is 66.3 years old.1


First-time clients: The number of first-time users of hearing instruments continues to fall—this year to 45%—the lowest level ever recorded in the HR Dispenser Survey (Fig. 20). In Y2000, the percentage of first-time (i.e., never having previously purchased a hearing aid) customers coming into the office of a hearing instrument specialist was 41%, and 51% for dispensing audiologist. This is an alarming trend when considering that in 1983 dispensing professionals said that more than three-quarters (75.6%) of their clients were first-time users of hearing aids (Fig. 21).12 Since that time, the number of first-time users have fallen by more than one-third.
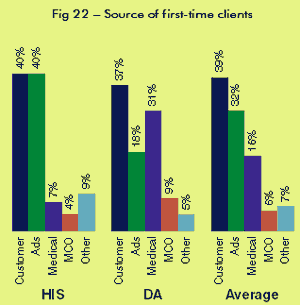
Source of first-time clients: Word-of-mouth referrals (i.e., from customers) continue to be the largest source of new customers, say survey respondents (Fig. 22). About two-fifths (39%) of all new clients have been referred to the office by a current/previous client (HIS 40%, DA 37%). Advertising by the office/practice accounts for a similar amount of new clients (40%) for hearing instrument specialists but only half as much (18%) for dispensing audiologists. Correspondingly, dispensing audiologists report that medical referrals are their second most-important (31%) source of new customers, compared to only 7% for hearing instrument specialists. New clients coming to an office via a referral by an HMO/MCO were 4% for HIS and 9% for DAs (All 6%), while “other” sources were reported as comprising 9% for HIS and 5% for DAs (All 7%).
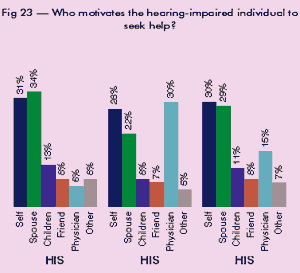
Client motivators: When asked what percentage of clients came into the office/practice due to specific people’s urging (Fig. 23), all dispensing professionals said that roughly one-third (29%) of clients are seeking hearing help due to the urging of a spouse, one-third (30%) are self-motivated, and the other third come into the office due to urging from their children (11%), friends (8%), physician (15%) and others (7%). As might be expected from the data on referral sources, dispensing audiologists are more likely to cite physicians as being a primary motivator of office visits (30%), while hearing instrument specialists see fewer (6%) client visits as the result of a doctor’s urging. Hearing instrument specialists also cited the spouse as being the primary motivator in 34% of cases, compared to 22% of cases for audiologists.
The data above correspond well to MarkeTrak V1 statistics which indicate that factors influencing first-time users include the person’s perception that their hearing is getting worse (52%), family members (53.4%), audiologists (26%), hearing instrument specialists (13.2%), ear doctors (10.8%) and current hearing aid users (10.8%).


The Dispensing Business
Office/practice setting: The majority of dispensing offices are located in an office building (57%, HIS 60%, DA 51%) and in retail settings (32%, HIS 37%, DA 21%) such as malls or shopping/city centers. About one-sixth (17%) of dispensing offices are located in medical centers or clinics (HIS 10%, DA 28%).

The dispensing offices taking part in this year’s survey were predominantly (59%) located in larger cities that had populations of 50,000-500,000 people (Fig. 27). HIS offices were more likely to be located in or near small towns than DA offices, with 13% serving market areas of less than 25,000 people compared to 4% for DAs. Conversely, DA offices were more likely to be found in larger metropolitan areas, with 23% serving areas of 500,000 people or more, compared to 12% for hearing instrument specialists. In recent years, many industry analysts have speculated that some rural areas in the U.S. are largely unserved by hearing care offices.
Staffing: While the majority of survey respondents indicated that only one hearing care professional staffed the office/practice, there were enough professionals in larger outlets to elevate the “number of staff members per office” to an average of about two (Fig. 28). There is little difference in staffing between HIS and DA offices: DA offices average 1.9 audiologists on staff, and about one-in-six DA offices (15.5%) employs a hearing instrument specialist (Fig. 29). HIS offices average 2.2 hearing instrument specialists on staff and more than one-in-five (22.3%) employs an audiologist.

Workload and future employment prospects: Two new questions in this year’s survey asked respondents to indicate how busy their offices were, and if they planned to add staff in the near-future (Fig. 30). In a question designed to gauge workload, respondents were asked if they were at 100% capacity (i.e., either needed to reduce the number of clients they see or add more staff members or equipment), or if their offices were at 85-99% capacity, 65-84% or less than 65% capacity. Only 12% of dispensing professionals (HIS 9%, DA 15%) said their offices were at 100% capacity. However, approximately one-third (39%, HIS 38%, DA 42%) reported being very busy (85-99% capacity), while another third (31%, HIS 36%, DA 25%) reported being at 64-84% capacity. Eighteen percent of all dispensing offices reported being under 65% capacity (HIS 17%, DA 18%).
Prospects appear to be very bright for those seeking employment in a dispensing office. When asked if the office anticipated hiring additional professional staff, more than one-quarter (28%) of respondents said they planned to add new staff members in the next year (HIS 27%, DA 30%), while half (52%) planned to add new staff in the next three years (HIS 51%, DA 56%).
National network affiliations: In this year’s HR Dispenser Survey, one-quarter of all dispensing offices (24%) reported an affiliation with a national dispensing network (Fig. 31). Slightly more than one-fourth (27%) of HIS offices and one-fifth (21%) of DA offices reported an affiliation with a national dispensing network (only 1% of HIS and 0% of DA offices reported being owned by the network).
It should be pointed out that this question is a difficult one to pose in a survey, and similarly difficult to analyze, because of the blurry dispenser definitions between corporate consolidation networks (e.g., Sonus, Hearx/Helix, etc.), hearing instrument manufacturer networks (e.g., Beltone, Miracle Ear, etc.) and the more independent national networks and buying groups (e.g., AHAA, Marcon, Audiology Co-op, etc.). The impact of the above types of organizations are apparent, as a large number of dispensing professionals (24%) now view their offices as part of a nationwide dispensing group. While these networks have made impressive gains in the last five years, the survey shows that at least 75% of dispensing offices are still owned and operated by private, independent entrepreneurs.
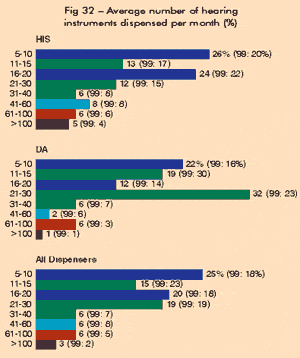
Hearing instruments dispensed per month: Forty percent of all hearing care offices dispense 15 or fewer hearing aids per month (HIS 39%, DA 41%), according to respondents (Fig. 32). A similar percentage of offices (39%) report dispensing between 16-30 hearing instruments per month (HIS 36%, DA 44%).

In the past seven years, there has been a trend for offices to dispense fewer instruments (Fig. 33). In 2000, 60% of all offices dispensed less than 20 units per month compared to only 49% in 1994. Twenty years ago, Karen (Cranmer) Briskey reported in 1980 that only 46% of offices dispensed 20 or fewer aids.13 Two-thirds (40%) of the offices in 1980 dispensed more than 30 units per month (HIS 45%, DA 32%) compared to only one-fifth (21%) of offices today (HIS 25%, DA 15%).
Gross annual revenues and profits: Approximately one-third (31%) of dispensing offices reported Y2000 gross revenues of $101-250,000, while 29% reported revenues of $251-500,000. These numbers are not significantly different than survey statistics from five years ago.5 The number of dispensing professionals in this year’s survey reporting revenues of over $1 million (11%) increased over previous surveys (2-4% in last five years), while the number reporting revenues of less than $100,000 (14%) decreased slightly (15-21%) from recent surveys.
Four-fifths (80%) of all dispensing offices reported annual gross profits of less than $100,000. Almost half (45%) of all offices/practices had $50,000 or less in gross profits, while 35% reported gross profits of $51-100,000. Only 13% of dispensing professionals reported profits of $101-250,000, and only 7% reported profits in excess of $250,000. When comparing the gross profits of DA and HIS offices, there appear to be relatively few differences. Despite the increase in gross annual revenues, gross annual profits have been falling over the past five years. In 1996, 72% of dispensing professionals (compared to 80% in Y2000) reported gross profits of less than $100,000.
Compensation: When discussing gross annual profits, it should be noted that the majority of offices are owned and operated by the dispensing professional who often pays him/herself an annual salary (and/or draws income from the business profits when appropriate). This year’s dispenser survey indicated that the average income of a hearing instrument specialist in all practice settings is $48,270, and the average income of a dispensing audiologist in all practice settings is $49,810. The average annual income of a dispensing audiologist working in an HIS office is $46,800, and the average income of a hearing instrument specialist working in a DA office is $45,100. It appears that the average HIS office owner has a declared salary of about $50,100, and the average DA owner has a declared salary of about $55,000.
More than half (51%) of all dispensing professionals are compensated via a fixed salary arrangement (HIS 46%, DA 59%), while 31% are compensated with both salary and commissions (HIS 27%, DA 37%). About one-sixth (17%) of all offices still pay professionals by commission only (HIS 25%, DA 4%). (Editor’s note: Due to its personal nature, only about half of all returned surveys contained information on salary or compensation methods. Because of this relatively small sample size, care should be used when considering these figures.)
MCOs/HMOs: Managed care continues to exert its influence on the hearing care field. More than half of all dispensing professionals (51%) reported dealing with managed care organizations (MCOs) or healthcare maintenance organizations (HMOs) (Fig. 34a) in 2000. Sixty-eight percent of DA offices and 42% of HIS offices deal with managed care entities, and these offices report that, on average, 19% of their customers are covered by managed care contracts (Fig. 34b). This is significantly higher than five years ago, when 37% of all survey respondents (HIS 21%, DA 53%) said that 17% of their clients were covered under MCO/HMO contracts.5
Marketing: Only half (50%) of all dispensing professionals report that had a pre-planned marketing strategy in Y2000 (HIS 51%, DA 48%). The most popular types of marketing used to promote the business/practice were ads in the Yellow Pages (88%), newspaper ads (81%), direct mailers (62%), letters to potential referral sources (40%), open houses (37%), hearing screening events (34%), TV and radio spots (33%) and the use of a website (31%). In 2000, the use of direct mail and websites for promoting dispensing offices rose significantly (from 76% and 22% in 1999 respectively).3
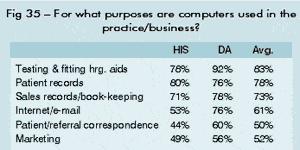
Computers and Internet use: Computers have become a focal point of activity in many offices (Fig. 35), as they are used in the majority of practices for the testing and fitting of hearing instruments (83%, HIS 78%, DA 92%), patient record-keeping (78%, HIS 80%, DA 76%), sales records/bookkeeping (73%, HIS 71%, DA 78%) and for accessing the Internet (61%, HIS 53%, DA 76%). The trend of computerized dispensing is apparent when one considers that in 1997 only 57% of offices used computers for testing and fitting. Similarly, office Internet use rose by 9% in 2000 over 1999 statistics.

When including home use, 69% of all dispensing professionals have access to and utilize the Internet (HIS 62%, DA 81%), spending about 2 hours per week online in hearing-related activities (Fig. 36). Among hearing instrument specialists, 70% report that they conduct the bulk of their hearing-related online activities at work, while 30% say they do their hearing-related online activities at home. In contrast, only half (52%) of audiologists perform their hearing-related online activities at the workplace, while the other half (48%) perform the activities from their homes.
The most common online activities for these dispensing professionals is obtaining product information (71%), looking up hearing-related articles and research (68%) and corresponding with colleagues (60%) and patients (40%). More than one-third (37%) of survey respondents who use the Internet say they purchase office products and other items online, but fewer (29%) say they order hearing care products (including hearing aids and testing instruments) online. Thirty-five percent of DAs and 8% of HIS say they use the Internet for obtaining CEUs or for upgrading their professional credentials.
Battery purchases and sales: The most common source for the purchase of batteries is through a hearing instrument manufacturer with whom the office does business (45%, HIS 47%, DA 40%), according to survey respondents. Thirty-eight percent of offices report purchasing batteries directly from the battery manufacturer (HIS 38%, DA 38%), 14% purchase batteries from wholesalers (HIS 13%, DA 18%), while 3% use other sources (HIS 2%, DA 4%).
Dispensing professionals estimate that their clients purchase 50% of all hearing instrument batteries from the dispensing office (HIS 56%, DA 41%). The survey also revealed that battery club programs are used by 62% of all dispensing offices, and DA offices (69%) were more likely to utilize a battery club program in 2000 than HIS offices (57%). Dispensing professionals market the name of their practice on the battery packaging 46% of the time (HIS 42%, DA 53%); 44% of the time the battery packaging bears the name of a battery manufacturer (HIS 42%, DA 49%), and 14% of the time the batteries are labeled with the name of a hearing instrument manufacturer (HIS 20%, DA 4%).
Conclusion
When looking at the 2001 HR Dispenser Survey, it seems apparent that dispensing professionals are less optimistic about increasing unit volume than during any survey in the past five years. Whether this is due to the recent slowdown of the U.S. economy or due to some other factor, is unknown. However, anecdotal accounts from the field indicate that sales in most areas of the country have been flat for the past 6-9 months. HIA statistics for the first quarter of 2001 indicates that hearing instrument unit volume is down by 0.71% (see HR News, p. 14).
Similarly, some of the statistics presented in this year’s survey certainly give pause for concern. First-time users accounted for only 45% of new clients during 2000. Additionally, nearly six-in-ten dispensing offices report fitting less than 20 hearing aids per month compared to five-in-ten in 1994.
However, there are also encouraging signs from this survey. The use of programmable and digital instruments continues to rise, while the prices of many types of hearing instruments have stabilized. There is also a much broader range of choice—in styles, technology and pricing—from which the consumer can choose. Additionally, the continued utilization of computer-driven dispensing and the Internet is bringing new efficiencies and beckoning in a new chapter of computerized health care. This analysis of the 2001 survey statistics highlights some of the factors behind the hearing industry’s recent slow market growth. Comparisons with previous surveys, regional statistics, marketing articles and industry information are also presented in an effort to provide a more comprehensive picture of what may be taking place at the dispenser-level. The HR staff hopes that this information can be utilized by hearing care professionals in the field, as well as by the industry, to gain new insights when plotting a course for the future.
Acknowledgements
The staff of The Hearing Review extends their deepest thanks to those professionals who took time out of their busy schedules to participate in this year’s survey. Without their valuable contributions in filling out the four-page survey with over 50 often-detailed questions, this report would have been impossible. The willingness of these individuals to share information about their businesses/practices provides information which all hearing care professionals can use in years to come in their business planning.
The editor also thanks Marjorie D. Skafte for her help in the analysis of this year’s survey. Marj is the pioneer of all dispenser surveys; she has compiled and written them for the better part of three decades. The lending of her expertise to this year’s survey is greatly appreciated. Gratitude is also extended to Christine Strom in helping with the questionnaire mailing and tabulation.
References
1. Kochkin S: “Baby boomers” spur growth in potential market, but penetration rate declines. Hear Jour 1999; 52 (1): 33-48.
2. Strom KE: 1999 regional marketing review. Hearing Review 2000; 6 (4): 48-51, 60-64.
3. Skafte MD: The 1999 hearing instrument market—the dispensers’ perspective. Hearing Review 2000; 7 (6): 8-40.
4. Strom KE: An industry in transformation: Technology and consolidation lead hearing care into the new millennium. Hearing Review 2001; 8 (3): 28-44, 87.
5. Skafte MD: The 1996 hearing instrument market—the dispenser’s perspective. Hearing Review 1997; 4 (3): 8-36.
6. Skafte MD: The 1997 hearing instrument market—the dispenser’s perspective. Hearing Review 1998; 5 (6): 6-32.
7. Skafte MD: The 1998 hearing instrument market—the dispenser’s perspective. Hearing Review 1999; 6 (6): 6-32.8. Strom KE: 1998 regional marketing review. Hearing Review 1999; 6 (4): 58-68.
9. Cranmer KS: Hearing instrument market analysis. Hear Instrum 1990; 41 (5): 6-10.
10. Cranmer KS: Hearing instrument market analysis. Hearing Instrum 1990; 41 (5): 6-10.
11. Grahl C: A dispenser yardstick: How to measure your 1992 performance. Hear Instrum 1993; 44 (6): 4-13.
12. Cranmer KS: Hearing instrument dispensing—1983. Hear Instrum 1983; 34 (5): 9-12.
13. Cranmer KS: Hearing instrument dispensing—1980. Hear Instrum 1980; 31 (5): 12-13.
Correspondence can be addressed to Karl Strom, HR, 4131 E. Superior St., Duluth, MN 55804; email: [email protected].