Back to Basics| February 2021 Hearing Review
By Marshall Chasin, AuD
In the fields of audiology, sound recording, and engineering audio design, a commonly held adage or golden rule is that the frequency response should be as flat or as “smooth” as possible. This has also been a mainstay in our clinical practice, as well. As far back as the 1980s, acoustic filters were included in hearing aid earhooks to smooth the 1000 Hz resonance, and depending on where the filter was in the earhook or tubing, also the resonant energy in the 3000 Hz region. Clinical comments such as “that sounds much better” once a filter was introduced were commonplace. There are even current advertisements in our industry showing “improvements” because a frequency response looks smoother.
But just because everyone—from the field of audio to our hard-of-hearing patients—agree that smoother is better, doesn’t mean that this is necessarily correct. The fallacy may have come from two areas where having a smoother, or even flat, frequency response is certainly better: one is the field of transducers (receivers and microphones) and the other is the OSPL90 curve that we see with hearing aids.
In the case of the transducer field, a flat frequency response makes perfect sense. A flat frequency response means that the media where the music or speech is played on, or involved in the transduction of, does not alter the speech or music. Microphones or receivers with large peaks at certain frequency regions will alter the recorded or transduced speech/music and impart large peaks at these frequencies in the output. The same can be said about the media themselves. While it is true that .mp3 and .wav audio files are perfectly flat, the tape cassettes and vinyl records of the past had peculiar bumps or peaks that many listeners of the era heard as part of the music—either positively or negatively. Many 1960’s-70’s recording artists preferred the AGFA 467 cassette tape because it “sounded better.” Unbeknownst to them, perhaps, was a small resonance of increased output in the 1000-2000 Hz region. Even today, many performing vocalists cup their hands around the microphone as if they are “kissing it,” adding an additional (5-10 dB) output around 1500 Hz. However, barring the “flatness limitations” of cassette tapes of generations past—whether intentional or not—a design agenda was to replicate the music and speech as accurately as possible, and this required a perfectly flat frequency response (or close to it).
With hearing aids, removing unwanted peaks in the frequency response was primarily to ensure that rogue and/or unexpected peaks did not exceed one’s listening tolerance levels. In the case of using ha-acoustic filters in ‘80’s and ‘90’s hearing aids, the acoustic filter not only dampened the frequency response, but more importantly, the output (OSPL90) of the hearing aids. With acoustic filtering, the hard-of-hearing users’ volume controls could be increased, thereby providing more useable gain without encountering tolerance issues. In many cases, hearing aid users were able to obtain significantly more high-frequency amplification than the unfiltered hearing aid specification would suggest. And it was this tolerance-related “smoothing” that many hard-of-hearing people found so beneficial.
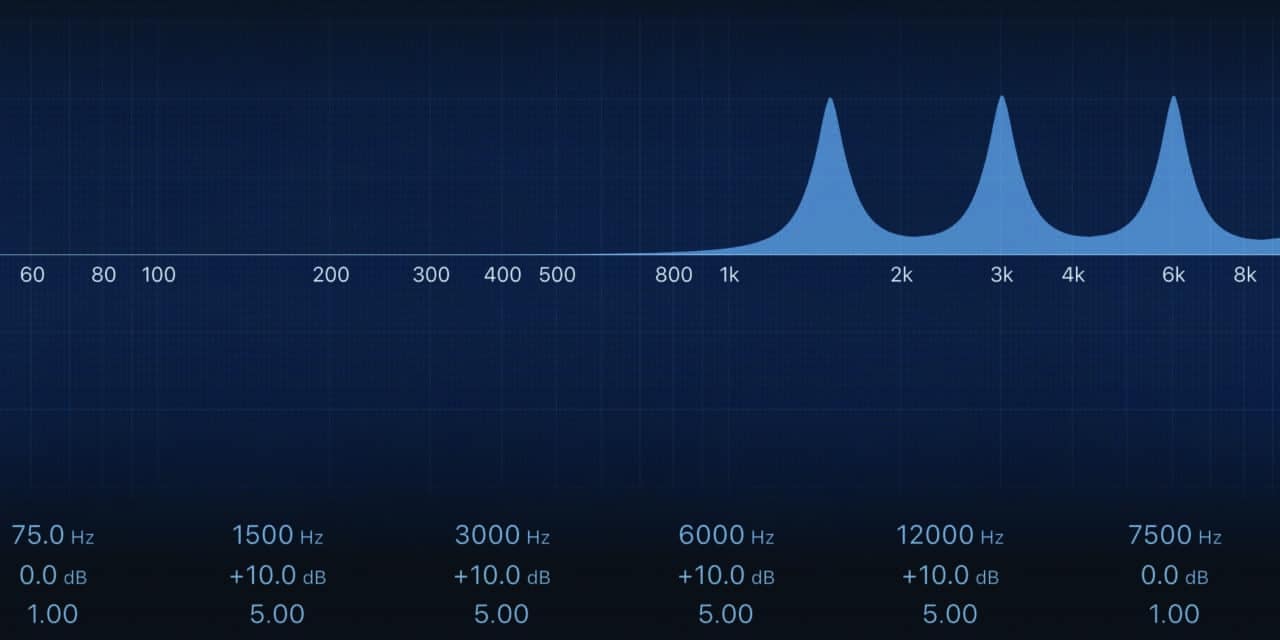
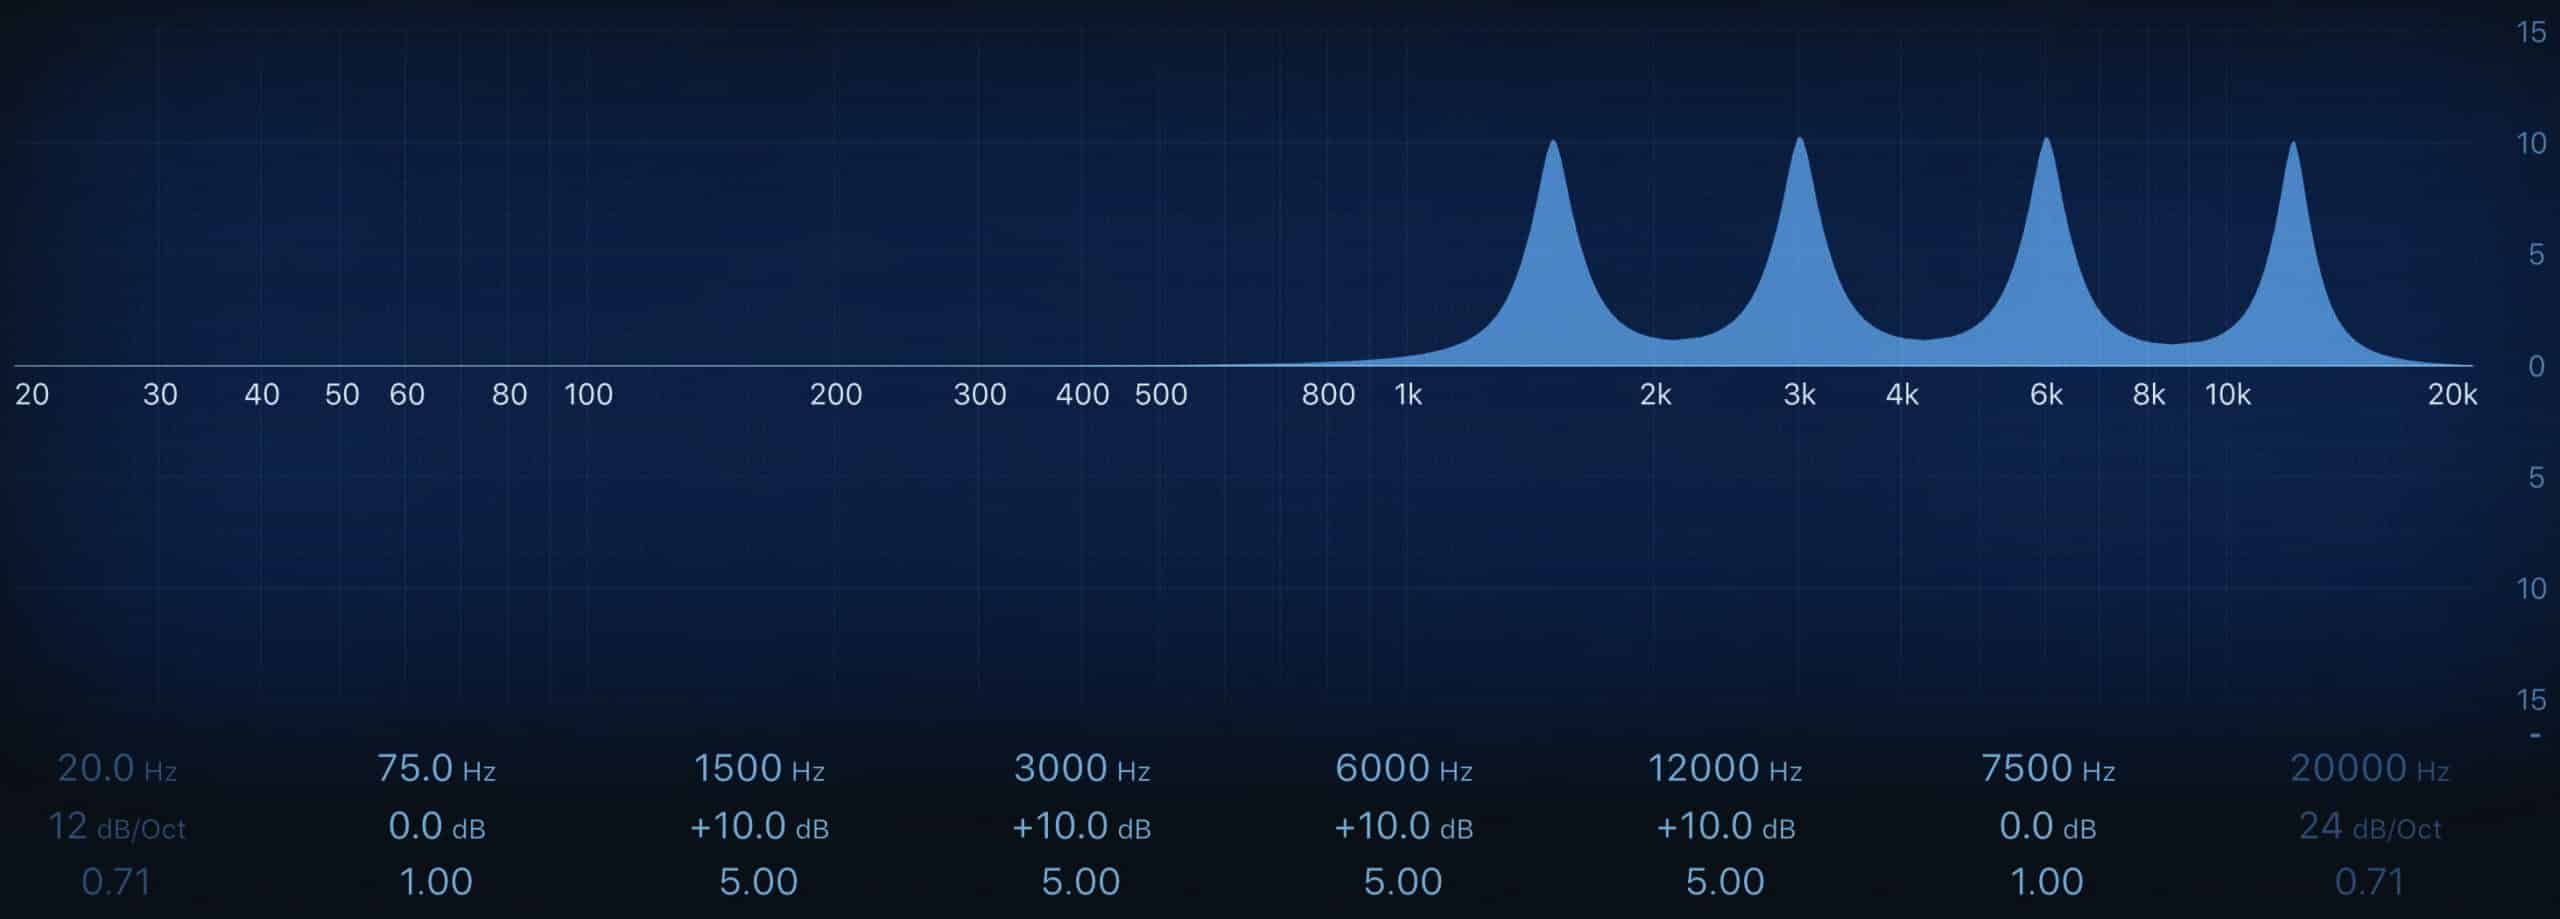
So, should a frequency response be flat? In order to examine this in more detail and under more controlled situations, a series of audio files were constructed where one could compare a perfectly flat frequency response with others with varying degrees of peaks in their responses. Specifically, a series of audio files were created for both music and for (semi-nonsense) speech in an A-B-C-D-A format, where: A has a perfectly flat frequency response; B has 5 dB peaks once in every octave above 1000 Hz; C has 10 dB peaks once in every octave above 1000 Hz, and D has 15 dB peaks once in every octave above 1000 Hz. All audio passages were normalized for sound level.
Although a sampling of a large number of subjects would drive this point home in a statistically valid manner (perhaps an AuD Capstone project waiting to happen), changes of up to 10 dB peak from a flat response is not readily noticeable. Larger peaks on the order of 15 dB are discernable from a flat response, but typically only if they are adjacent to a flat response in a paired comparison (eg, the “DA” portion in the above A-B-C-D-A ordering). Even then, despite being noticeable, the quality of the speech or music passage remains relatively high. Our auditory systems are fairly immune to this type of deviation from a flat frequency response.
A flat or smooth frequency response may look great in a picture for advertising purposes, but has little to do with any advertised improvement in how we hear music or speech.
Citation for this article: Chasin M. A smooth frequency response may not necessarily be a golden rule in sound quality. Hearing Review. 2021;28(2):12.