A detailed new map from researchers at Washington University School of Medicine in St. Louis (WUSTL) lays out the landscape of the cerebral cortex – the outermost layer of the brain and the dominant structure involved in sensory perception, including auditory and visual organization, as well as attention, language, tool use, and abstract thinking.
According to an article by Tamara Bhandari at WUSTL, the new map displays features of a typical brain demarcated in painstaking detail, and will be used by researchers studying brain disorders such as autism, schizophrenia, dementia, and epilepsy. Scientists will be able to use the map to understand differences in the brains of patients with these diseases compared with patients who are healthy. It also may accelerate progress in deciphering the workings of the healthy brain and elucidating what makes us unique as a species.
David Van Essen, PhD
A study paper about the work has been published in the July 20, 2016 edition of Nature. The researchers drew upon data and methods generated by the Human Connectome Project, a 5-year, multimillion dollar study led by David Van Essen, PhD, the senior author on the paper. The research involved a consortium that includes the University of Minnesota and Oxford University. The Human Connectome Project used a powerful, custom-built MRI machine to map the brains of 1,200 young adults. This study complements the Human Connectome Project by carefully delineating the brain regions so that their connections can be more accurately mapped.
The researchers report that the new brain map divides both the left and right cerebral hemispheres into 180 areas based on physical differences (such as the thickness of the cortex), functional distinctions (such as which areas respond to language stimuli), and differences in the connections of the areas. Brain cartography is more complicated than other types of cartography, since much of the brain looks superficially the same. The brain map is somewhat similar to a map that shows state borders, rather than one that shows topographic features.
“The brain is not like a computer that can support any operating system and run any software,” said Van Essen, the Alumni Endowed Professor of Neuroscience at WUSTL. “Instead, the software – how the brain works – is intimately correlated with the brain’s structure – its hardware, so to speak. If you want to find out what the brain can do, you have to understand how it is organized and wired.”
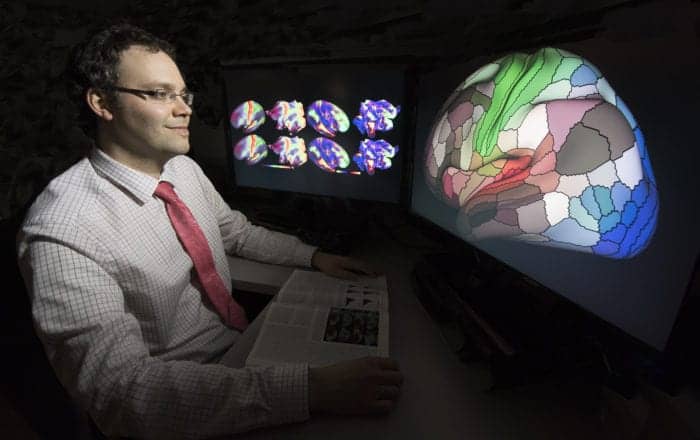
Matthew Glasser, PhD, led the team that mapped the human cerebral cortex in precise detail. Photo credit: Robert J. Boston
The research team, led by Matthew Glasser, PhD, mapped the cortex, a layer of neural tissue that encases the rest of the brain like a crumpled sheet of paper. The cortex is important for sensation, perception, attention, memory, thought, language, and consciousness. When German neuroanatomist, Korbinian Brodmann, first mapped the human cortex in the first decade of the 20th century, he identified 50 regions, including areas later shown to be involved in visual, language, and sensory processing. When Glasser began studying the connections between language areas of the brain almost a century later, he quickly became frustrated with Brodmann’s map and how it was typically being used in neuroimaging.
“My early work on language connectivity involved taking that 100-year-old map and trying to guess where Brodmann’s areas were in relation to the pathways underneath them,” said Glasser. “It quickly became obvious to me that we needed a better way to map the areas in the living brains that we were studying.”
To make this map, Glasser, Van Essen, and colleagues pooled data from 210 healthy young adults of both sexes. The researchers combined measures of the thickness of the cortex and the amount of insulation around neuronal cables, with MRI scans of the resting brain and of the brain performing simple tasks, such as listening to a story. They ended up with 180 areas in each hemisphere, though they don’t expect that to be the final number. They report that they identified a patch of cortex that probably could be subdivided, but they couldn’t confidently draw borders with the current data and techniques. In the future, researchers with better methods will likely subdivide that area.
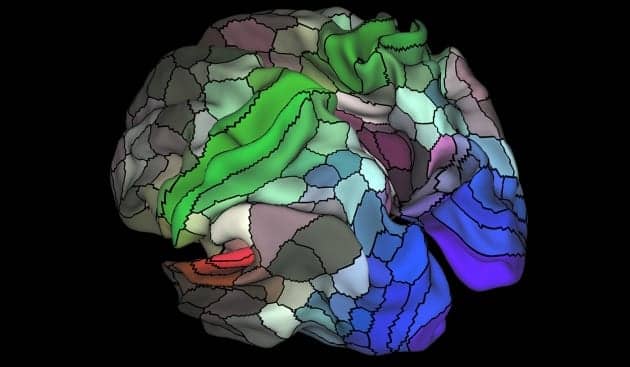
The detailed new map of the human brain shows at least 180 areas in each hemisphere, which “light up” with different activities, such as hearing a story, for example.
Some of those areas are clearly involved in particular tasks, such as 55b, which lights up with activity when a person hears a story. Others contain a map of a person’s field of vision or are involved in controlling movement. Most brain areas may never be identified with a single function, because they coordinate information from many different signals.
In the century between Brodmann’s map and Glasser and Van Essen’s, many other maps of the cortex have been drawn, showing anywhere from 50 to 200 different areas. The researchers say they have improved on previous maps by precisely aligning the information to a common coordinate system before analysis, using an algorithm developed by colleagues at Oxford University, and incorporating the highest-quality MRI data available. The results are a precise map with crisp borders and an algorithm capable of locating the areas in individual brains, even though each individual is unique in terms of the pattern of cortical folds and in the size and shape of areas on the cortical map.
Possible applications for more precise brain maps could help neurosurgeons avoid damaging the most important areas, such as those involved in language or motor function. Individual brain maps also could guide treatment for neurological or psychiatric illnesses. Different types of dementia, for example, are characterized by degeneration in different areas of the brain. Clinicians could use the individual maps to personalize treatment, based on the areas affected, or to monitor response to treatment.
Source: Washington University School of Medicine in St. Louis (WUSTL)
Photo credits: Washington University School of Medicine in St. Louis (WUSTL), Robert Boston, Eric Young; Nature