Research | November 2018 Hearing Review
How do today’s PSAPs stack up in comparison with traditional hearing aids?
Before jumping to the conclusion that any PSAP and/or OTC hearing device would be suitable for the many different types of hearing losses, we need to look at their coupler and real-ear performance data. This study suggests current PSAPs are suitable for mild losses only.
Hearing aids currently remain the “gold standard” for treating hearing loss. Other amplification options, however, such as Personal Sound Amplification Products (PSAPs) and Over-the-Counter (OTC) devices have gained consumer and audiologist interest. This interest has increased due to recommendations from the President’s Council of Advisors on Science and Technology (PCAST),1 National Academies of Sciences, Engineering, and Medicine (NASEM),2 Consumer Technology Association (CTA),3 and the media.4-7 The new law passed by Congress and signed by the President suggests that these PSAPs and OTCs would be appropriate for patients with “mild-” to- “moderate” hearing loss. The results of the current study do not agree with this suggestion, which will be explained in more detail later in this text.
One finding of the PCAST 1 report is the US adoption rate of hearing aids is approximately 15-30% for persons with hearing loss.1 The adoption rate, however, is anywhere from 6-14% for patients with “mild” hearing loss, and as great as 55-73% for patients with more severe hearing loss.8-9 While the report1 recognizes many barriers exist to obtaining hearing aids (denial of hearing loss, stigma, access, limited knowledge concerning amplification options, etc), one prominently cited barrier is cost. Cost to the consumer is a significant driving force behind the increased interest in PSAPs and OTCs, as the cost of these devices can range from less than $20 to hundreds of dollars, compared to hearing aids that can cost several hundred to several thousand dollars. It is important, however, to remember that the PSAP or OTC cost to the consumer is exclusively related to the invoice cost of the device. Hearing aids, on the other hand, include the cost of the device plus the services and expertise provided by the hearing care professional. This may include follow-up care at no charge for the duration of the warranty, which can be 1 to 4 years.
Given that there are currently no evidence-based practice guidelines, it would be helpful to examine which PSAP/OTC devices would be most appropriate for a specific magnitude of hearing loss. Only a few studies have examined characteristics of PSAP and OTC devices.10-17 Results from these studies are mixed, but overall there is a suggestion that PSAP and OTC devices can have a high maximum peak output, high equivalent input noise (EIN), and not adequately match a valid prescriptive target. Some studies reported PSAP and OTC devices were appropriate for a low-frequency hearing loss,12 “mild-to-moderate” gently sloping or flat hearing loss,12 and some devices performed similarly to a hearing aid in a speech recognition task.11
The primary goal of the current study is to provide additional information that can be used by hearing care professionals to counsel patients on which PSAP/OTC device might best fit their hearing loss. The current study does not endorse PSAPs/OTCs replacing hearing aids because the authors believe hearing aids, correctly fit by a dispensing professional, are the gold standard to achieve optimal hearing. Instead, the current study is intended to help clinicians better counsel patients who cannot afford a hearing aid on an appropriate PSAP/OTC for his/her hearing loss.
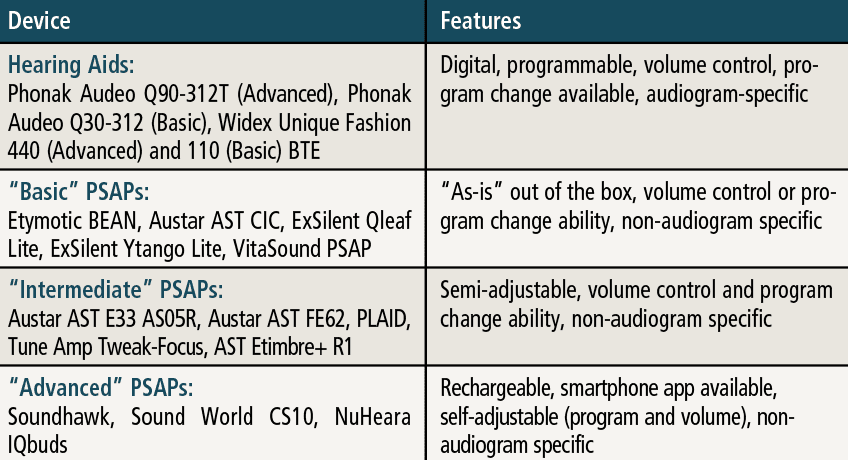
Table 1. Differences between hearing aids and “basic,” “intermediate,” and “advanced” PSAPs.
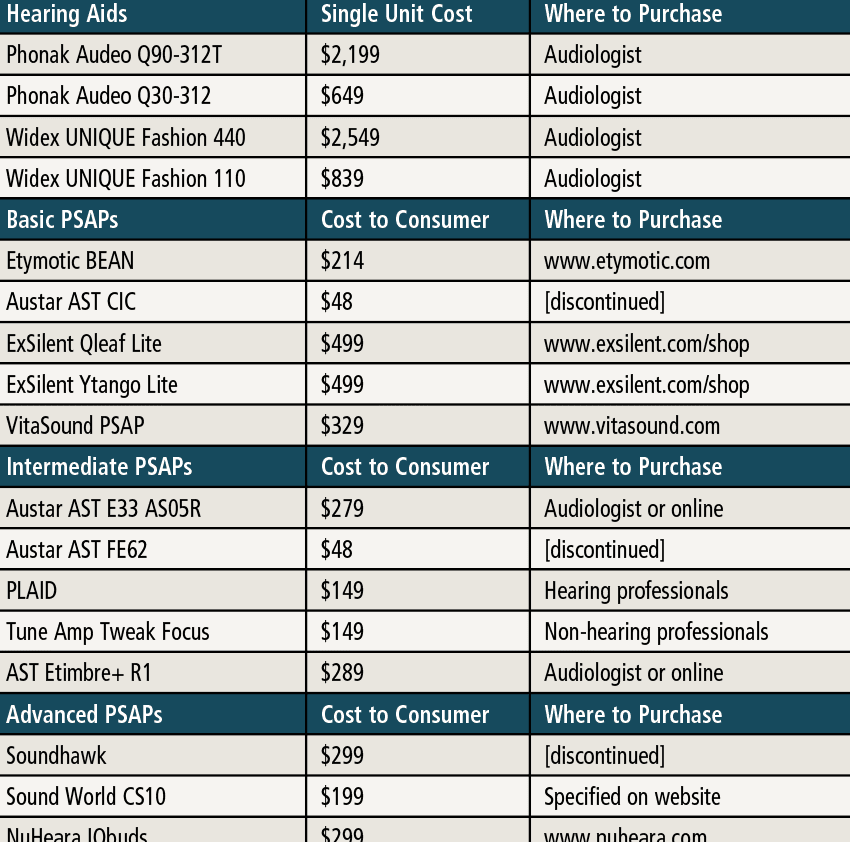
Table 2. List of hearing aids (HAs) and Personal Sound Amplication Products (PSAPs) used in the study. Also included are the cost to consumers (PSAPs) and single unit cost (HAs), as well as where the devices can be purchased. As noted in the table above, some PSAPs were discontinued at the time of the study, and this should be of some concern to hearing care professionals and their patients.
In the current study, two “premium” hearing aids, two “basic” hearing aids, three “advanced” PSAPs, five “intermediate” PSAPs, and five “basic” PSAPs were examined (Tables 1 and 2). PSAPs were arbitrarily separated into categories based on user control/programmability and available options. Electroacoustic (ANSI S3.22-200918) and real-ear measures (REM) were measured using eight “typical” audiometric configurations shown in Table 3. REM examined differences between the hearing aids and PSAPS using manufacturer first-fit versus programmed to match (ie, ±5 dB at 250-6000 Hz) the NAL-NL219 targets for input levels of 50 and 65 dB SPL. Differences between NAL-NL2 and each hearing aid and PSAP were measured using the Real-Ear Aided Response (REAR) to NAL-NL2 using the International Speech Test Signal (ISTS)20 for the eight audiometric configurations. Finally, tables were created for each of the eight audiograms identifying those devices that provided an appropriate fit.

Table 3. Eight audiometric configurations as established using the IEC 60118-5 measurement procedure.37 All data points are in dB HL.
Again, the goal of the current study was to provide evidence to this growing area of interest so that hearing healthcare professionals can counsel their patients on which PSAP might be potentially appropriate for his/her hearing loss.
Using data collected in this study, the second goal was to establish a repository of PSAP data where the same measures collected by select audiologists on additional PSAPs and OTC devices would be continually added. The intended purpose of the database is to make performance data accessible to all hearing healthcare professionals to facilitate an informed process when making decisions as to whether or not a specific PSAP and/or OTC may be potentially suitable for a particular patient. While the authors are not suggesting PSAPs or OTC devices replace traditional hearing aids, these devices can be an option for patients with “mild” hearing loss who are not able to afford traditional hearing aids. At least one center has been invited and is actively collecting data on a new subset of PSAPs at the time the current study was submitted for publication.
The PSAP repository resides as a resource on the Oaktree Products website and accessible via the link: www.oaktreeproducts.com/psap-database
Study Procedures
The study had two primary goals:
- To assess the electroacoustic performance of the hearing devices and compare to the manufacturer specifications, and
- To assess real-ear performance of the hearing devices to NAL-NL2 at input levels of 50 and 65 dB SPL for the eight audiometric configurations.
All coupler and real-ear measurements were performed using the Audioscan Verifit2 hearing instrument fitting system (software version 4.9.106). REMs were performed utilizing a Frye Electronics’ “dummy ear” which closely approximates the Real-Ear Unaided Response (REUR) of the average ear.
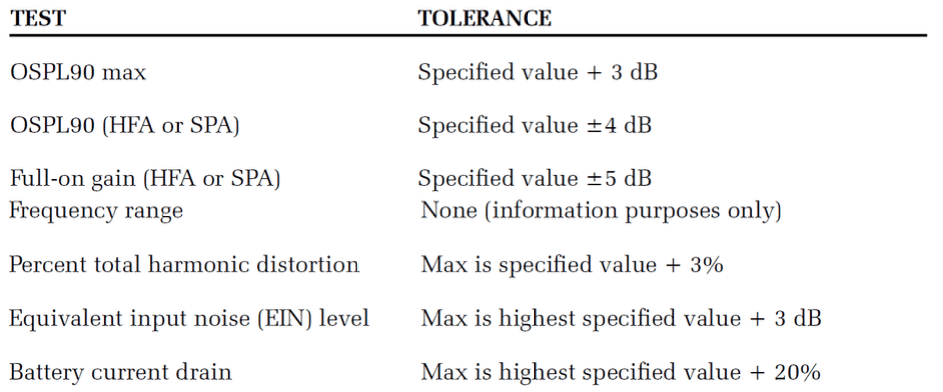
Table 4. ANSI S3.22-200918 tests and tolerances (Frye Electronics Inc, 2010).
The first part consisted of 2cc coupler measures using the Audioscan Verifit2 test box. After each hearing device was measured, the measured coupler data was compared to the manufacturer specifications (when available). For coupler measures, each hearing device was measured to ANSI S3.22-200918 while adjusted to Full-on Gain (FOG) and Reference Test Gain (RTG), when possible. For those devices where RTG position was not possible (ie, all PSAPs), the maximum gain setting was used (either highest volume control setting, program with greatest gain, or both). A list of ANSI S3.22-2009 tests and tolerances are listed in Table 4.
The second part of the study consisted of REM using the Audioscan Verifit2. The objective was to assess the real-ear performance of each hearing device and determine which devices would be more appropriate for patients with the eight audiometric configurations in Table 3. For each of the eight audiograms, REM was performed twice. The first measurement was based on a “first-fit” approach—represented by either the manufacturer’s quick-fit (ie, with hearing aids) or the baseline amplification provided by the device turned on “out of the box” (ie, with PSAPs). It is in the opinion of the authors that this is the manner most patients would probably use the devices and may represent “real life” use of the PSAP. The second measurement was based on a “programmed” approach whereby each device was programmed or adjusted so the measured REAR met NAL-NL2 at 250-6000 Hz for soft (50 dB SPL) and average (65 dB SPL) speech input levels within ±5 dB, if possible. Research has reported, however, that only 20-30% of hearing aids are programmed to a prescriptive target and the remaining 70-80% are fit to manufacturer first-fit21 which is why the authors captured data in both conditions.
Although previous research has considered that NAL-NL2 was “matched” if the measured REAR or Real-Ear Insertion Gain (REIG) was within ±10 dB of target,10,13 the authors of the current study elected a more stringent tolerance of ±5 dB at 250-6000 Hz.22 The British Society of Audiology guideline states that “tolerances to the prescription rationale of ±5 dB at frequencies of 250, 500, 1000, and 2000 Hz, and of ±8 dB at 3000 and 4000 Hz should be achieved in all cases.”22 The investigators, however, elected an even greater stringent tolerance due to the fact that the British standard states “these tolerances are fairly loose, and depending on the degree of hearing loss often closer matches to targets can be achieved.”22
Results
Electroacoustic data. For the majority of devices, measured coupler data matched manufacturer specification, with few exceptions. Devices such as the Etymotic Bean, ExSilent Qleaf Lite, Ytango Lite, and Soundhawk performed weaker than manufacturer specification (Max OSPL90, Avg OSPL90, and Avg FOG). Several PSAPs also had high levels of EIN (Soundhawk, NuHeara IQbuds, ExSilent Qleaf Lite, and ExSilent Ytango Lite). All hearing aid data almost always matched manufacturer specification.
Real-ear measurements. For the “first-fit” and “programmed” segments of the study, a “percent of the time” the measured REAR matched NAL-NL2 within ±5 dB at each of the nine test frequencies that were calculated. The “percent of the time” calculation was determined by dividing the total number of matched targets (±5 dB) by the 9 or 18 total number of NAL-NL2 targets being assessed (ie, 9 values for 50 dB and 65 dB SPL, and 18 values for combining 50 + 65 dB SPL). For example, if 8 of the 9 matched, a value of 88% was applied and so on until a value of 0% was applied if none of the 9 measured REARs matched NAL-NL2 within ±5 dB.
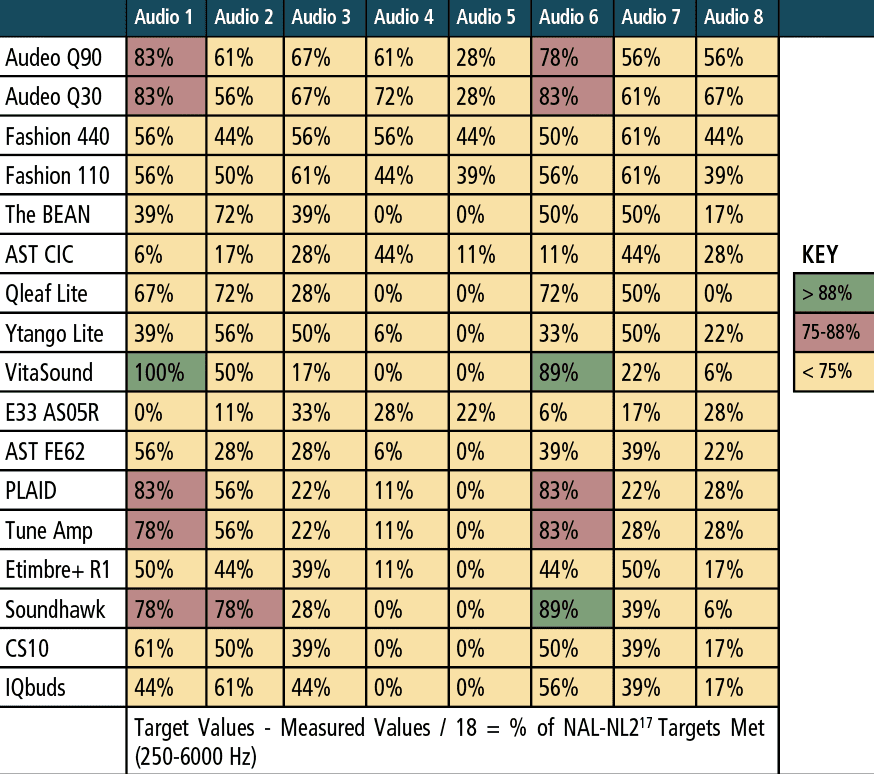
Table 5. First-fit (250-6000Hz): Percentage of NAL-NL2 targets met for 50 and 65 dB SPL.
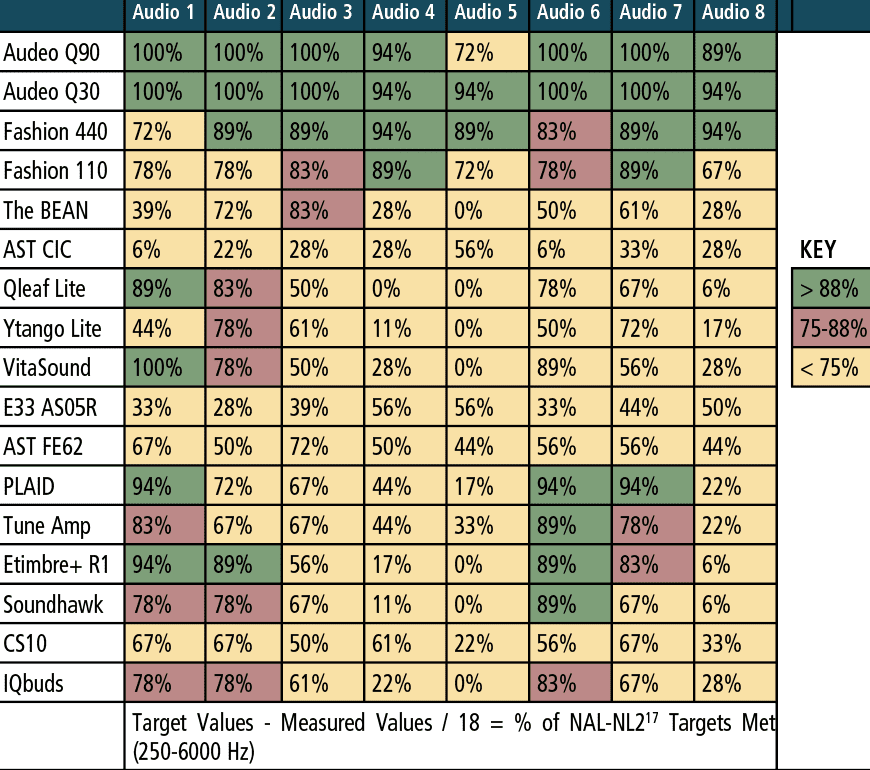
Table 6. Programmed (250-6000 Hz): Percentage of NAL-NL2 targets met for 50 and 65 dB SPL.
Table 5 reports performance of each device for the 50 and 65 dB SPL input levels combined for the “first-fit” approach, and Table 6 reports the same data for each device, but after being programmed to NAL-NL2. The tables are arbitrarily divided into three colors: green for 88-100% targets matched, red for 75-87% targets matched, and yellow for 0-74% targets matched. Specifically, the results indicated:
- The “premium” and “basic” hearing aids were the best performers regardless of audiometric configuration, especially when fit to a prescriptive target (ie, programmed).
- The two “basic” hearing aids performed relatively equal to the two “premium” hearing aids.
- PSAP performance was mixed. A few devices (PLAID, ExSilent Qleaf Lite, Etimbre+ R1, VitaSound) performed well for “slight” or “mild” hearing loss (especially when fit to NAL-NL2), while most PSAPs did not meet or arrive close to target as the severity of hearing loss increased beyond “slight” and “mild.”
Again, this does not agree with the new law passed by Congress and signed by the President which suggests that PSAPS and OTCs would be appropriate for patients with up to a “moderate” hearing loss.
Discussion
With PSAPs becoming more readily available, there needs to be investigations to help guide the consumer and hearing healthcare provider to provide informed decisions concerning PSAPs as a viable treatment option. This study provides additional data to determine which of these devices would be most suitable for the eight audiometric profiles. REMs were performed for each device and the following general conclusions can be made:
- Both the recommendations of the PCAST1 and NASEM,2 as well as the recent law signed by the President, state that PSAPs/OTCs should be acceptable for “mild” and “moderate” hearing losses. Our test results do not fully support that recommendation. The results of this study found that some PSAPs may have a place for patients with “slight” to “mild” hearing loss, but none were found to be appropriate for greater magnitudes of hearing loss. Thus, a consumer and/or healthcare provider needs to be knowledgeable of when and how to utilize such products.
- Hearing aids have always been the gold standard for improving audibility for patients with hearing loss. This study documents that the “premium” and “basic” hearing aids provided adequate amplification to meet NAL-NL2 at 50 and 65 dB SPL input levels for the eight audiometric configurations evaluated.
- PSAPs are becoming more widely acknowledged by consumers and hearing healthcare providers. In the view of many audiologists and hearing healthcare providers, the consensus has been that PSAPs have no place, they lack quality, and could potentially take the focus off properly verified hearing aids as a primary treatment option. Through this project, however, it was found that some PSAPs may have a place for patients with “slight” to “mild” hearing loss, but one needs to be knowledgeable of when and how to utilize such products.
- In general, most of the PSAPs measured in the current study could match the target for “slight” to “mild” high-frequency hearing loss. Once the hearing loss became more moderate or severe and decreased in the mid and low frequencies, however, most PSAPs were not able to match NAL-NL2.
- For patients with “slight” to “mild” high-frequency hearing loss not ready to fully accept hearing aids, or have financial limitations, some PSAPs (PLAID, Nuheara IQbuds, Qleaf Lite, and Etimbre+ R1) may be a useful alternative. It is important to understand, however, that when compared to most hearing aids, PSAPs are generally very simplistic, lack programmability, and may even be less intuitive to operate than traditional hearing aids. They are, though, significantly less expensive than most hearing aids to the consumer. With hearing aid care, however, it is important to remember that costs are typically “bundled” which includes the devices and all professional services and follow-up care, ultimately leading to a higher “upfront” cost. Interestingly, there are hearing aids with lower invoice costs than several PSAPs used in this study, but again, the high cost paid by the consumer is typically a “bundled” cost, whereas the PSAP cost is likely not.
The authors’ hope is that, if appropriate PSAPs were promoted by audiologists, their utilization may be appropriate. Patients and audiologists would be able to make informed decisions and better understand the limitations of such devices. Hearing aids are still the gold standard for treating hearing loss, but PSAPs may certainly find a place in the future market. As a profession, audiologists and other hearing care professionals should consider embracing PSAPs rather than disregarding their existence.
Best Practice for Fitting Hearing Aids for Adults
It is important for the reader to understand that the authors believe that if audiologists would have followed Best Practice Guidelines23,24 (eg, used REM for all fittings, included measures of speech in noise, included questionnaires, implemented coupler measures as a means of quality control, etc) and clearly articulated the quality and magnitude of expertise and services involved in dispensing hearing aids, then perhaps the situation in which audiology finds itself (ie, the call for patient access to PSAPs and OTC products) may not have occurred. In addition, as mentioned above, the authors feel if audiologists had consistently counseled patients on the professional services accompanying dispensing hearing aids, then patients would have been better educated about why hearing aids dispensed by audiologists are more expensive than if purchased online or as an OTC.
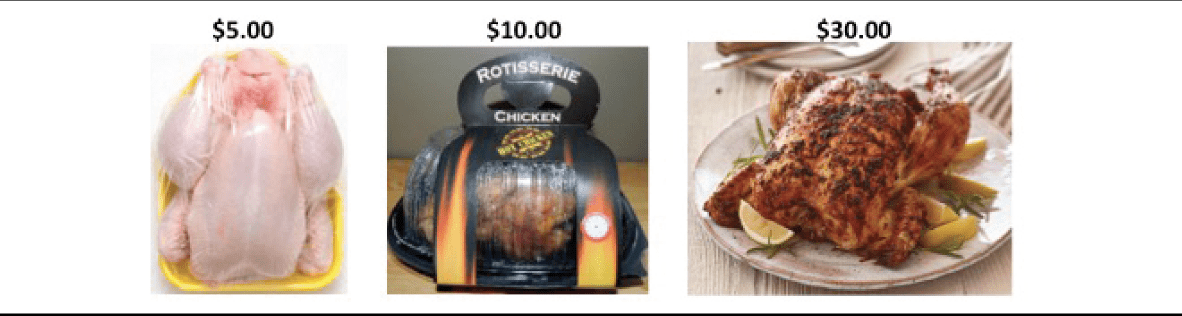
Figure 1. The chicken/hearing aid pricing analogy used by Dr Valente in his patient counseling readily shows how different services—in this case, the various states of preparation in a chicken dinner—result in widely different prices for what are essentially the same meal.
One of the authors (MV) uses the following analogy to counsel his patients on this topic. It is very simple and has been very effective. He shows a picture of three chickens, as shown in Figure 1: 1) A frozen chicken in the grocery store sold at $5.00; 2) the same chicken cooked and sold in a grocery store for $10.00; and 3) the same chicken cooked and prepared in a restaurant for $30. Even if, perhaps, audiologists had adopted an unbundled rather than bundled dispensing model, patients would have had a better understanding of the numerous steps involved in the hearing aid dispensing process. These steps include all the services provided from the time of the initial audiometric evaluation, to the time a patient decides to retain the hearing aids, through the warranty and extended warranty. The audiologist is also the one the patient will seek out to learn of new technologies and the audiologist is the one who must attend numerous hours of continuing education on the best ways to dispense these new technologies, as well as become familiar with new software updates.
Historically, audiologists have not been effective in educating patients on the very significant time and expertise components that are required to achieve optimal benefit from hearing aids. In addition, we have not been able to adequately explain to the public what differentiates them from the other available ways to acquire hearing aids.
As mentioned earlier, there are two Best Practice Guidelines addressing the dispensing of hearing aids to adult patients. One is from the American Speech-Language-Hearing Association (ASHA)23 and the other is from the American Academy of Audiology (AAA).24 Both guidelines are available on the website of the respective national organizations and in the reference section in the online version of this article. The major components of the guidelines entail Non-Auditory and Auditory Needs Assessment, Quality Control, and Verification and Validation (V&V) for every patient when dispensing hearing aids.
Non-auditory and auditory needs assessment refers to interacting with the patient informally via a case history, and formally via questionnaire(s) like the Characteristics of Amplification Tool (COAT)25 and Client Oriented Scale of Improvement (COSI)26 to gain information on the patient’s needs, goals, and preferences. These may include:
- Type and style of hearing aids,
- Visual acuity and manual dexterity,
- Computer and technology skills,
- Financial constraints,
- Cognitive function and status,
- Support system,
- Transportation,
- Realistic expectations,
- Motivation toward amplification,
- Telephone use and type of telephones used (landline versus cellphone),
- Cell phone type (eg, iPhone, Android),
- Looping venues nearby,
- Level of social activity,
- Occupational demands, and
- Quiet versus noisy background listening experiences.
Quality control includes coupler measures in a calibrated test box so that each hearing aid, new or repaired, adheres to ANSI S3.22-2009.18 This is also the time to verify that the earmolds and hearing aids are what had been ordered. In the case of repaired aids, coupler measures serve to verify that the defect responsible for sending the aid(s) for repair had been resolved and that the programs in the hearing aids when the aids were sent for repair are the same programs when received. Coupler measures should also be performed at the visit when the patient decides to retain his/her hearing aids; this coupler measure serves as a “baseline reference” for future visits. Quality control also serves to verify that the directional microphones are operating correctly and that the noise reduction feature is providing the magnitude of reduction as “advertised.” Examples of other measures may include battery drain, verification that the two wireless hearing aids or remote control are communicating with each other, as well as the transmitting microphone on a CROS/BiCROS is transmitting to the CROS/BiCROS receiver. Additionally, any remote microphones or other accessories will need to be paired to the hearing devices and verified to be working properly.
A new standard for measuring PSAPs has been introduced (ANSI-CTA-2051),27 but currently no hearing aid analyzer is capable of performing these tests. At least one manufacturer, however, at the time of writing, is assessing the feasibility of introducing this test sequence in a future software update.
V & V. Verification includes REM to verify that the measured REAR, REAG, or REIG matches a validated prescriptive target at multiple input levels (eg, 50, 65, and 80 dB SPL) for hearing aids with nonlinear signal processing, and at 60 or 65 dB SPL for hearing aids incorporating linear signal processing. Verification may also include measuring the patient’s unaided and aided performance of identifying speech in quiet or when embedded in noise. Examples of such speech tests are the QuickSIN,28 Words-in-Noise (WIN),29 Hearing in Noise Test (HINT),30 AzBio sentences,31 and Consonant-Vowel Nucleus-Consonant (CNC) words.32 In addition, when the difference between unaided and aided performance is quite large but still not ideal, the use of a wireless remote microphone could prove to be very beneficial. Lastly, the authors want to comment on the importance of assessing Maximum Power Output (MPO) of hearing devices to avoid loudness discomfort and to address any concerns with possibly damaging any residual hearing of the patient.
Validation is measuring the patient’s subjective impression of the benefit and/or satisfaction from the hearing aids. That is, did the hearing aids fulfill the objectives and satisfy the patient’s desires/goals when he/she purchased the hearing aids? Have the hearing aids improved performance in quiet and noise? Have the hearing aids made it easier to understand his/her spouse, grandchildren, workers, communication on the telephone, in the car, and in a house of worship? Is the sound quality acceptable? Are the hearing aids cosmetically appealing? Do the batteries last sufficiently long? Is the amplified sound comfortably loud and not excessively loud? Examples of questionnaires used clinically include the Abbreviated Profile of Hearing Aid Benefit (APHAB),33 COSI,26 Speech, Spatial and Qualities of Hearing Scale (SSQ),34 COAT,25 International Outcome Inventory for Hearing Aids (IOI-HA),35 and EARtrak.36
Other examples of applying Best Practice may include:
- Be certain the patient is seen in a timely manner. Also, when scheduled for an appointment, the patient is seen at the scheduled time.
- The audiologist critically analyzes the literature to determine if new technology and/or procedures should or should not be implemented into his/her practice.
- The importance of verifying and programming the frequency response of the telecoil to achieve 0 dB RSETS for improved performance when using the telecoil.
- Proper counseling on the care and operation of hearing aids, earmolds, batteries, remote microphones, smartphone apps, etc.
- Proper use of wax guards.
- Offer regularly scheduled post-fitting visits to be certain the hearing aids are providing maximum audibility
- Introducing, when necessary, Hearing Assistive Technology (HAT).
For more information see the AAA guidelines24 and a recent interview with Dr Valente in Hearing Review.39
More-recent Events and Comments
The OTC Hearing Aid Act was passed by the US House of Representatives and it was signed into law by the President on August 23, 2017. This new law requires the FDA to establish a new category of hearing aids for adults with perceived “mild-to-moderate” hearing loss that may be purchased without consultation from a licensed professional by August 2020. Specific safety, labeling, and manufacturing standards of OTC hearing aids have yet to be determined as different parties with opposing vested interests continue to debate appropriate product quality standards for this new class of hearing aids. Additionally, as this article was in press, the FDA granted “De Novo” status to the Bose Hearing Aid, which is a self-fitting hearing aid (see p 8 in this issue).
Using the products tested in this study, our data suggest that some PSAPs and OTC have the potential to be appropriate for “mild” hearing losses, but are not appropriate for hearing losses that are “moderate” or more severe.
References
-
President’s Council of Advisors on Science and Technology (PCAST). Aging America & hearing loss: Imperative of improved hearing technologies. https://obamawhitehouse.archives.gov/sites/default/files/microsites/ostp/PCAST/pcast_hearing_tech_letterreport_final.pdf. October 2015.
-
The National Academies of Sciences, Engineering, and Medicine (NASEM). Hearing health care for adults: Priorities for improving access and affordability. http://nationalacademies.org/hmd/Reports/2016/Hearing-Health-Care-for-Adults.aspx?utm_source=HMD+Email+List&utm_campaign=f6d2ada521-Hearing+Health+Care+for+Adults&utm_medium=email&utm_term=0_211686812e-f6d2ada521-180442165. June 2, 2016.
-
Consumer Electronics Association (CEA). Personal sound amplification products: A study of consumer attitudes and behavior. http://www.cta.tech/cta/media/policyImages/policyPDFs/Report-Personal-Sound-Amplification-Products-A-Study-of-Consumer-Att.pdf. August 2014.
-
Polletta M. Over-the-counter hearing aids could be coming soon. Why would that be a bad thing? The Arizona Republic. July 30, 2017. https://www.news-leader.com/story/news/nation-now/2017/07/30/over-the-counter-hearing-aids-could-coming-soon/523999001/
-
Calderone J. Can PSAPs help your hearing? Consumer Reports. February 2, 2017. https://www.consumerreports.org/hearing-ear-care/can-psaps-help-your-hearing
-
Andrews M. For mild to moderate hearing loss, you may not need a costly hearing aid. The Washington Post. July 30, 2017. https://www.washingtonpost.com/national/health-science/for-mild-to-moderate-hearing-loss-you-may-not-need-a-costly-hearing-aid/2017/07/28/4f44f13a-7249-11e7-8f39-eeb7d3a2d304_story.html?noredirect=on&utm_term=.386f9454d6ee
-
Pollack A Hearing aid prices under pressure from consumer electronics. New York Times. April 20, 2016. https://www.nytimes.com/2016/04/21/business/hearing-aid-business-feels-pressure-from-consumer-electronics.html
-
Hougaard S, Ruf S. EuroTrak I: A consumer survey about hearing aids in Germany, France and the UK. Hearing Review. 2011;18(2):12-28.
-
Bisgaard N, Ruf S. Findings from EuroTrak surveys from 2009 to 2015: Hearing loss prevalence, hearing aid adoption, and benefits of hearing aid use. Am J Audiol. 2017;26:451-461.
-
Callaway SL, Punch JL. An electroacoustic analysis of over-the-counter hearing aids. Am J Audiol. 2008;17(1):14-24.
-
Reed NS, Betz J, Kendig N, Korczak M, Lin FR. Personal sound amplification products vs a conventional hearing aid for speech understanding in noise. JAMA. 2017;318(1):89-90.
-
Cheng CM, McPherson B. Over-the-counter hearing aids: Electroacoustic characteristics and possible target client groups. Audiol. 2000;39(2):110-116.
-
Smith C, Wilber LA, Cavitt K. PSAPs vs hearing aids: An electroacoustic analysis of performance and fitting capabilities. Hearing Review. 2016;23(7):18-24.
-
Xu J, Johnson J, Cox R, Breitbart D. Laboratory comparison of PSAPs and hearing aids. Paper presented at: American Auditory Society Convention;March 2015; Scottsdale, AZ. http://www.harlmemphis.org/files/9814/2593/1864/XuAAS2015_PSAPs.pdf
-
Chan ZYT, McPherson B. Over-the-counter hearing aids: A lost decade for change. Biomed Res Int. 2015;827463:1-15.
-
Humes LE, Rogers SE, Quigley TM, Main AK, Kinney DL, Herring C. The effects of service-delivery model and purchase price on hearing-aid outcomes in older adults: A randomized double-blind placebo-controlled clinical trial. Am J Audiol. 2017;26:53-79.
-
Reed NS, Betz J, Lin FR, Mamo SK. Pilot electroacoustic analyses of a sample of direct-to-consumer amplification products. Otol Neurotol. 2017;38(6):804-808.
-
Specifications of hearing aid characteristics—ANSI S3.22–2009. American National Standards Institute (ANSI).
-
Keidser G, Dillon HR, Flax M, Ching T, Brewer S. The NAL-NL2 prescription procedure. Audiol Res. 2011;1(1):e24.
-
Holube I, Fredelake,S, Vlaming M, Kollmeier B. Development and analysis of an International Speech Test Signal (ISTS). Int J Audiol. 2010;49(12):891-903
-
Kirkwood DH. Survey: Dispensers fitted more devices in 2005 at higher prices. Hear Jour. 2006;59(4):48.
-
British Society of Audiology and British Academy of Audiology. Guidance on the use of real ear measurement to verify the fitting of digital signal processing hearing aids. http://www.thebsa.org.uk/wp-content/uploads/2014/04/REM.pdf. July 2007.
-
Valente M, Bentler R, Seewald R, Trine T, Van Vliet D. Guidelines for hearing aid fitting for adults. Am J Audiol. 1998;7:5-13.
-
Valente M, Abrams H, Benson D, et al [American Academy of Audiology Task Force]. Guidelines for the audiologic management of adult hearing impairment. Audiology Today. 2016;18(5):1-44.
-
Sandridge SA, Newman CW. Improving the efficiency and accountability of the hearing aid selection process-Use of the COAT. AudiologyOnline. March 6, 2006.
-
Dillon H, James A, Ginis J. Client Oriented Scale of Improvement (COSI) and its relationship to several other measures of benefit and satisfaction provided by hearing aids. J Am Acad Audiol.1997;8:27-43.
-
Personal Sound Amplification Performance Criteria—ANSI/CTA-2051. Consumer Technology Association. https://standards.cta.tech/kwspub/published_docs/ANSI-CTA-2051-2017_Preview.pdf. January 2017.
-
Killion MC, Niquette PA, Gudmundsen GI, Revit LJ, Banerjee S. Development of a quick speech-in-noise test for measuring signal-to-noise ratio loss in normal-hearing and hearing-impaired listeners. J Acoust Soc Am. 2004;116(4):2395-2405.
-
Wilson RH, Carnell CS, Cleghorn AL. The Words-in-Noise (WIN) test with multitalker babble and speech spectrum noise maskers. J Am Acad Audiol. 2007;18(6):522-529.
-
Nilsson M, Soli SD, Sullivan JA. Development of the Hearing in Noise Test for the measurement of speech reception thresholds in quiet and in noise. J Acoust Soc Am. 1994;95(2):1085.
-
Spahr AJ, Dorman MF, Litvak LM, et al. Development and validation of the AzBio sentence lists. Ear Hear. 2012;33(1):112–117.
-
Peterson GE, Lehiste I. Revised CNC lists for auditory tests. J Speech Hear Disord. 1962;27(1):62-70.
-
Cox RM, Alexander GC. The abbreviated profile of hearing aid benefit. Ear Hear. 1995;16:176-186.
-
Gatehouse S, Noble W. The speech, spatial and qualities of hearing scale (SSQ). Int J Audiol. 2004;43(2):85–99.
-
Cox RM, Alexander GC. The International Outcome Inventory for Hearing Aids (IOI-HA)—Psychometric properties of the English version. Int J Audiol. 2002;41(1):30-35.
-
Clutterbuck N, Clutterbuck S. Fish! for hearing care professionals. Hearing Review. 2007;14(13):22-24.
-
Bisgaard N, Vlaming MSMG, Dahlquist M. Standard audiograms for the IEC 60118-15 measurement procedure. Trends Ampl. 2010;14(2):113-120.
-
Folkeard P, Pumford J, Narten P, Scollie S. Verifying bilaterally linked and monaural telephone programs in hearing aids. Hearing Review. 2017;24(3):30-38.
-
Beck DL. Best practices in hearing aid dispensing: An interview with Michael Valente, PhD. Hearing Review. 2017;24(12):39-41.
About the authors: Adam Voss, AuD, is a Clinical Audiologist at the Washington University School of Medicine, Center of Advanced Medicine in St Louis; Kristi Oeding, AuD, is a PhD student at the University of Minnesota-Twin Cities in Minneapolis; A.U. Bankaitis, PhD, is Vice President of Oaktree Products Inc in Chesterfield, Mo; John Pumford, AuD, is Director of Audiology and Education at Audioscan in Dorchester, Ontario; and Michael Valente, PhD, is Professor of Clinical Otolaryngology and the Director of Adult Audiology at Washington University in St Louis School of Medicine in the Department of Otolaryngology Head-Neck Surgery.
Correspondence can be addressed to Hearing Review or Dr Voss at: [email protected]
Citation for this article. Voss A, Oeding K, Bankaitis AU, Pumford J, Valente M. Coupler and real-ear performance between PSAPs and hearing aids. Hearing Review. 2018;25(11):10-18.