Demographics and perceptions of owners and non-owners of hearing aids, PSAPs, and implants.
Research | May 2022 Hearing Review
By Thomas A. Powers, PhD, and Kate Carr
MarkeTrak 2022 updates and extends the findings of MT10 (2019) generated by this series of consumer surveys—the most comprehensive and oldest of its kind, dating back to 1989—of hearing aid users and non-users in the United States. In particular, MT2022 includes new information about hearing aid use by gender and race, and also includes data on cochlear implant use and personal sound amplification products (PSAPs), as well as the emerging class of what may soon become over-the-counter (OTC) hearing aids.
“It is not the strongest of the species that survive, not the most intelligent, but the one most responsive to change.” — Charles Darwin
To understand where you are going, it is helpful to know where you have been.
As a prelude to this article on the findings of the Hearing Industries Association’s (HIA) most recent MarkeTrak survey, we reflected on past findings that chart the successes and continued challenges facing both consumers and the hearing healthcare community. In 1989,the first MarkeTrak survey1 was mailed to 20,000 members of the National Family Opinion mail panel, and continued as a written survey through MarkeTrak VIII2 before converting to an online survey platform in 2014 with MarkeTrak 9 (MT9).3 Like our most recent surveys, the 1989 survey was balanced to US Census information with respect to market size, age and size of household, and income. Here are some interesting historical findings from the first survey that we have compared with results from MarkeTrak 2022:
- Satisfaction with hearing instruments was 58% in 1989, increasing to 83% in 2022.
- Binaural Ownership was 38.8% and is now 70% for those fitted in person.
- In the first survey, third party payment was 20% and has now increased as more than half of current owners (54%) report some assistance to cover the cost of hearing aids.
- The average age of purchasers was 66.9 years in 1989 and has decreased to 60 years today with some exceptions related to buying channels.
- In 1989, the data suggested that people who wear hearing instruments were perceived to be less competent, less attractive, less youthful, and more disabled. Currently, hearing aid owners rarely or never feel embarrassed or rejected.
- Less than 1 in 5 reported that their doctor screened them for hearing loss in our first survey. Today, more individuals (52%) discuss their hearing difficulties and are encouraged by their physician to seek hearing aids.
The initial MarkeTrak report concluded “that there were significant opportunities, as well as significant obstacles, with respect to further consumer adoption.”
Now with the introduction of the new category of over-the-counter (OTC) hearing aids expected to replace direct-to-consumer (DTC) sales, we may see further changes, with new industry entrants, continued improvements in technology from existing manufacturers, and a growing focus on the importance of hearing health evident in research and legislation. Those changes will impact everyone involved in the delivery of hearing healthcare: component suppliers, manufacturers of hearing devices, hearing care professionals, and consumers—all will be touched by these developments.
With that as a reminder of HIA’s initial consumer observations, let’s take a closer look at US hearing healthcare today.
Examining Hearing Difficulty
The research method for MT2022 was like that of MT93 and MT10,4 using an online survey protocol to collect the data. This survey was fielded by Az Marketing Research, Inc in November and December of 2021 to reach 15,138 households in the Unites States, balanced and weighted to key US Census characteristics (Figure 1). From this group there were almost 44,000 individuals that completed Part 1 of the survey to estimate rates. The respondents were asked multiple health-related questions to hide the hearing health nature of the survey. Since aspects of overall health were collected from participants, the results also provide valuable information regarding comorbidities for persons with hearing impairment.

Figure 1. Sampling rate for MarkeTrak2022 (MT2022).
The self-reported hearing difficulty rate has been in the 10-11% range for all the MarkeTrak studies since 1989. As shown in Figure 2, the rate of hearing difficulty steadily increases until age 55, when the rate develops a steeper upward slope. When compared to rates in MT10 (2019), hearing difficulty increased from 32.8% to 34.1% for individuals 75-84 years old, and individuals 85 years of age and older self-reported a hearing difficulty that increased from 50.5% to 55.7%. Likewise, the self-reported hearing difficulty rate increased among those 25-34 years old (from 5.2% to 6.5%) and those 35-44 years old (from 5.6% to 7.5%). While the differences are subtle, they merit watching in the future given concerns about hearing difficulty from noise exposure.
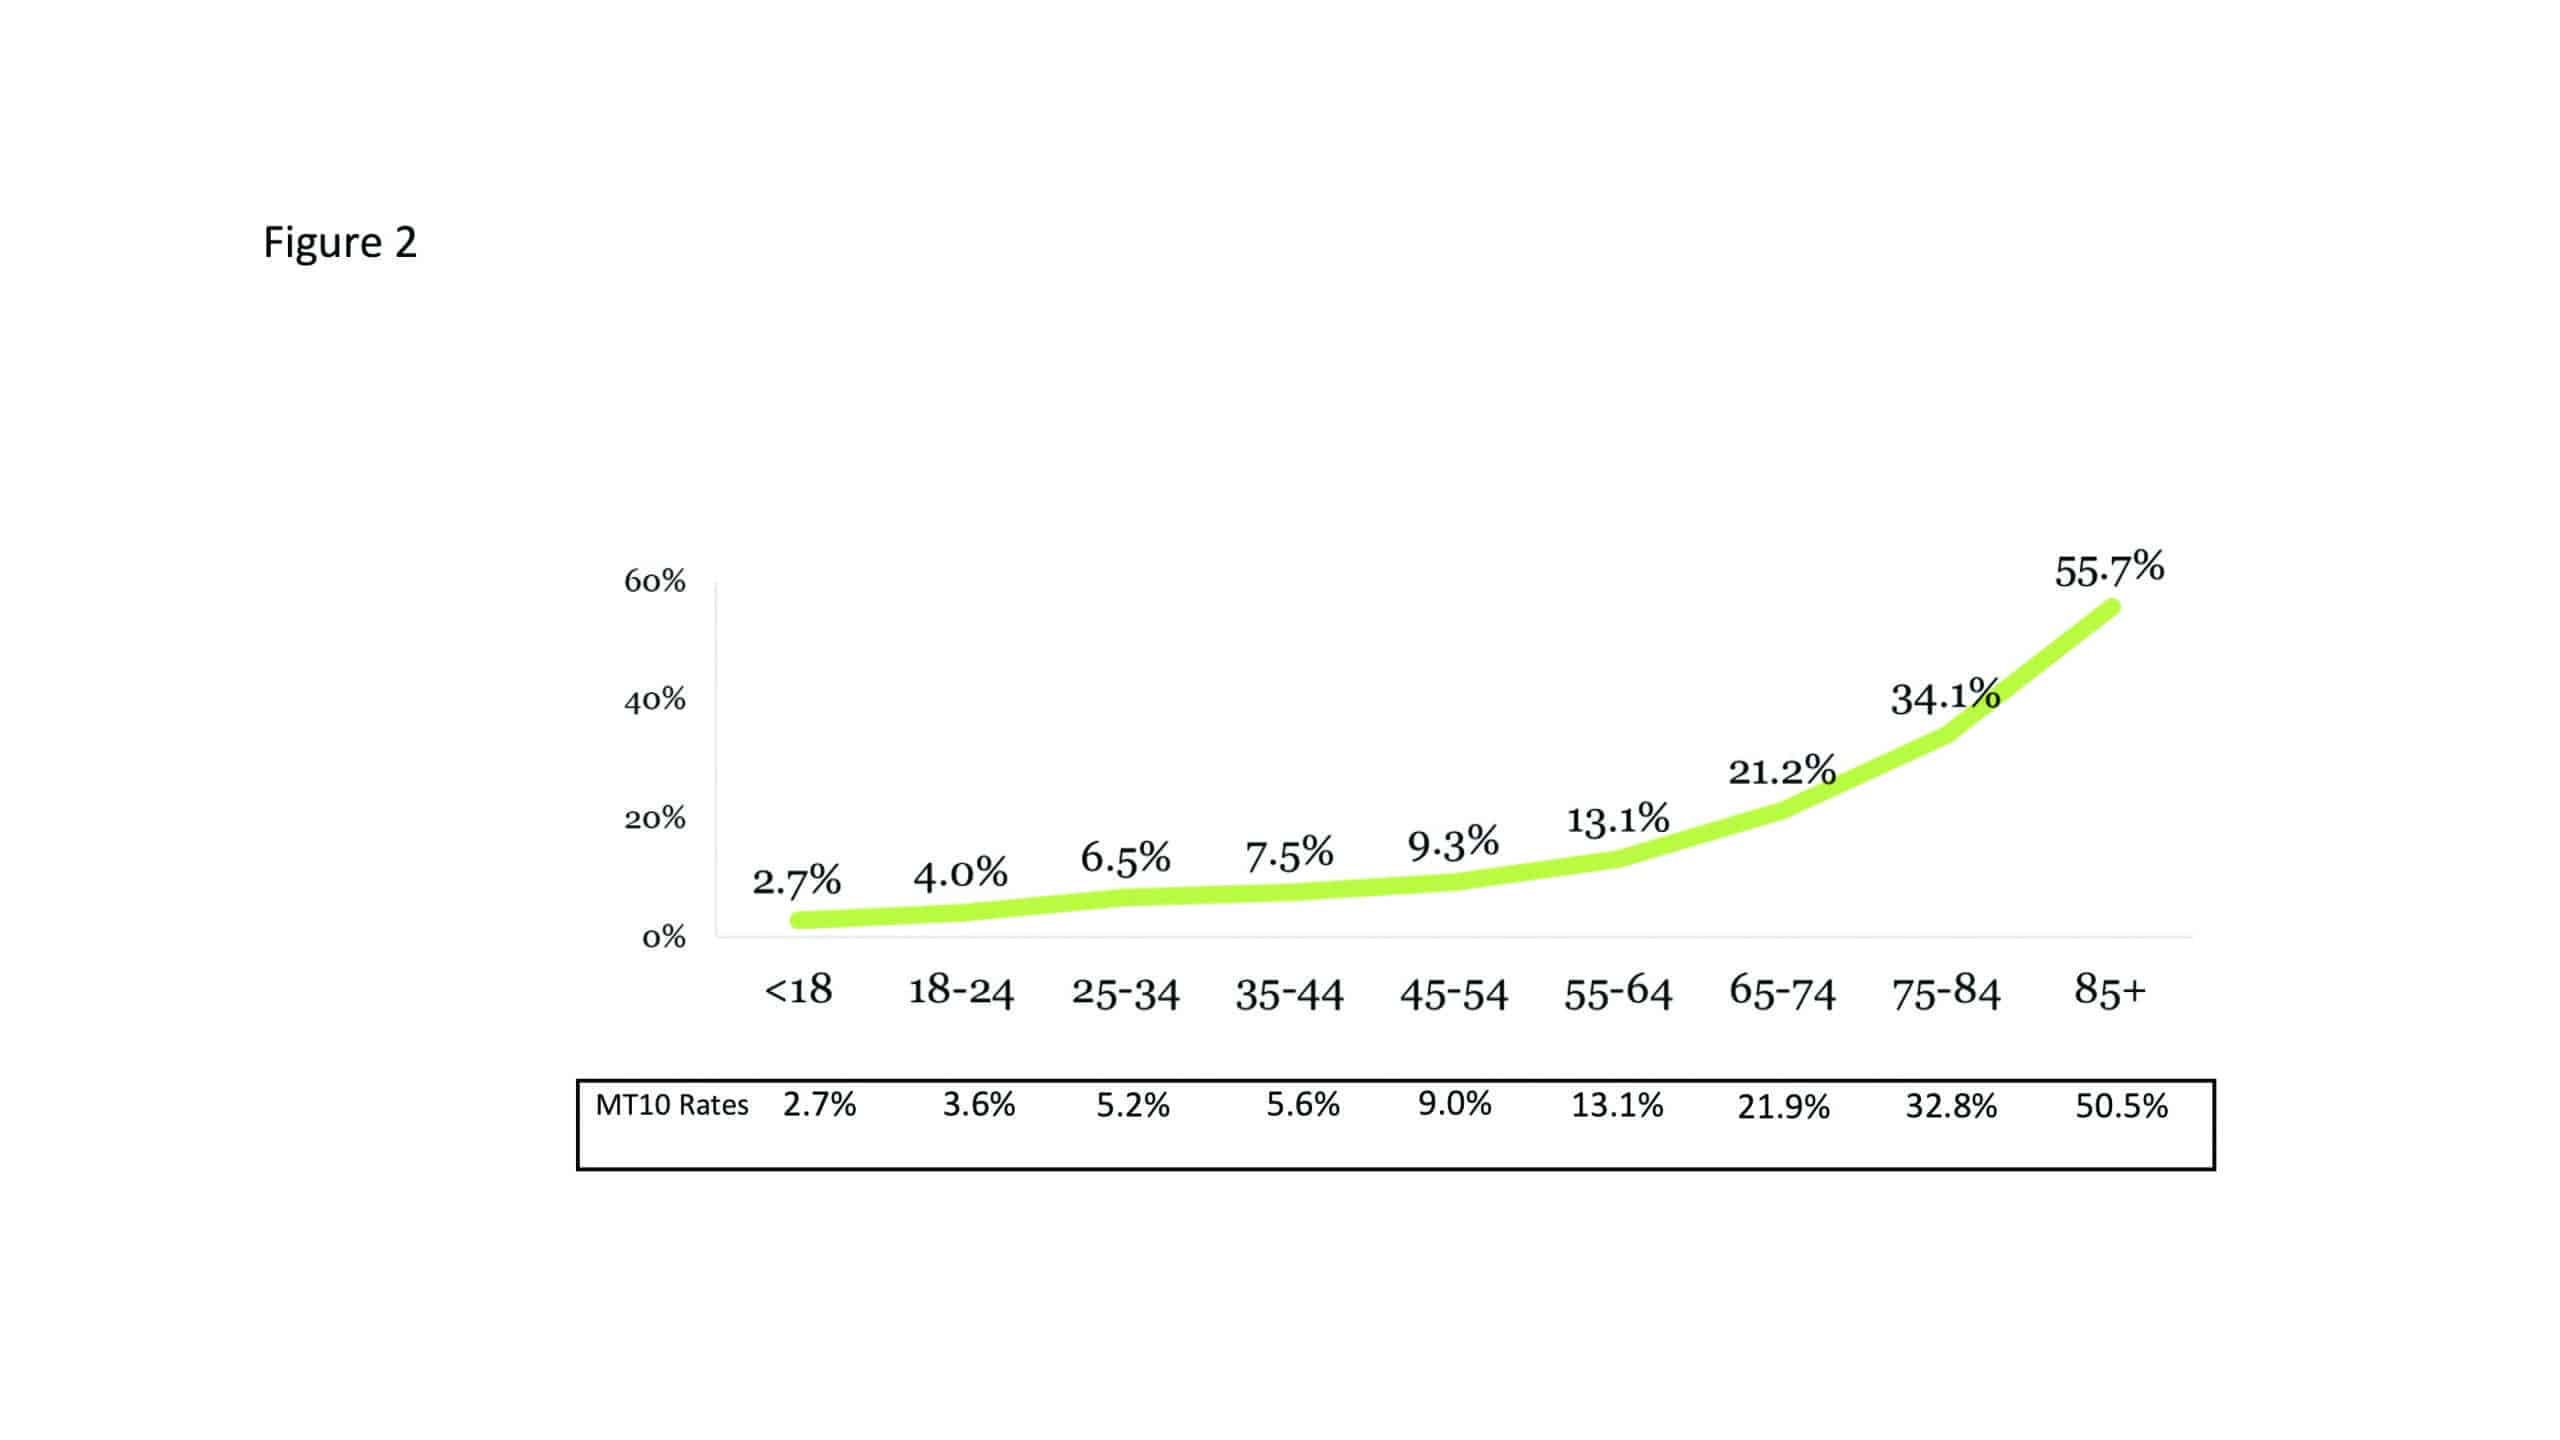
Figure 2. Self-reported hearing difficulty shown by age (n= 43957). Also shown are hearing difficulty rates from MT10 for comparison.
The proportion of self-reported individuals with bilateral hearing difficulty is 70%, a slight decrease from other recent surveys.
Hearing difficulty rates by gender continue to show a higher prevalence in males (11.3%) as compared to females (9.1%). When diving deeper into hearing difficulty by race, we see a disproportionately low rate of self-reported hearing difficulty for persons who are black as compared to other races in Figure 3. This is consistent with other studies and requires more research to fully understand the potential causes for this trend.
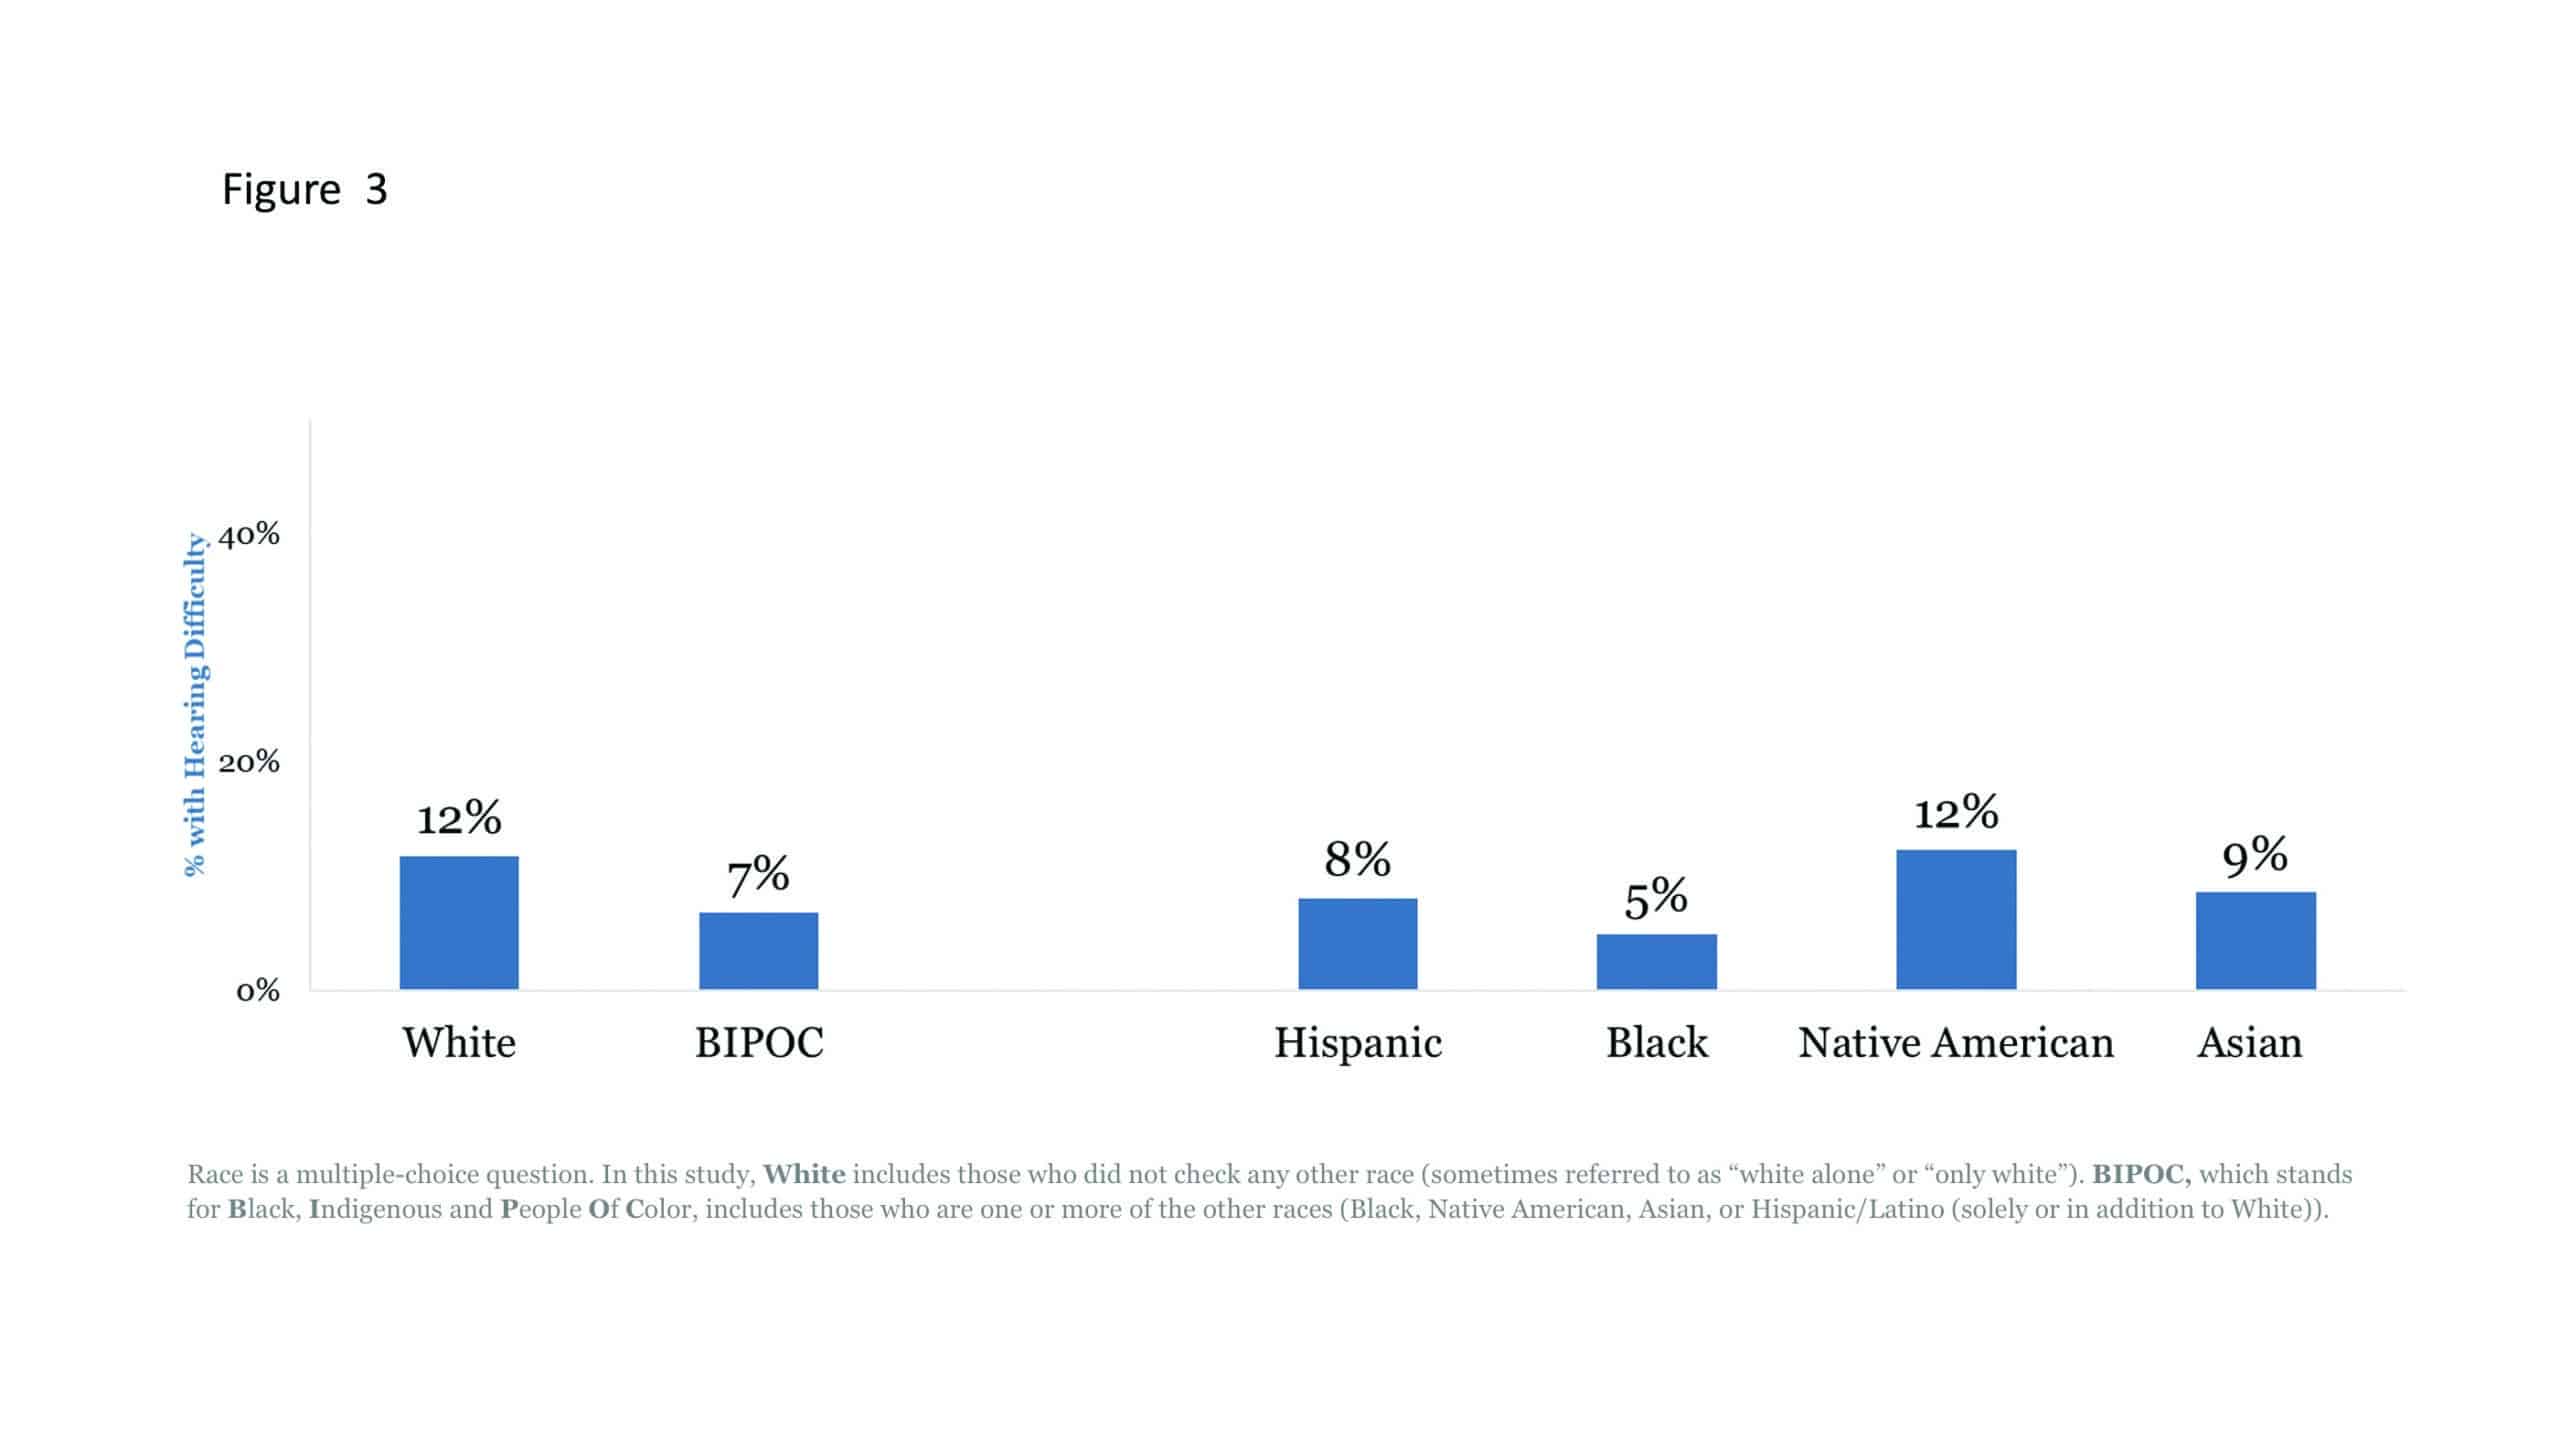
Figure 3. Self-reported hearing difficulty by race. The question about race was multiple choice: White includes those who did not check any other race (sometimes referred to as “white alone” or “only white.” BIPOC, which stands for “Black, Indigenous, and People of Color” includes those who are one or more of the other races (Black, Native American, Asian, or Hispanic/Latino (solely or in addition to White).
Unsurprisingly, the survey revealed a decrease of 11% in hearing tests administered by a professional in the last year. This could be attributed to the impact of COVID-19 or the increase in use of online screening tools as 1 in 4 individuals reported this action.
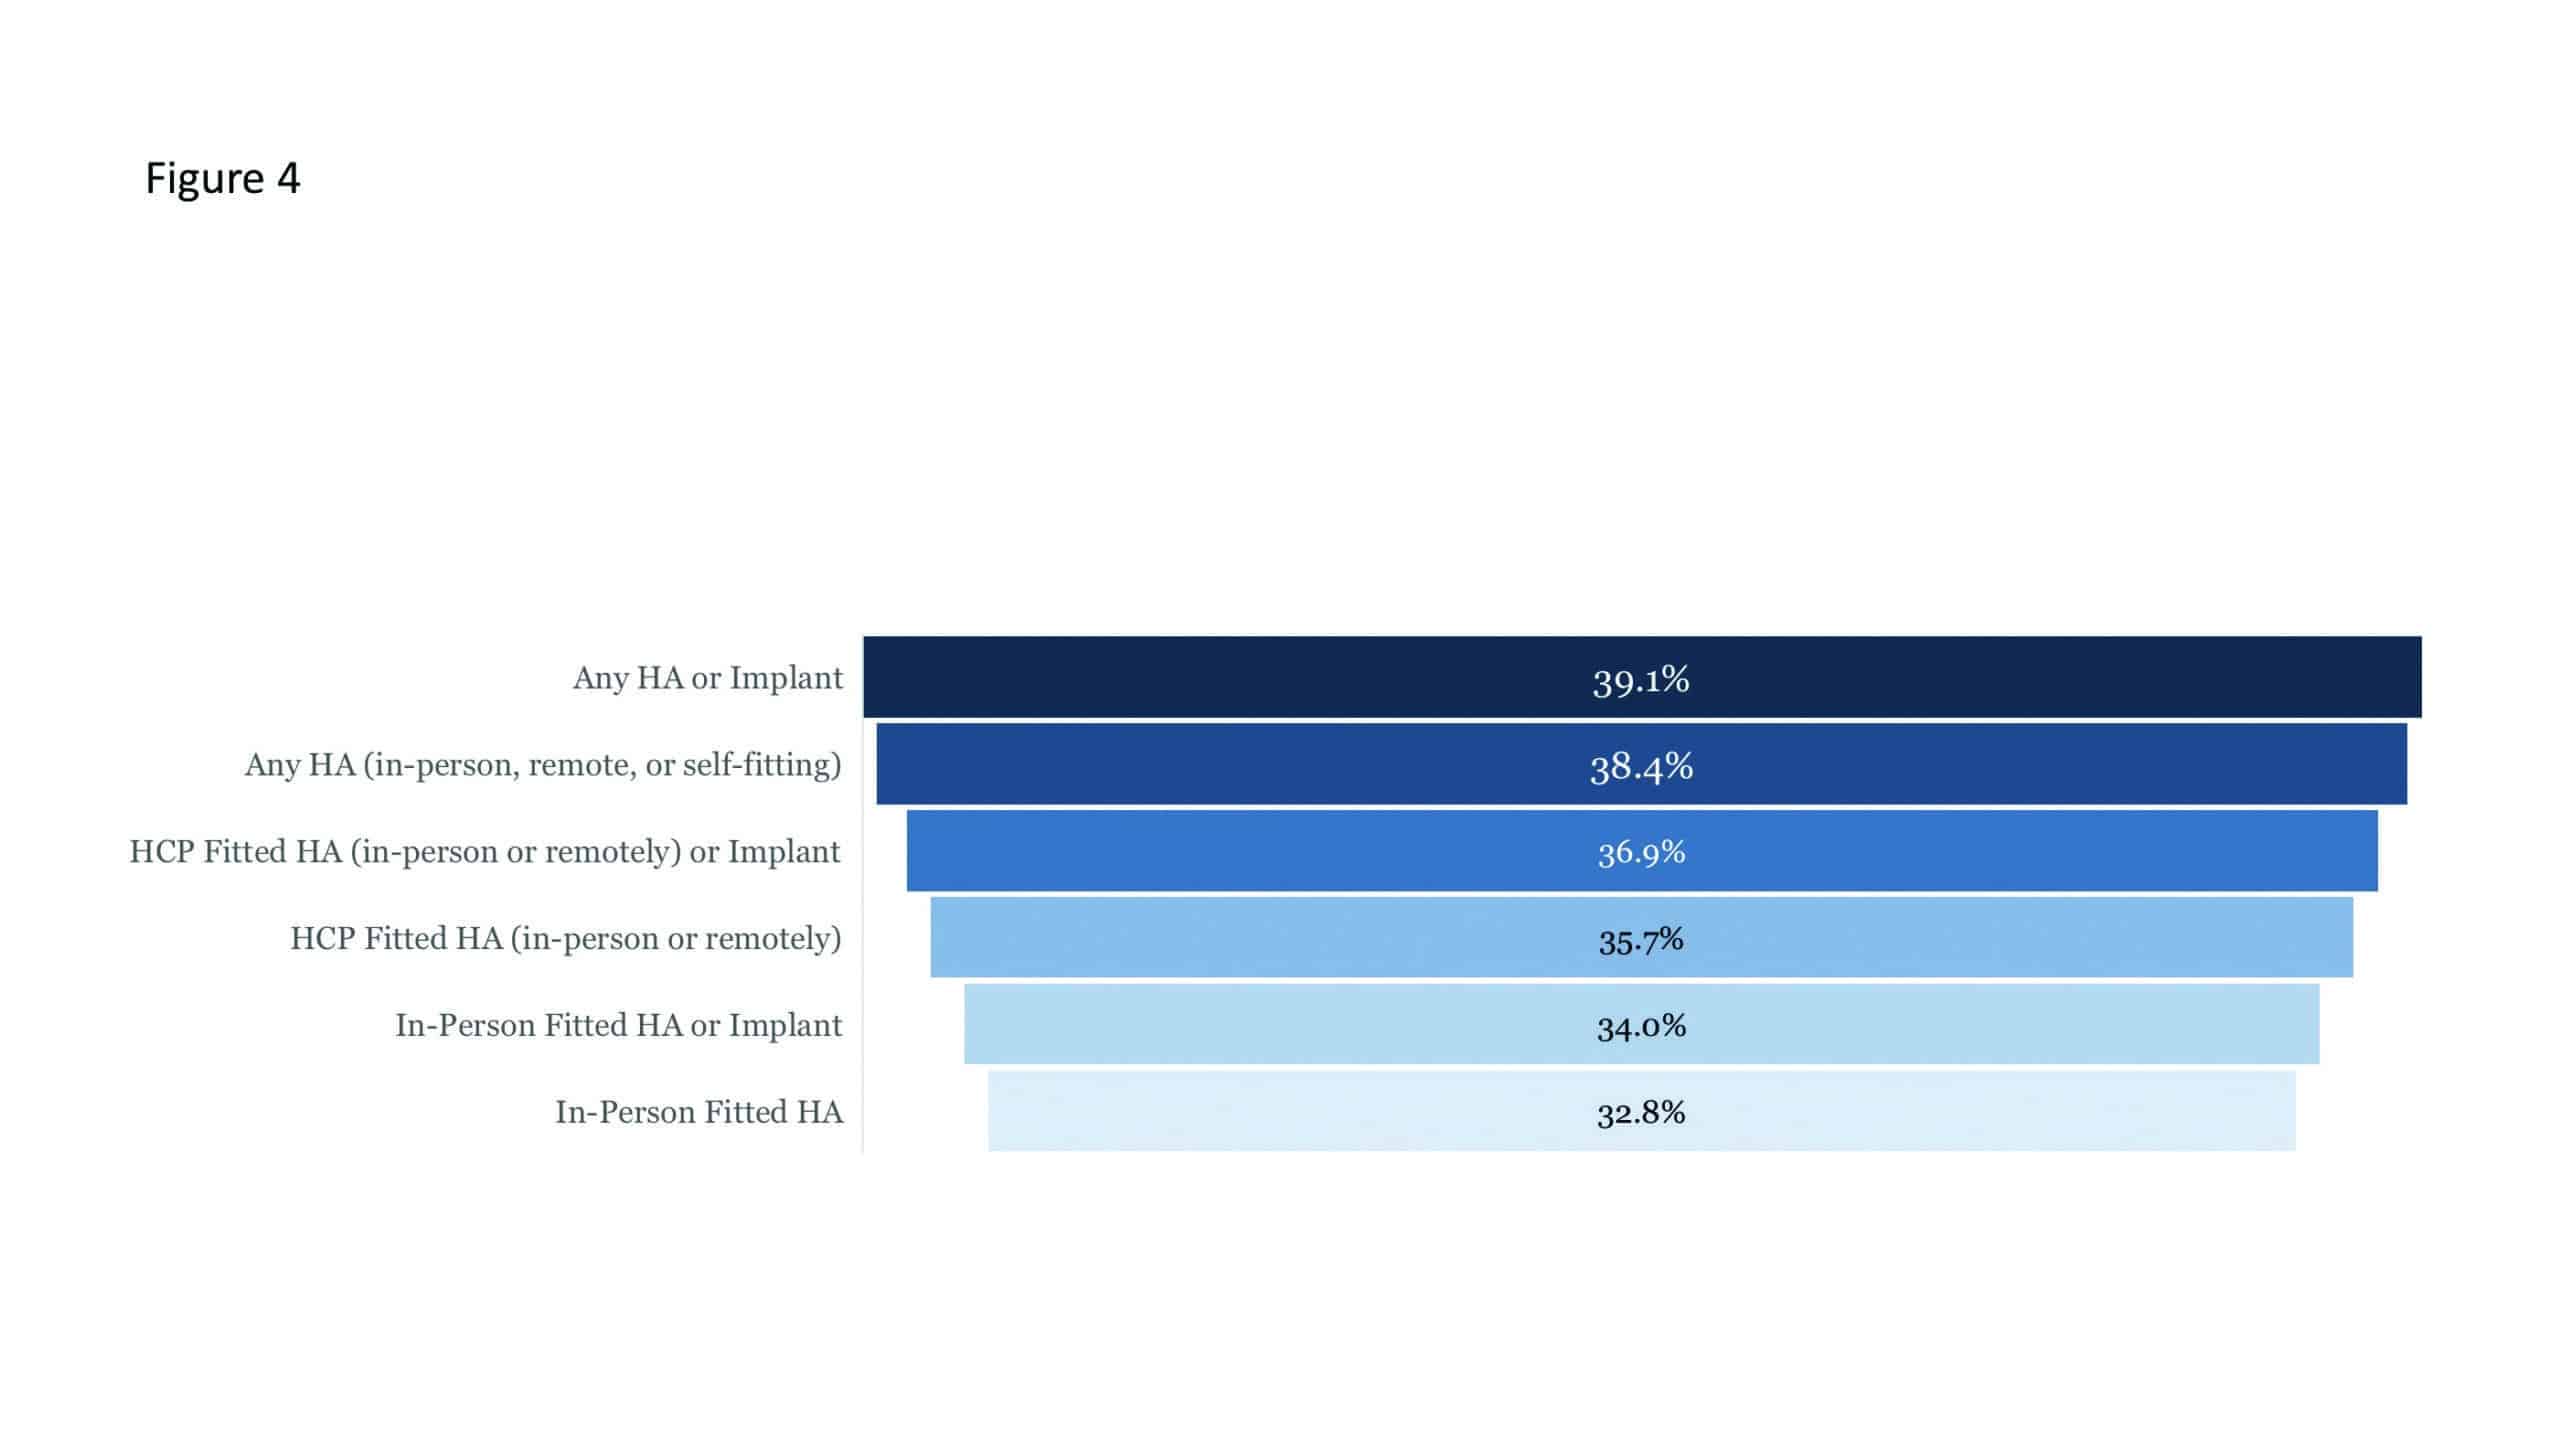
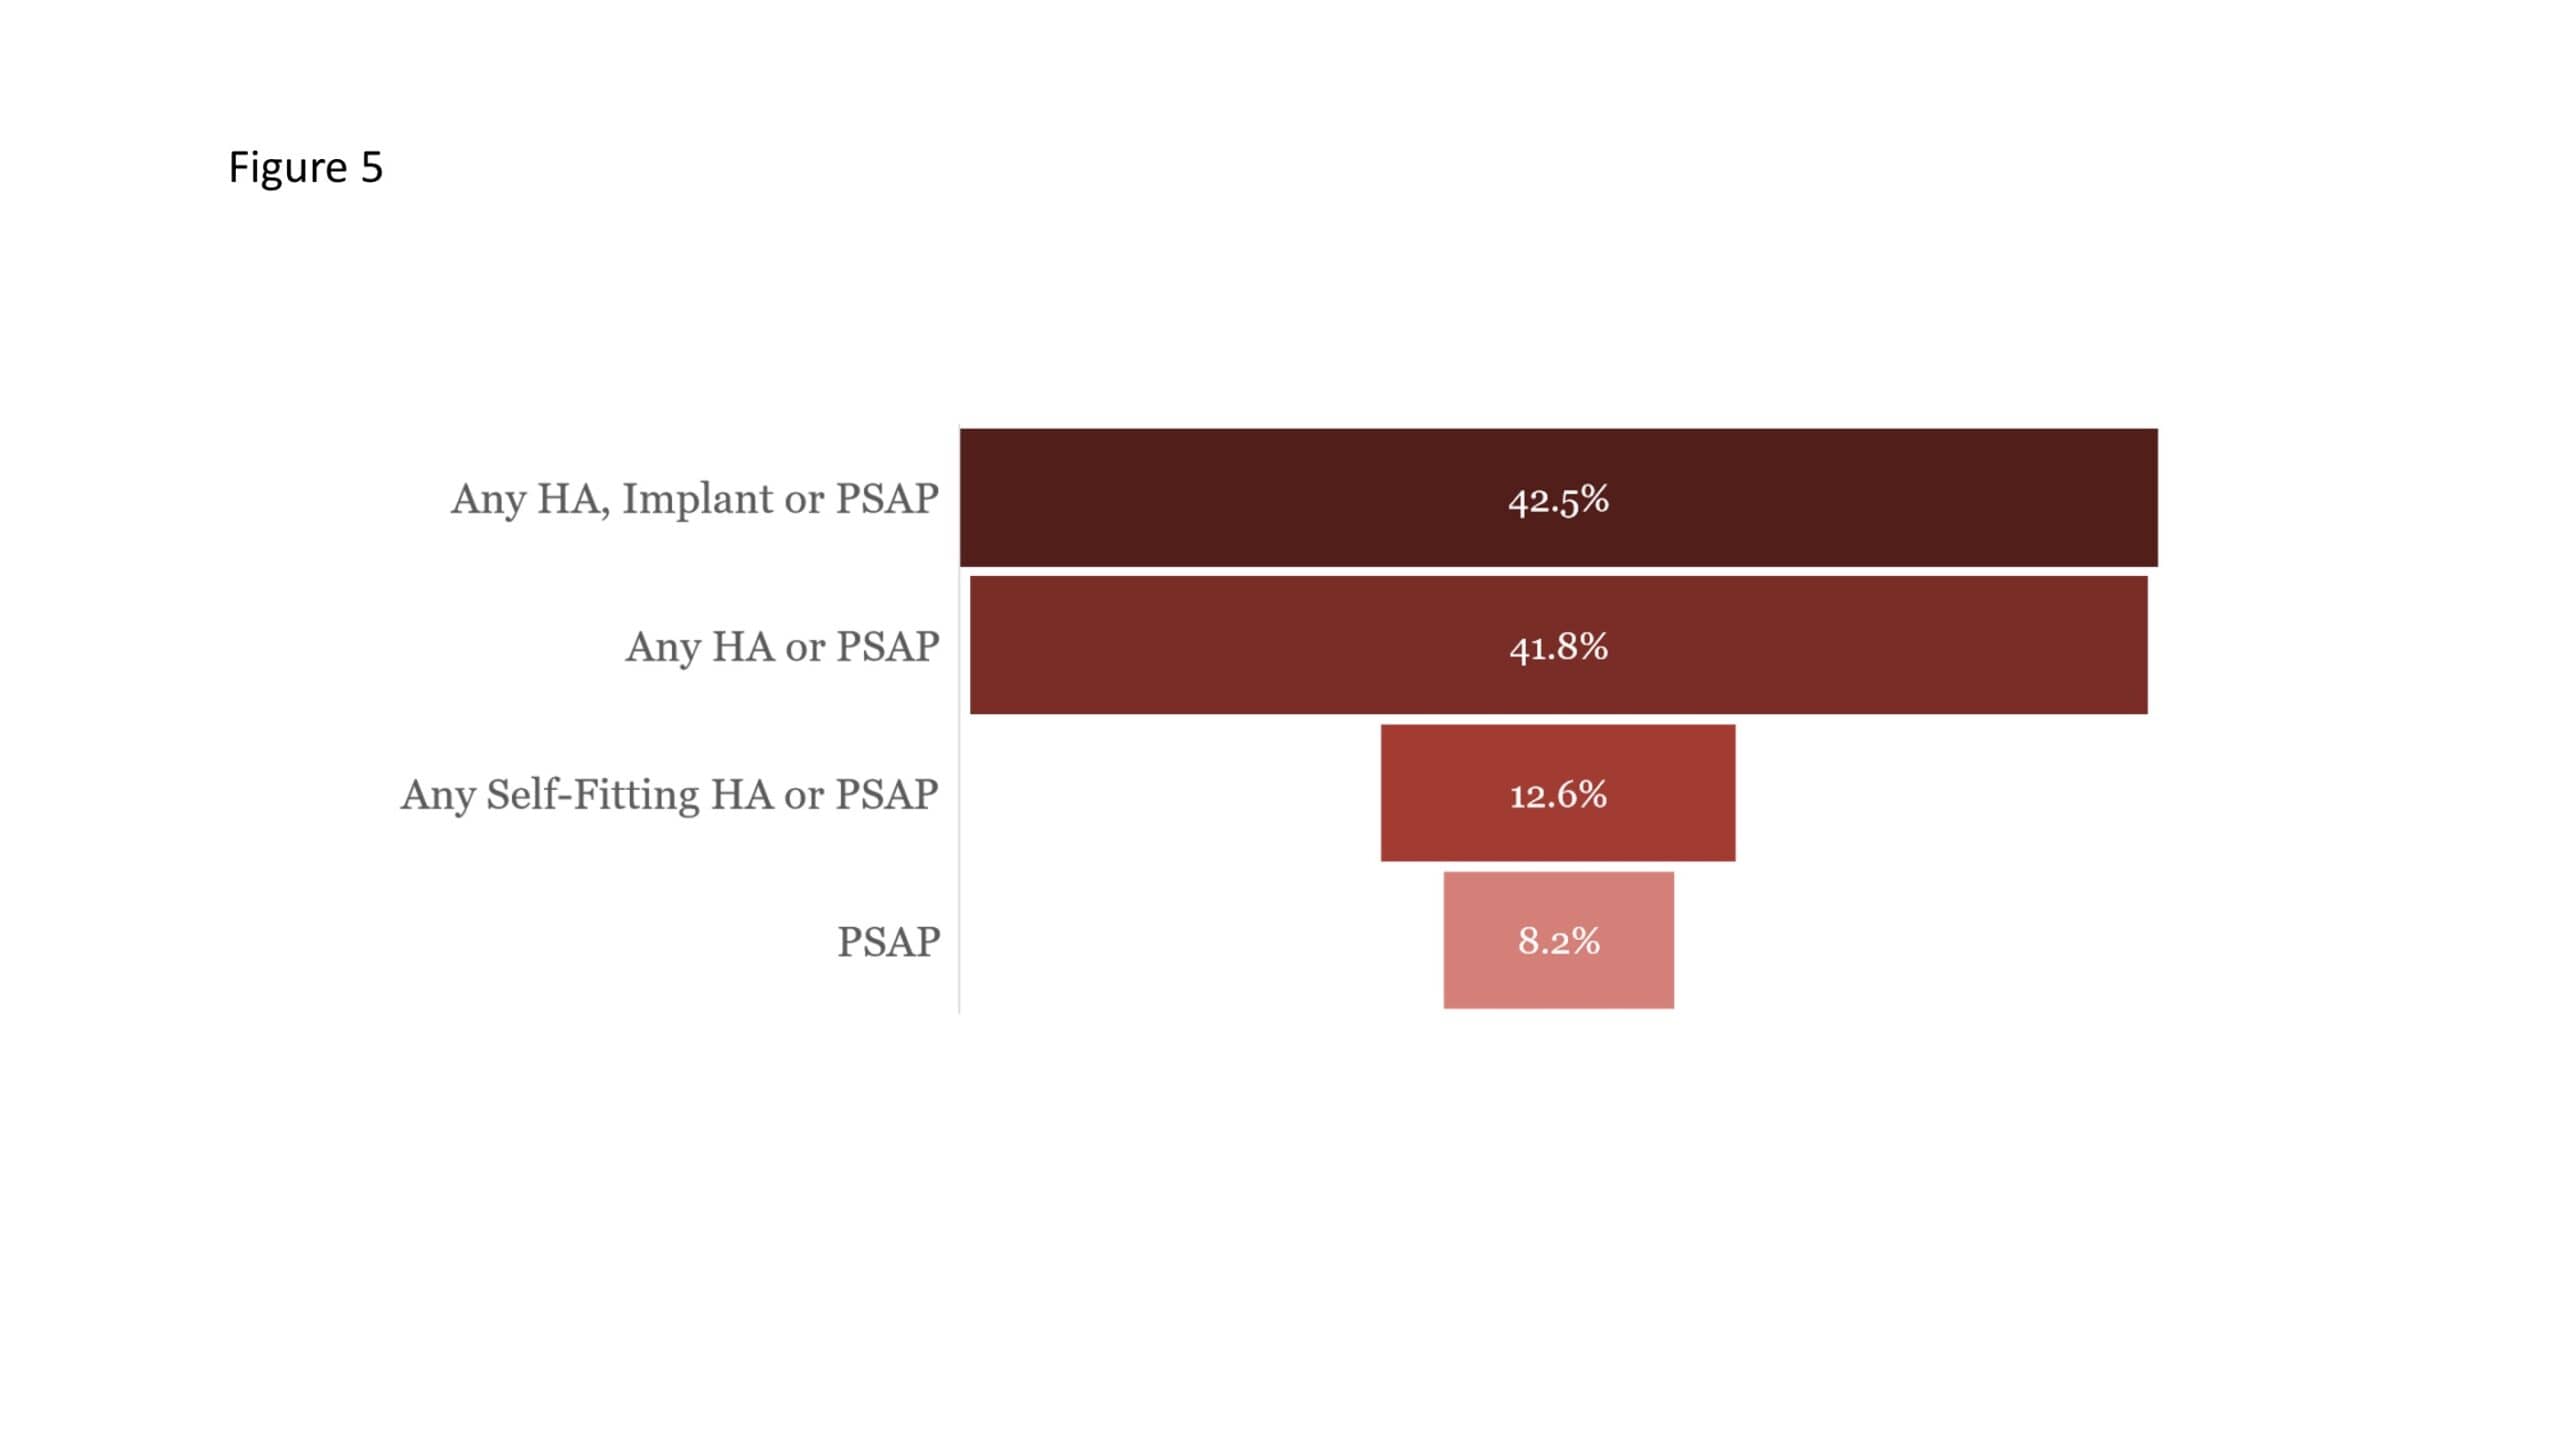
To understand the changing market space, we expanded our definitions to include hearing aids fitted in person by a professional, hearing aids fitted remotely by a professional, hearing aids with no fitting assistance, hearing implants, and personal sound amplification products (PSAPs). Almost 4 in 10 (38.4%) individuals with hearing difficulty reported having a hearing aid as shown in Figure 4. When hearing aids, PSAPs, and implants are considered, the net adoption rate among those with hearing difficulty increases to 42.5% (Figure 5).
The survey also found that those with hearing difficulty have higher rates of many common conditions and are over 3.5 times more likely to have tinnitus, cognition/memory issues, and falling and balance issues. Non-owners are at a greater risk of depression that increases with a greater level of hearing difficulty.
The role of the primary care physician has been increasing over time. For those who self-reported hearing difficulty, 52% discussed their hearing with a medical doctor and one-fifth (18%) of them then received a recommendation to get a hearing device.
Survey respondents who indicated that they had hearing difficulty, owned a hearing aid or other device, or had visited a hearing care professional related to the self-reported hearing difficulty were invited to participate further. The respondents from Part 2 included 1,139 owners and 2,079 non-owners and was weighted to align with the key characteristics and adoption rates as in Part 1. By collecting data on hearing aids fitted in-person, remotely, and self-fit, we are beginning to understand consumers’ choices given the emerging channels. As with MT10, we collected data on the use of PSAPs and for the first time included those with cochlear implants.
Owners of hearing devices
Average Time to Take Action on Hearing Difficulty
Once aware of hearing difficulty, it takes an average of 4 years for individuals to visit a doctor or hearing care professional. Over the years, there has been a great deal of attention on the number of years it takes a person to visit a hearing care professional and then move forward to obtain a hearing aid. Reducing this lag time has been a significant challenge. Our survey reveals a one-year decrease, from 5 years to 4 years, from first report of hearing difficulty to the first visit to a hearing care professional.
Another positive finding is the time from first self-reporting or noticing a hearing difficulty to getting their first hearing aid. The wait time dropped to 4 years compared with 6 years in MT10 (Figure 6). The overall interest in hearing health solutions may be driven by improvements in technology, increased insurance coverage, or the expanded market channels now available to consumers. It could also be a result of educational efforts and media coverage of the link between untreated hearing loss and comorbidities, including social isolation and depression, cognitive decline, and dementia (see the respective literature reviews by Bray,5 Abrams,6 and Beck & Harvey7 on these topics in The Hearing Review).

While no direct link has yet been demonstrated in peer-reviewed literature, several studies have shown a relationship and indicate that treating hearing loss may delay the effects of cognitive decline. For example, in 2020, The Lancet Commission reported that up to 40% of dementia was modifiable.8 Among the 12 risk factors, hearing loss remains the most significant with a Population Attributable Factor (PAF) of 9%. The Commission calls for nine actions to be undertaken by policy makers, including “Encourage use of hearing aids for hearing loss and reduce hearing loss by protecting ears from high noise levels.”8
First-time Buyers
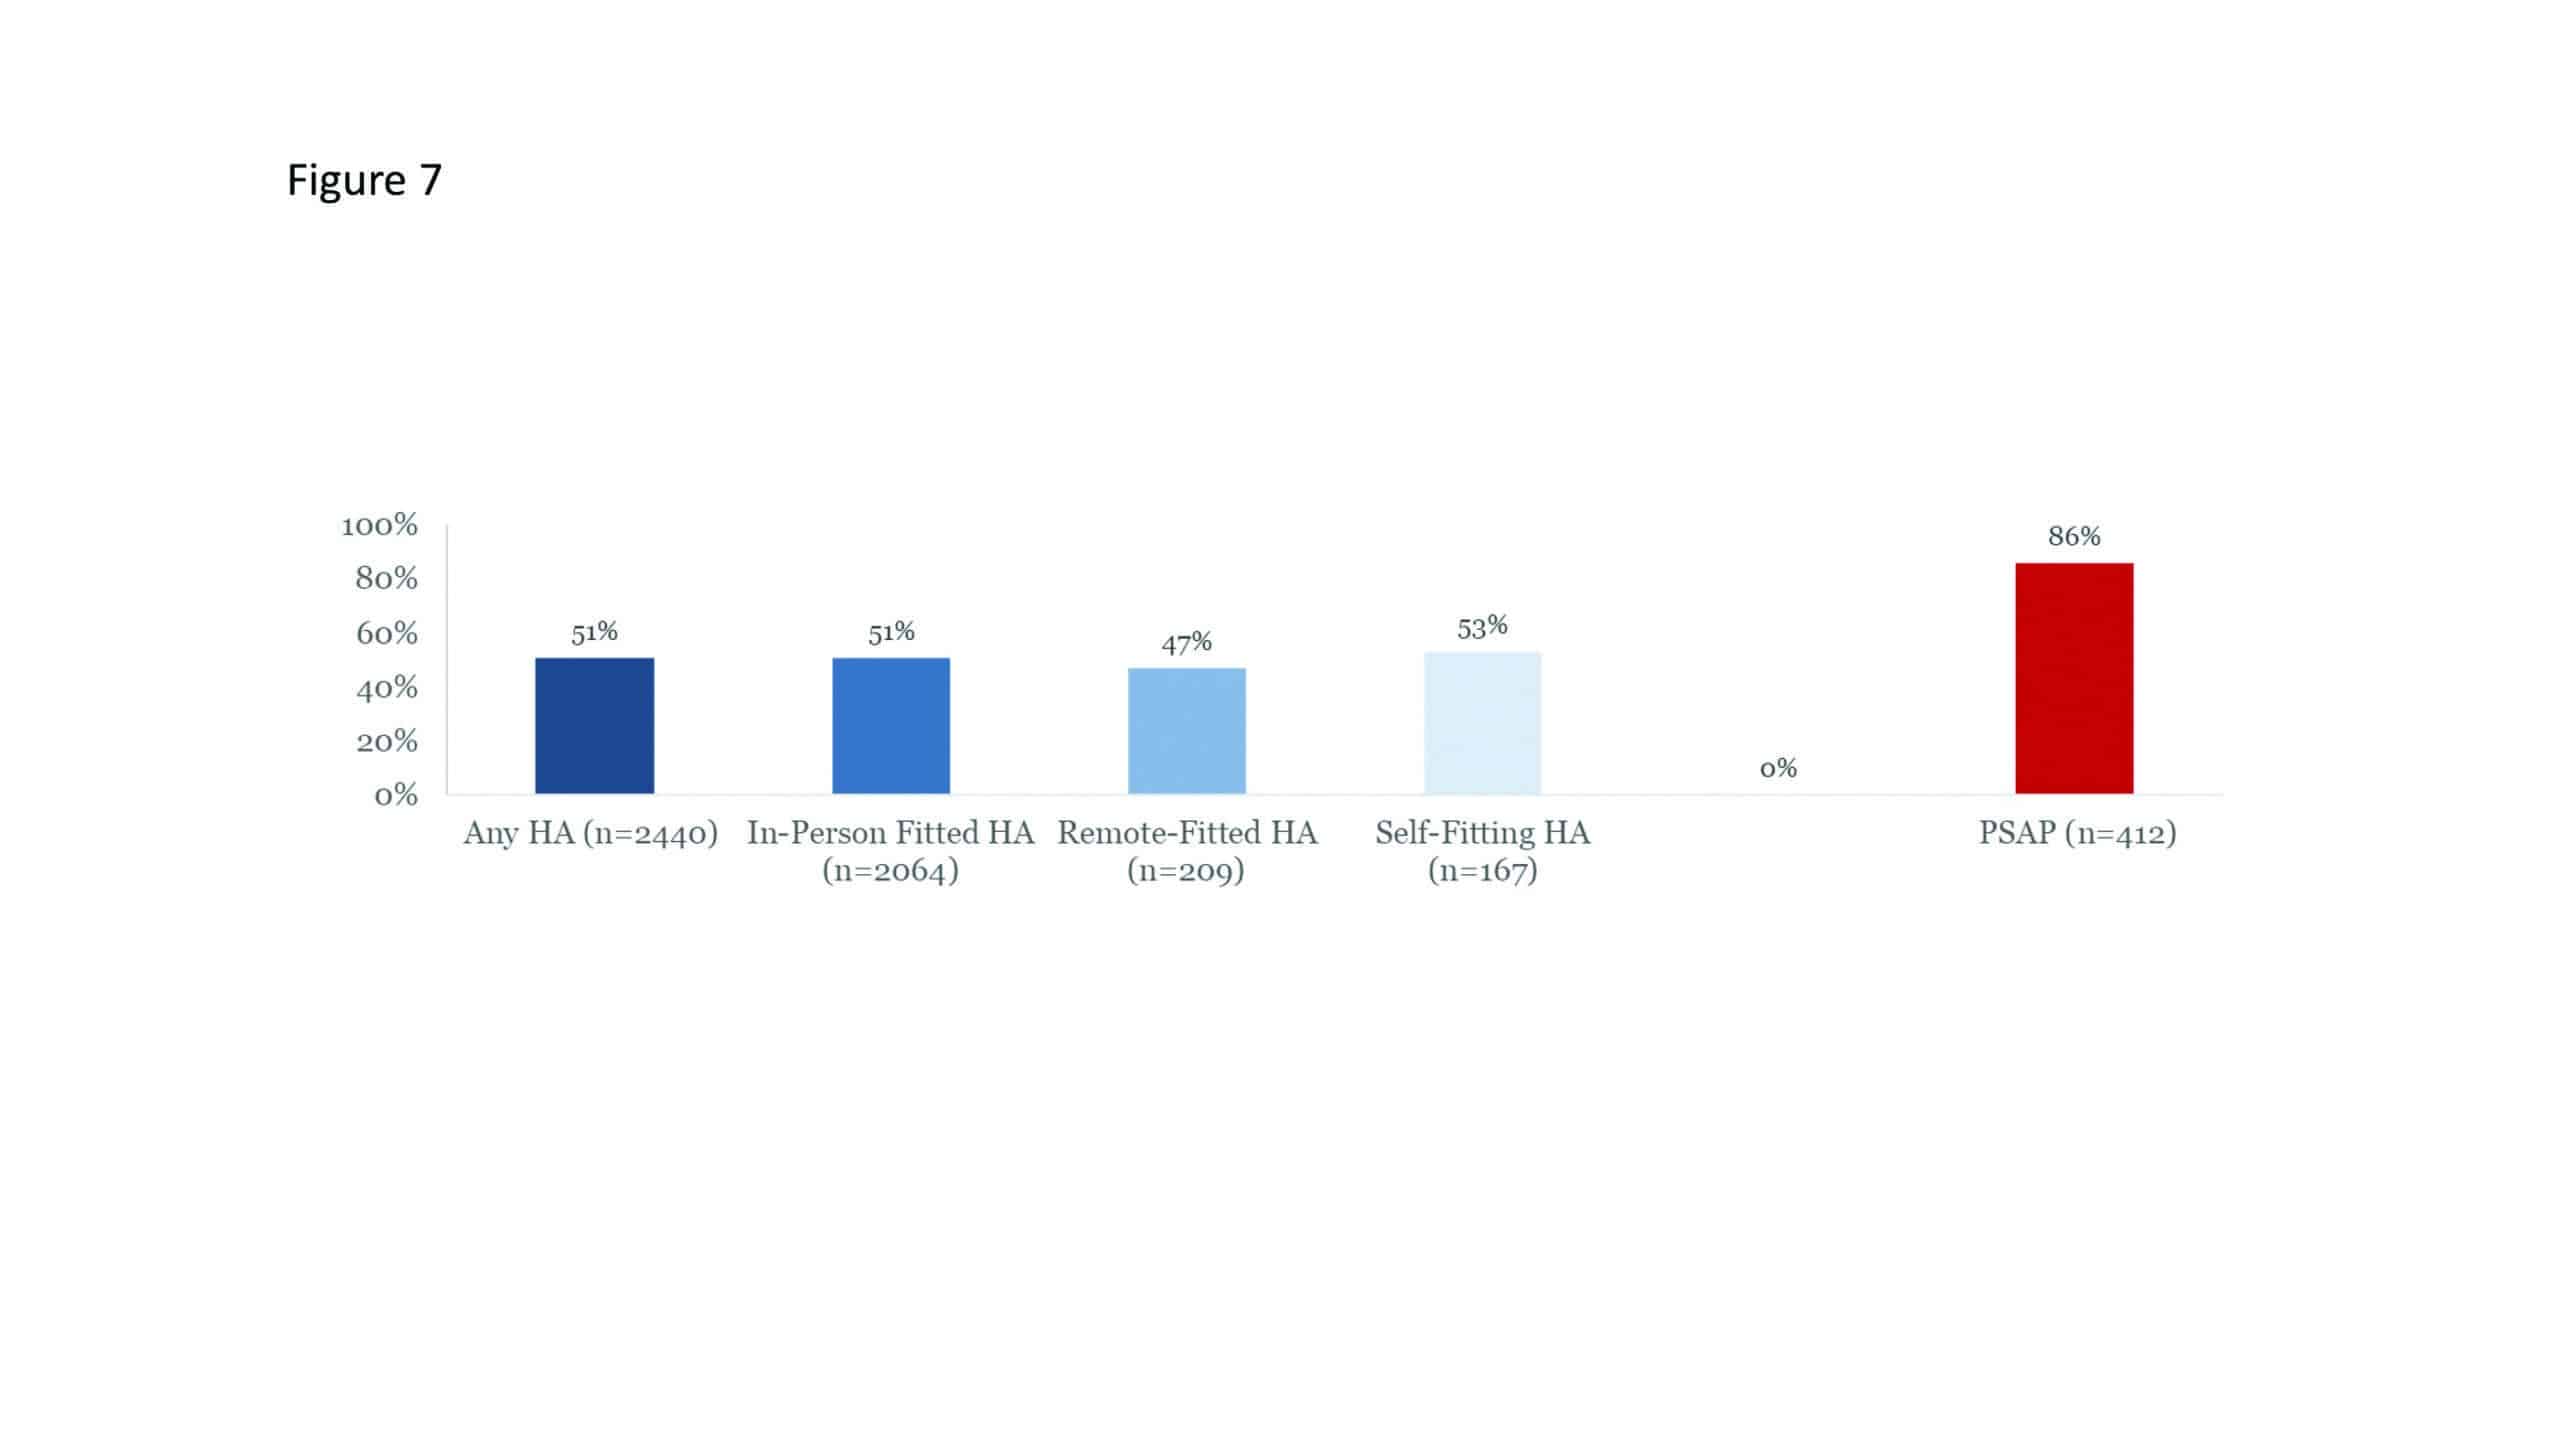
One of the areas of interest in all MarkeTrak surveys is the percentage of first-time buyers. This provides a key indicator of the success of getting new consumers into the market compared to repeat purchasers. These results have fluctuated significantly in past surveys. As can be seen in Figure 7, first-time buyers are relatively consistent across device and channel types at approximately 50%, except for PSAPs. A much higher proportion of PSAP owners—about 6 in 7 (86%)—are first-time buyers. The higher rate may be attributed to individuals early in their identification of their hearing difficulty who are trying self-fitting devices to be used in specific situations, such as background noise. If these devices prove not to provide sufficient benefit, they may move to traditional hearing aids.
Hearing Aid Features
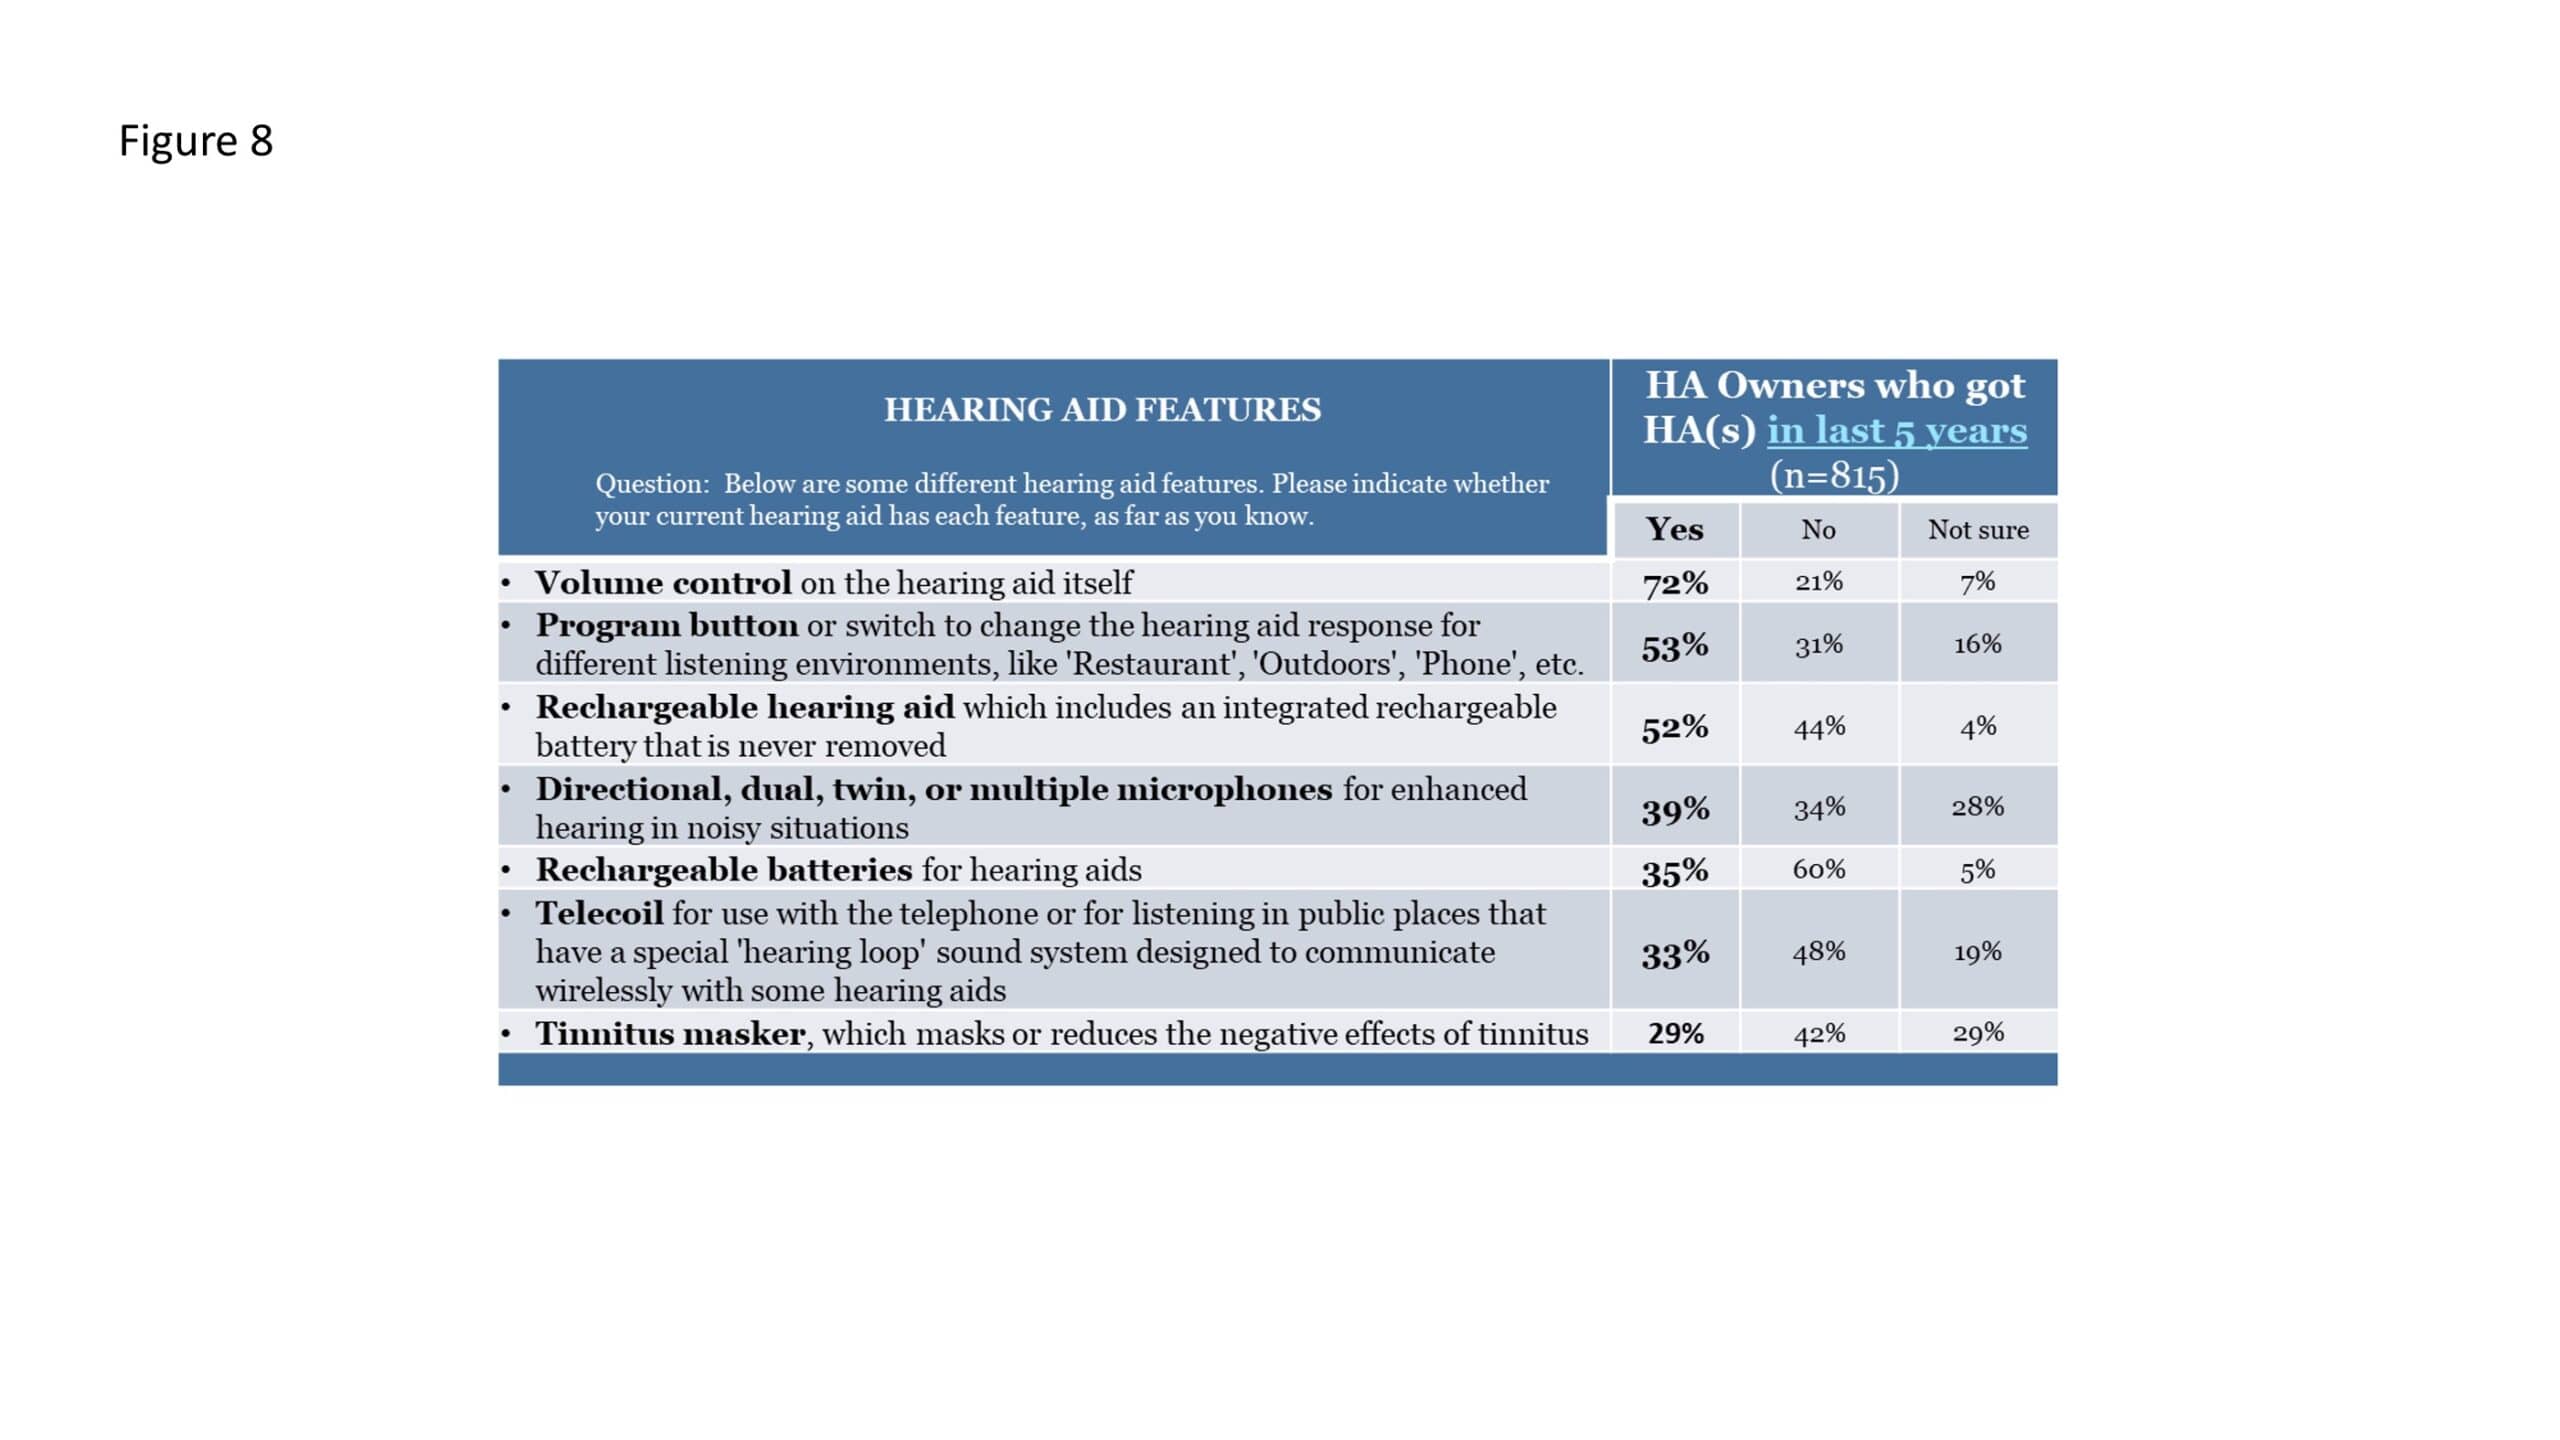
Consumers are adapting to the features available on hearing aids. When owners who purchased hearing aids in the last 5 years were asked to identify different features, volume control was selected by nearly 3 out of 4 persons. A simple majority cited the program button and rechargeable hearing aids. Less than 40% identified directional, dual/twin or multiple microphones, telecoil, or tinnitus masker as included features (Table 1).
A feature that has significantly increased since MT10 is the use and knowledge of wireless capabilities, increasing from 43% in MT9 to 63% in MT2022. In the group of owners that purchased their hearing aids in the last year, 70% have wireless capability in MT2022 compared to 56% in MT10. Most of those with wireless capability use it to adjust the volume. Additional education for consumers about the ability to stream audio or music, or to change programs for different listening environments, would be beneficial.
Another change is the use of downloadable apps, increasing from 21% in MT10 to 44% in MT2022. For those who use an app, 83% are satisfied, with only 3% indicating dissatisfaction. Awareness of this technology remains low with only 3 in 10 (28%) recent buyers knowledgeable about this feature. We did see a significant difference between those fitted in-person having less awareness than those who were fit remotely.
PSAPs
PSAPs were first reported in MT10 and again in MT2022. Most PSAPs are less than 3 years old with very few being older than 5 years. Owners are likely to purchase PSAPs almost equally online (42%) and in a store (40%). PSAP owners are more likely to be situational users, using them for watching TV at home, communication at home, and at restaurants, movies, or work. These environments were also the primary personal drivers for purchasing these devices, as individuals seek technology that could help in these specific situations. The top reported personal motivators of those who own PSAPs reported are being tired of asking family and friends to repeat themselves or tired trying to cope in certain difficult listening situations. Satisfaction rates of current PSAP owners were found to be 66%, which is lower than hearing aid satisfaction (83%).
Implants
All survey respondents in Part 1 were asked about their familiarity with cochlear implants. Only 1 in 10 reported being very familiar, while 4 in 10 never heard of them. This is the first MarkeTrak survey to include data from hearing implant owners to provide a baseline of this segment and a comparison to the larger hearing aid population. While the sample size is small (n=83), it is large enough to provide a stable estimate. Within this group, 30% have a binaural implant only, while 83% report having both an implant and hearing aid. A total of 9 in 10 implant owners reported satisfaction with their device with a majority indicating that the device regularly improves their quality of life.
One interesting comparison between the hearing aid group and the implant group was related to wearing time. It should be noted that MT2022 was fielded during the COVID epidemic so many people were not leaving their home as much as pre-pandemic which may influence the wearing time of both groups. The implant owners report daily use of 51% and weekly use of 27% with the daily average wearing time of about 5.5 hours. Wearing time for the hearing aid group was down slightly from MT10, with 63% reporting daily use and 23% reporting weekly use of their devices in MT2022. The daily average wearing time for hearing aids was 8.3 hours/day, compared to 5.5 hours/day for PSAPs, down from 9.9 and 8.3 hours/day respectively in 2019 (MT10).
NON-OWNERS OF HEARING DEVICES
Primary Reasons for Non-Purchase of Hearing Aids
While we have seen owners embrace hearing technology at a faster pace in MT2022, the rationale of non-owners is little changed. The reasons continue to include that the need is not great enough, the time is not right, financial constraints, and/or a negative experience with a professional.
The leading experiences to motivate an individual are two-fold:
- Having insurance that will cover some or more of the cost; and
- A hearing test that shows the need for a hearing solution.
Yet, even with total coverage, 19% of respondents would definitely not or probably not purchase a hearing aid. Non-owners continue to be impacted by stigma and have an outdated perception of hearing aids.
Hearing Care Professionals (HCP)
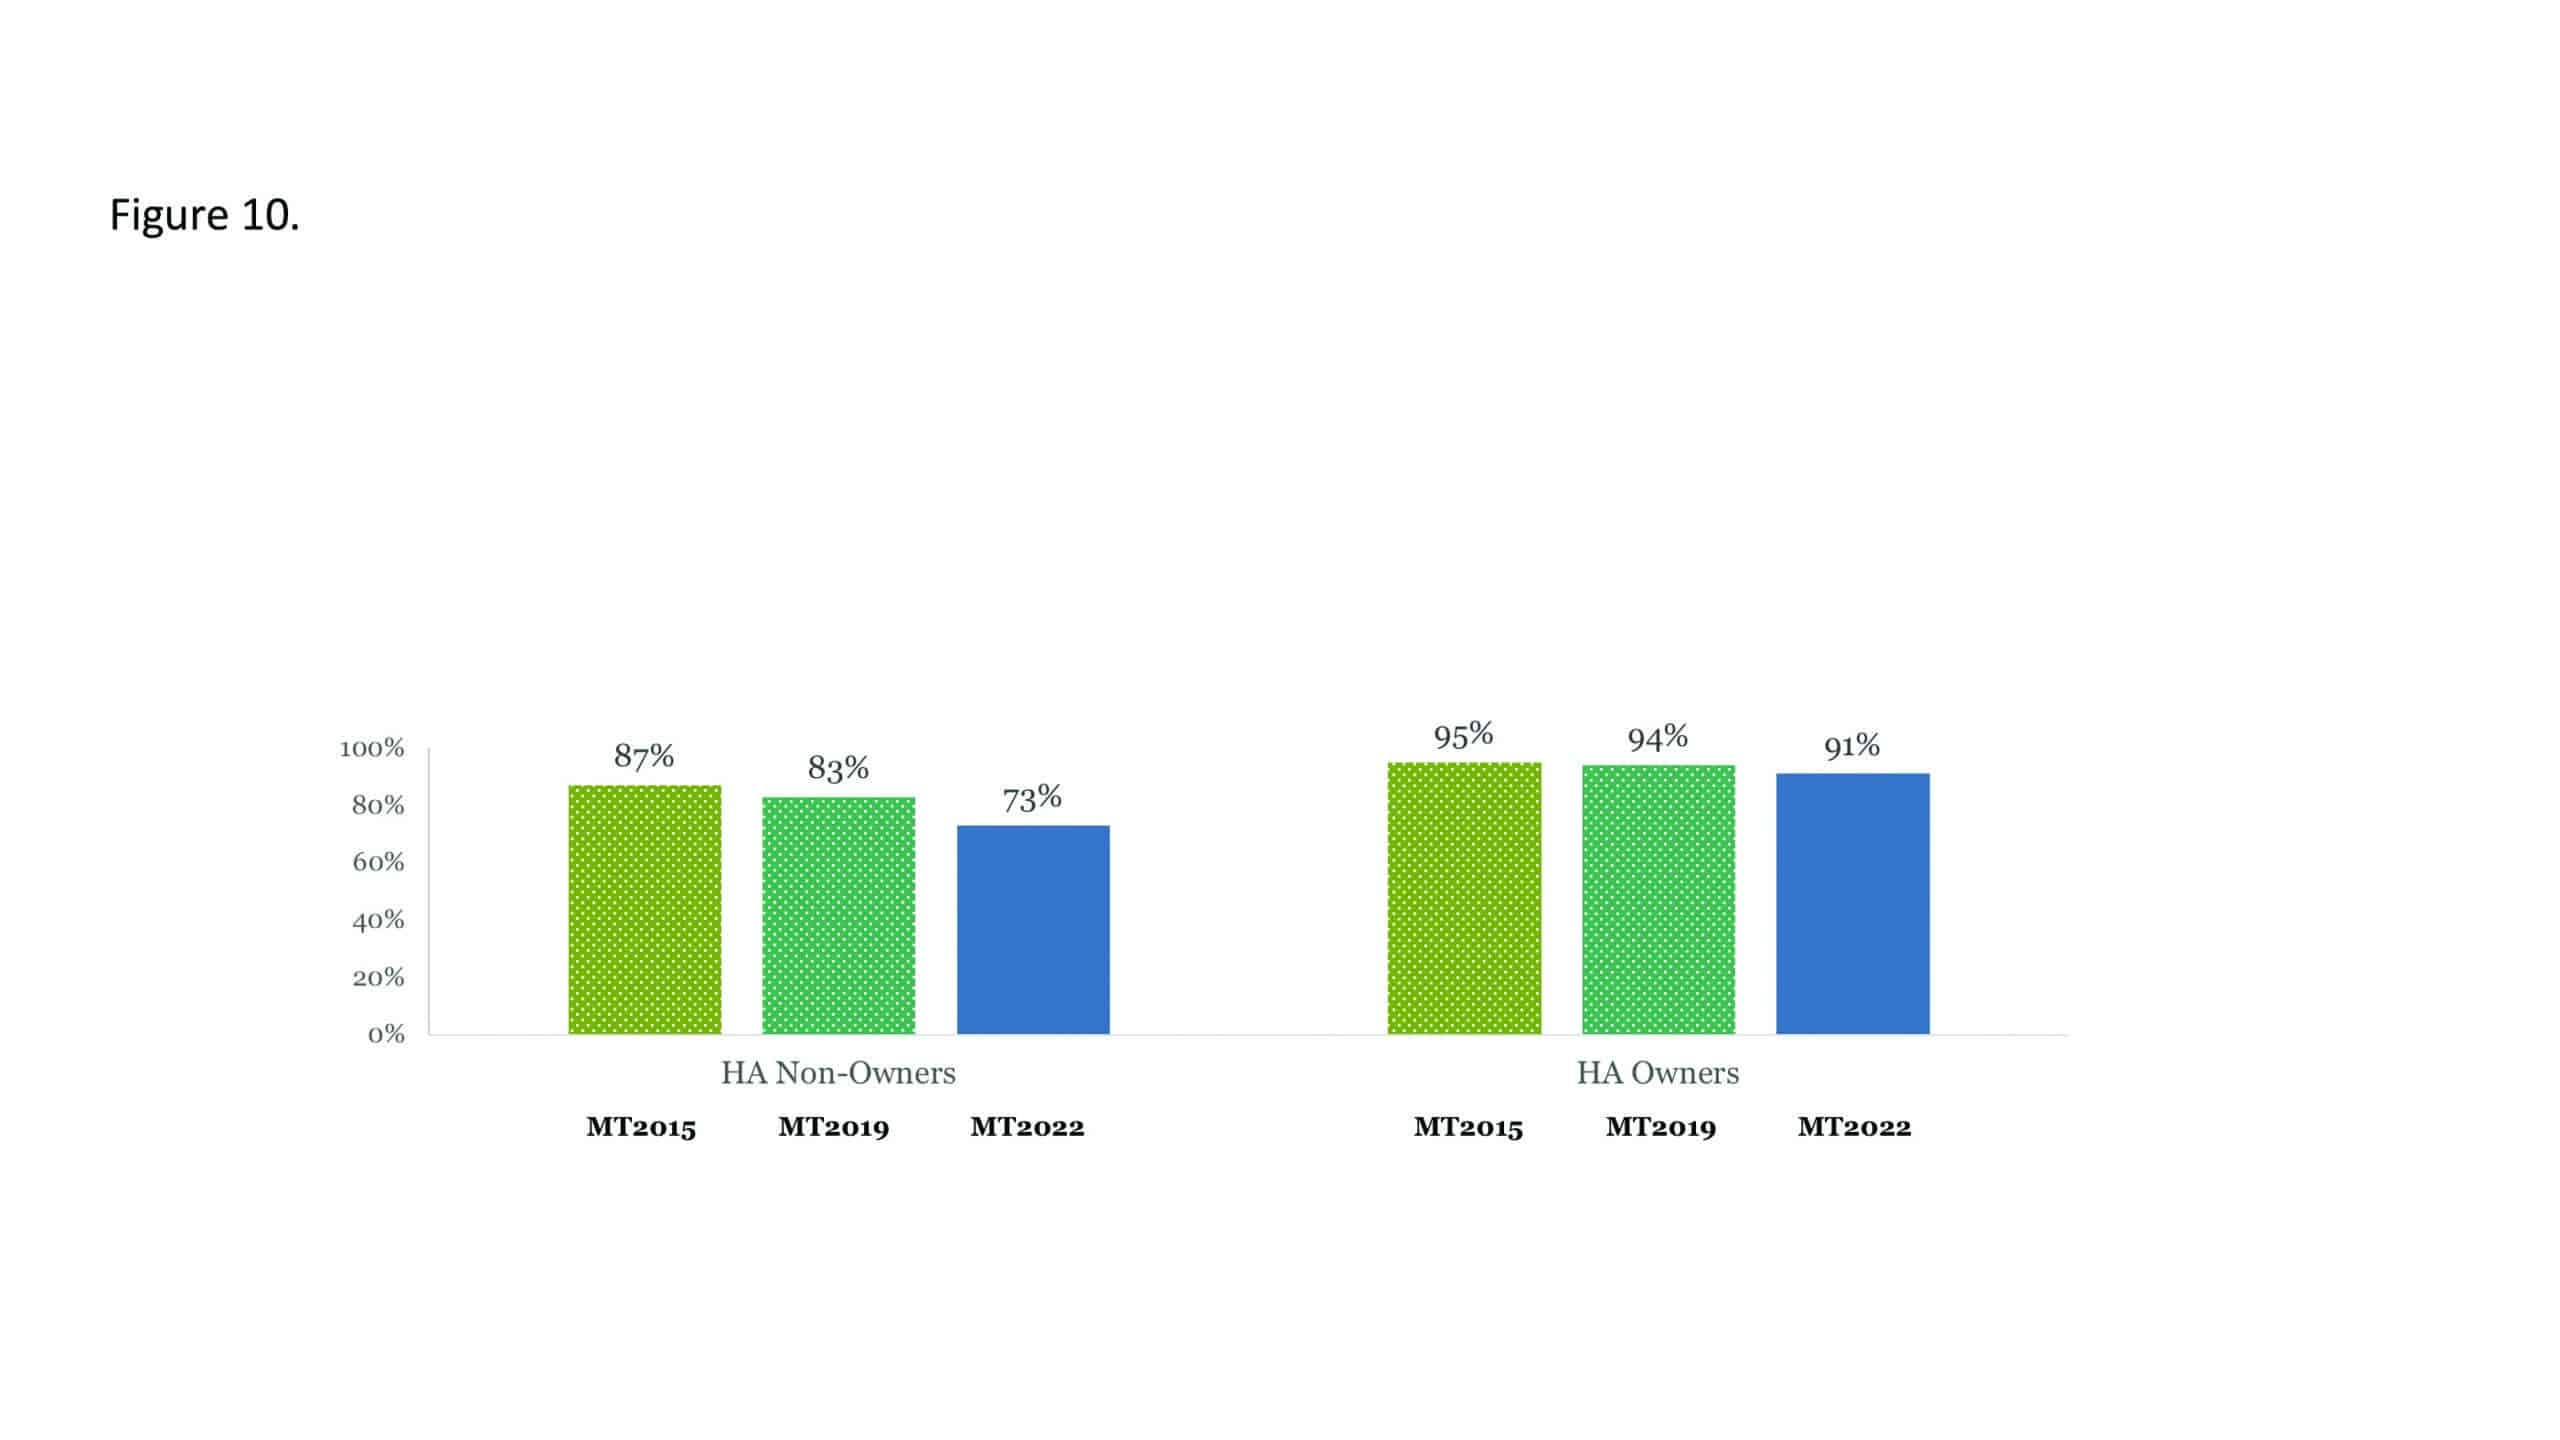
As in past surveys, the majority who engage with an HCP rate the experience positively. The satisfaction rates for owners in MT2022 is 91%, a bit lower than rates in MT9 and MT10, but still remarkably high (Figure 9). The quality of service during the fitting and after the purchase, along with professionalism, efficiency, and the quality of counseling all influence satisfaction rates. Continuing to present realistic expectations while considering the needs and desires of the individual remain key influences. Non-owners rate satisfaction is lower and decreased from 87% in MT9 to 73% in MT2022.
Conclusions
MarkeTrak 2022 contains extensive data, and this introductory article provides insight into some of the study’s notable results. As mentioned in our introduction, adapting to technological, social, and environmental changes will be critical for the survival of the hearing care profession and the hearing aid industry. Consumers are changing their buying decisions, and still far too few understand the availability or features of hearing solutions that can improve their day-to-day life and overall physical and mental well-being.
We believe the data supports the contention that the best solutions for consumers’ hearing difficulties will be found when the consumer initiates their journey with the help of a hearing care professional. Most respondents indicated that they would prefer the assistance of a professional before making a decision.
To build on these results, the Hearing Industries Association will be launching a new campaign in the near future to emphasize and encourage consumers to begin their journey with a hearing care professional and understand the importance of hearing healthcare. We need to build on that sentiment and provide better information about the variety of options available, at a variety of price points, and in a variety of professionally administered delivery models (ie, in-person and telecare) that can meet the needs of most individuals.
With a collective effort, we must focus on improving the satisfaction of hearing care and technology innovation while leading those with hearing difficulty to the right solution that meets their unique needs.
A more detailed look at the MarkeTrak 2022 results will be offered in an upcoming edition of the peer-reviewed journal, Seminars in Hearing.
Acknowledgement
Funding for MarkeTrak 2022 was provided by the Hearing Industries Association (HIA) and its members. The authors want to express their deepest thanks to Jan Kihm, president of AZ Marketing Research, and her colleagues for their work on data collection and analysis of the survey.
MarkeTrak 2022 is the property of the Hearing Industries Association (HIA). No information may be distributed, reproduced, or used without the express prior written permission of HIA.

Correspondence can be addressed to HR or Dr Powers at: [email protected].
Citation for this article: Powers TA, Carr K. MarkeTrak 2022: Navigating the changing landscape of hearing healthcare. Hearing Review. 2022;29(5):12-17.
References
- Kochkin S. Introducing MarkeTrak: A consumer tracking survey of the hearing instrument market. Hear Jour. 1990;43(5):1-8.
- Kochkin S. MarkeTrak VIII: The key influencing factors in hearing aid purchase intent. Hearing Review. 2012;19(3):12-25.
- Abrams HB, Kihm J. An introduction to MarkeTrak IX: A new baseline for the hearing aid market. Hearing Review. 2015;22(6):16.
- Powers TA, Rogin CM. MarkeTrak 10: Hearing aids in an era of disruption and DTC/OTC devices. Hearing Review. 2019;26(8):12-20.
- Bray V. Depression, hearing loss, and treatment with hearing aids. Hearing Review. 2019;26(4)[Suppl].
- Abrams H. Hearing loss and associated comorbidities: What do we know? Hearing Review. 2017;24(12):32-35.
- Beck DL, Harvey M. Issues in cognition, audiology, and amplification. Hearing Review. 2021;28(1):28-33.
- Livingston G, Huntley J, Sommerlad A, et al. Dementia prevention, intervention, and care: 2020 report of the Lancet Commission. Lancet. 2020; 396(10248):413-446.