Research | December 2017 Hearing Review
What is a realistic SNR and how should we test and assess features such as noise reduction algorithms? This article presents two studies that emphasize the importance of auditory reality on the design, fitting, and evaluation of hearing aids—with the hope of moving towards a firm grip on auditory reality.
Researchers at Widex have for some time strived to increase our understanding of people’s auditory reality. For the term “auditory reality,” we use the following definition, inspired by Noble1:
“Auditory Reality is the variety of acoustic environments experienced by an individual.”
The word “experienced” implies that hearing loss and hearing aids are influencing a person’s auditory reality. Auditory reality can therefore be highly individual. It is our firm belief that increased knowledge about people’s auditory reality will be beneficial when designing, fitting, and evaluating hearing devices—and crucial to our understanding of audiology in general.
This article uses one example of a hearing device feature—noise reduction (NR)—to show how knowledge about auditory reality can help in the design and evaluation of the feature. In particular, it reviews two studies performed at the Widex research laboratory, ORCA Europe. In the first study, the focus was on acoustical properties of auditory reality, and the goal was to learn more about real-life signal-to-noise ratios (SNRs).2 In the second study, the focus was on understanding some non-auditory aspects of auditory reality, with the goal of creating a framework of common sound scenarios (CoSS).3 These studies have proved to be important for hearing device design and evaluation—and, indeed, they are part of our attempt to get a firm grip on auditory reality!
Noise Reduction in Hearing Aids
Almost 10 years ago, researchers at ORCA Europe investigated ways to illustrate how NR algorithms in hearing aids function.4 Hearing aids from major manufacturers were included in the study. It was striking how differently the tested NR algorithms functioned. For example, there was a large difference between hearing aids with respect to how the gain reduction depended on the SNR of the input signal. As a consequence, these systems would affect people’s auditory reality in very different ways.
The long-term average gain reductions for three of the tested hearing aids are shown in Figure 1. Hearing aid F (HA F in the figure) reduced the gain only for negative input SNRs, and slightly more in the low frequencies than in the high. Hearing aid G (HA G) did not reduce the gain much, but the small gain reduction (around 2 dB) was present already at positive SNRs. Hearing aid I (HA I) reduced the gain substantially, predominantly for low frequencies, and the gain reduction was large (6-8 dB in the low-frequency range) for an SNR of +6 dB (the highest SNR tested).
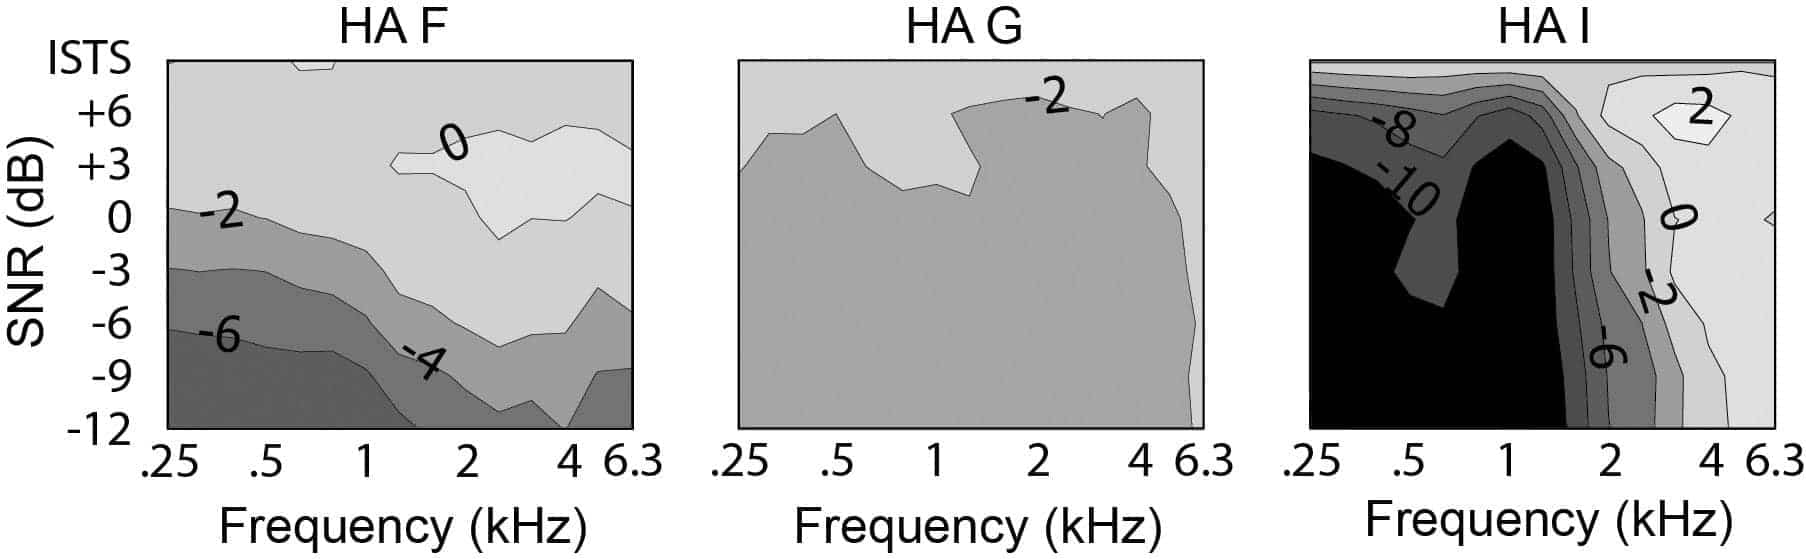
Figure 1. Gain reduction contours for three hearing aids programmed for a mild-moderate, sloping, sensorineural hearing loss, and measured using a speech signal at 75 dB SPL mixed with stationary speech-shaped noise at various levels to create the SNRs indicated on the vertical axis. Measurements were made with the NR algorithms turned on and off and the difference was calculated. In the gain reduction contour plots, darker color indicates a larger gain reduction. Figure taken from Smeds et al4 and used with permission from the Journal of the American Academy of Audiology.
The differences found could be the result of different underlying rationales for using noise reduction. They probably also reflect how the noise reduction systems interplay with the prescribed hearing aid gain and other features that vary among manufacturers. However, the results also indicate that manufacturers might not agree on which SNRs people are experiencing in their everyday life when they come across difficult noisy listening situations.
Realistic SNRs
From consumer surveys, such as the MarkeTrak study,5 we have learned that hearing aid wearers describe hearing in the presence of background noise as the most difficult listening situation. What are the SNRs in the situations described? A literature search provided two studies in which realistic SNRs were investigated.6,7
In the most well-known and cited study, Pearsons et al6 in 1977 collected a large amount of data on background noise and speech levels in various real-world settings. The main results were summarized in a subsequent paper by Wayne Olsen.8 Speech and noise levels were recorded in schools, homes, hospitals, department stores, trains, and airplanes. The samplings of situations were not necessarily done based on situations people often encounter; instead, the purpose of the study was to ensure adequate speech communication in several preset listening situations. The speaking distance was fixed at 1 m, or the speech levels were re-calculated to correspond to a speaking distance of 1 m.
In the second study, Harry Teder7 measured speech and noise levels using a sound-level meter held in front of his chest. He used natural speaking distances. Several environments were visited, but it was not described how these environments were selected. Teder’s data pointed towards higher SNRs than previously reported by Pearsons et al,? perhaps because of the natural speaking distances. In difficult situations people tend to decrease the speaking distance to increase the SNR.
Recordings
We decided to further investigate realistic SNRs and designed a study where we analyzed recordings made in a previous 2008 study by Wagener et al.9 In that study, 20 bilaterally fitted hearing aid wearers participated. They were all satisfied with their current hearing aids. The participants ranged in age from 18 to 81 years, and they had various occupations and varying hearing loss configurations.
The study participants were equipped with portable audio recorders and omnidirectional microphones mounted on a headband so that the microphones were close to their hearing aid microphones. They were asked to record “different situations from your daily life for 5-10 minutes each” for 3-4 days, and they were told that all situations were of equal importance. The researchers then trimmed each recording to a representative 60-second sample.
After the recording period, the study subjects participated in a laboratory test where they listened to their own trimmed recordings. They were asked if they recognized the recorded material and if they could describe the situation. They also received questions about how often they were in this situation, how important they judged the situation to be, if the situation was problematic, and how the hearing aids worked in the situation.9 This evaluation showed that the participants had recorded relevant listening situations from their everyday life. Further, the evaluations showed that the recorded listening situations differed in how problematic they were perceived to be.
SNR Estimation
In our subsequent analysis,2 SNRs were extracted from the trimmed recordings of Wagener et al.9 Only situations with live speech directed to the participant were analyzed, and the participants’ own voice was excluded from the analysis.
To calculate an SNR, the power of the speech signal and the power of the noise signal are needed. Under the assumption that the characteristics of the noise are constant (within some statistical variation), the noise power was estimated from “noisy-only” segments in the recordings, typically in speech pauses. Under the assumption that the speech and noise signals are uncorrelated, the speech power was then estimated by subtracting the estimated noise power from the power of the noisy speech signal (further details of the analysis are found in the paper by Smeds et al2). Both frequency-specific SNRs and overall SNRs, calculated based on un-weighted and A-weighted speech and noise levels, were determined.
The recordings were then grouped based on their background noise characteristics. The key result is presented in Figure 2, where the SNRs (for the ear with the higher/better SNR) calculated based on A-weighted long-term RMS levels for speech and noise are presented. The median SNR for the “quiet” situation was 22 dB. For the noisy situations, the median SNRs were fairly similar, ranging from 4.6 dB (for speech in babble) to 7.6 dB (for speech in radio or TV background noise). It was noticeable that there were very few recordings with negative SNRs.
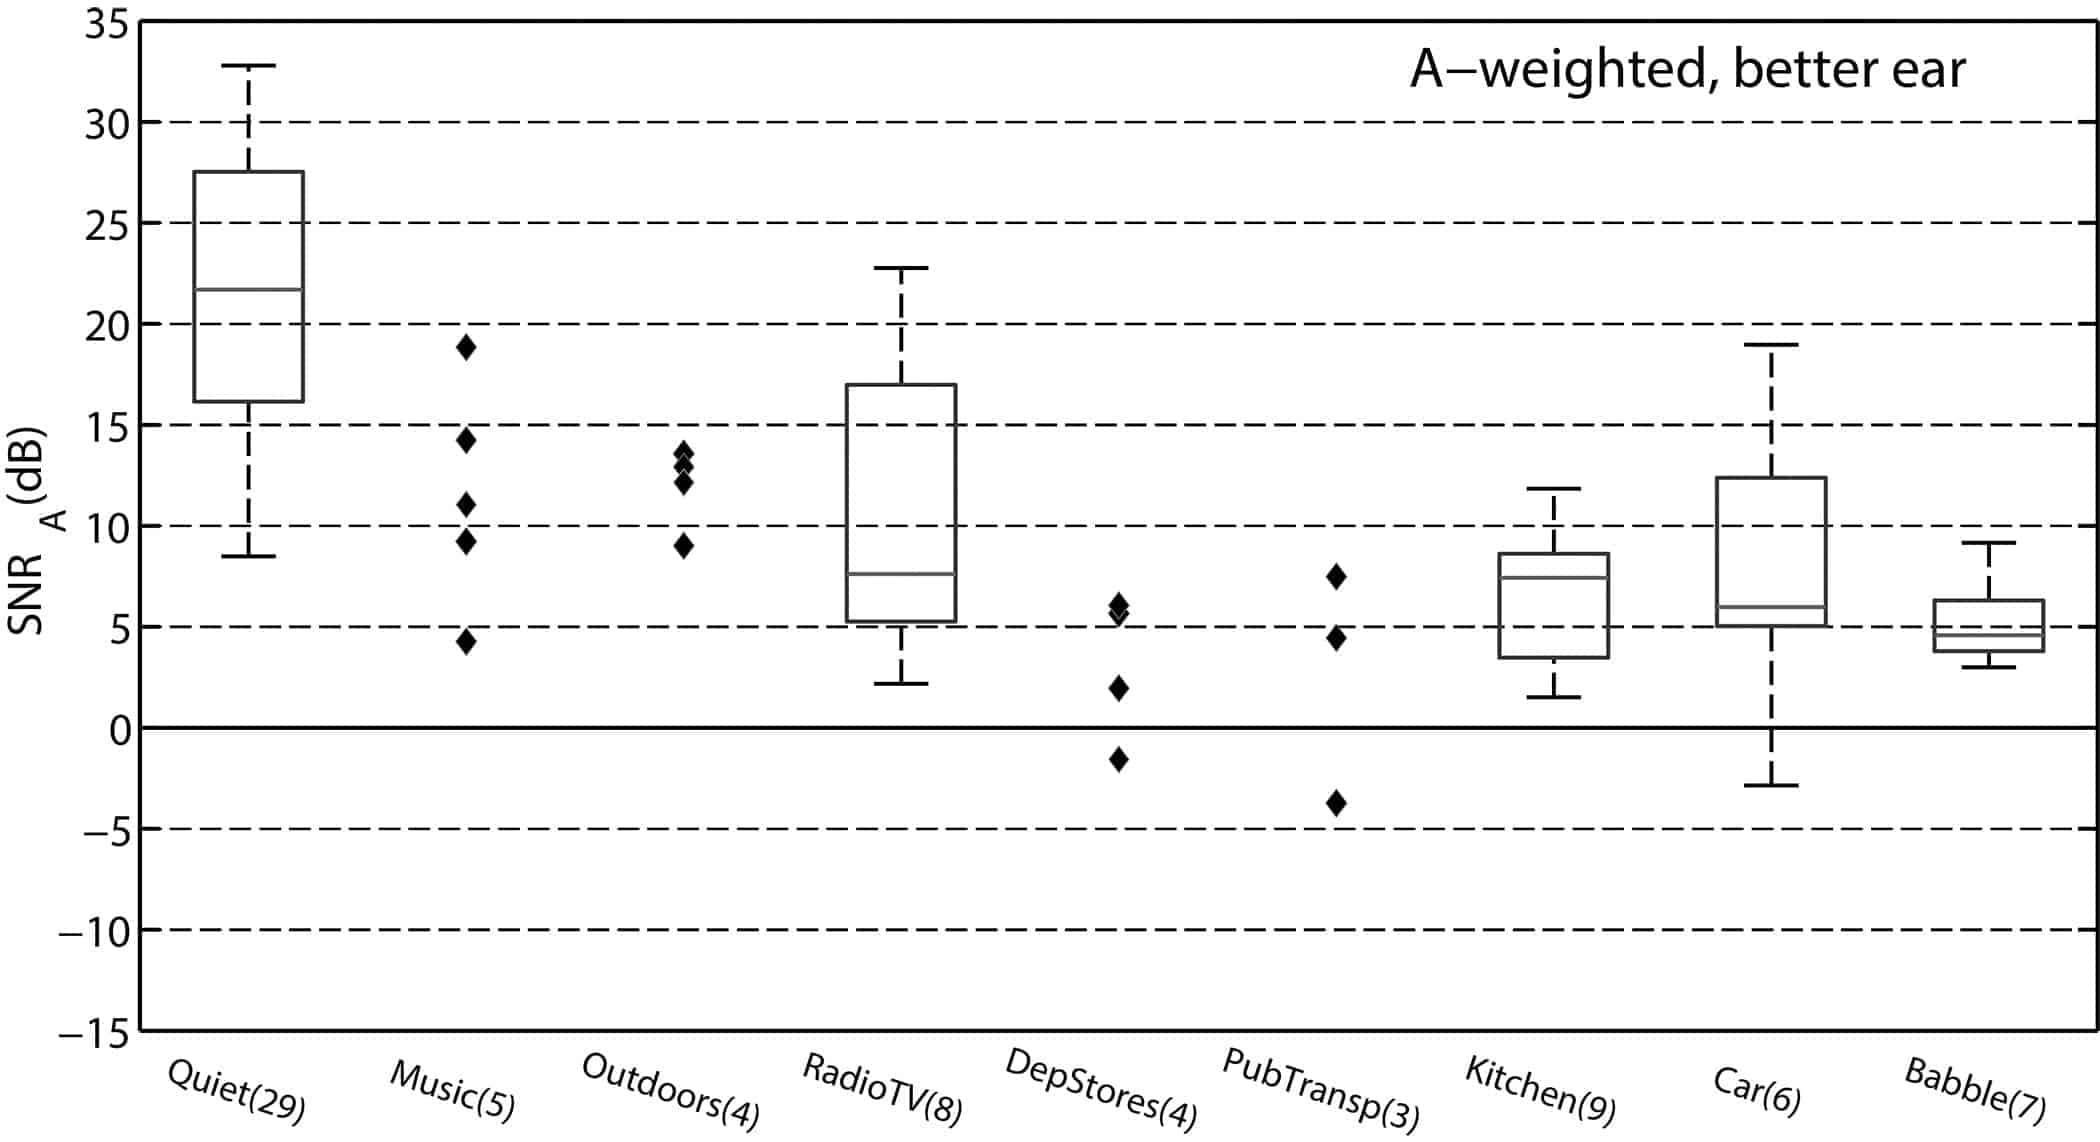
Figure 2. SNRs (calculated based on A-weighted speech and noise levels) for various background noise types (indicated on the horizontal axis). For noise categories with five recordings or less, the actual estimated SNRs are presented, whereas box plots are used for the noise categories with more than five recordings. The central mark in each box shows the median SNR across recordings, the box indicates the interquartile range, and the whiskers extend to the most extreme data points. The number in brackets after the noise category name gives the number of recordings in that category. Figure taken from Smeds et al2 and used with permission from the Journal of the American Academy of Audiology.
Despite the similarities in overall SNRs among the noisy situations, the informants described them as varying in how problematic they were perceived to be. One reason for these differences in difficulty could be that the frequency-specific SNRs were quite different across the different background-noise types. For speech in babble noise, the median SNRs were almost constant (around 4-8 dB) from 250 to 8000 Hz, because the noise had roughly the same spectrum as the speech. For car noise situations, on the other hand, the noise was low-frequency dominated. This led to low SNRs at low frequencies, but the SNRs for important speech sounds (in the 1-4 kHz range) were generally above 10 dB.
The opposite was true for the kitchen noises. Recordings within this category included, for example, noise from running water, frying food, and blenders. This noise category differed from the others in that the median SNRs in the frequency range important for speech was very low (around 0 dB above 1 kHz).2 The situations in the kitchen category also showed non-acoustical similarities. The speaker was often standing on one side of the listener (probably indicating that the listener was occupied with something which made it difficult to turn the head to face the talker) or the speaker was moving, two situations indicating listening with limited visual cues.
It became obvious that acoustical parameters, such as sound pressure levels and SNRs, are only giving some indications to how people experience different listening situations. In the next study, we decided to explore additional information (other than acoustical) needed to characterize listening situations.
Common Sound Scenarios (CoSS)
A literature study was performed in November 2013 using search terms such as “acoustic environment,” “listening situation,” and “everyday listening.” From the publications found, only 10 studies from the audiological literature (7 peer-reviewed) presented data on everyday listening situations or acoustic environments that were reported by study participants and could be used for data extraction. A list of the publications can be found in the original paper.3
The 10 papers all came from the audiological literature. For some of the studies, the main goal was to investigate listening situations. Others aimed at evaluating something else, like benefit of hearing aid features, but had an additional focus on listening situations.
The methods used to collect data differed. Several studies used questionnaires or Ecological Momentary Assessment (EMA). EMA is a technique which involves repeated assessments in the participant’s real life. This could either be done using pen and paper or a smartphone application which can include prompting and conditional questionnaires.10 Two studies used a dosimeter to collect statistical information about the acoustics in the listening situations, and two studies made actual sound recordings. Only one study included normal-hearing participants.
From these 10 studies, every listening situation (187 total situations) was extracted and saved in a matrix (see Wolters et al3 for details). In addition to a descriptive name, all available information about the listening situation was listed. This could include information about how often the situation occurred, how important it was judged to hear well in the situation, how difficult the situation was, and the listening effort needed in the situation.
The subsequent categorization of the listening situations was inspired by a standard on soundscapes (ISO-12913-1),11 available as a draft at the time of the study. Soundscape research focuses on the effects of the acoustic environment on people’s perception and behavior. A soundscape study normally includes an analysis of a particular acoustic environment, and can include suggestions for improvements of that environment. It is an interdisciplinary area that can involve collaboration between acousticians, architects, psychologists, and designers.
The soundscape standard11 describes the elements of an experienced environment in a framework where context plays an important role. According to the standard, context is defined as “the interrelationships between person and activity and place, in space and time.” Context is broadly defined in the standard, but two aspects of context were important for the current work:
1) The intention a person has in a given situation, and
2) The task(s) that the person is solving.
In practice, the CoSS categorization was performed in the following way: All 187 extracted listening situations were printed on separate pieces of paper. For the first selected situation, a descriptive intention category was determined, for example, “speech communication.” If the next situation fitted into the same intention category, the two situations were grouped together. If not, a new intention category was formed, for example “focused listening.” This was done until all situations were placed in an intention category.
Then, all situations within one intention category were further explored. It became clear that the tasks performed in one intention category could vary. For example, “speech communication” with one other person was considered quite different from talking in a group or over the telephone. The grouping strategy described above was then repeated, this time with the aim of creating task categories within the intention categories. This categorization procedure led to a tree structure with three main intention categories and seven task subcategories.
The tree structure was further developed by adding two sound scenarios to each task category—usually one taking place in quiet and one in a noisier background. The selection of these scenarios was data driven and was primarily based on the reported frequency of occurrence of the extracted listening situations. The other selection criteria were “importance” and “difficulty to hear.” The selection of scenarios would have been different if importance or difficulty had been the primary factor for selection. The resulting framework of Common Sound Scenarios (CoSS) is presented in Figure 3.
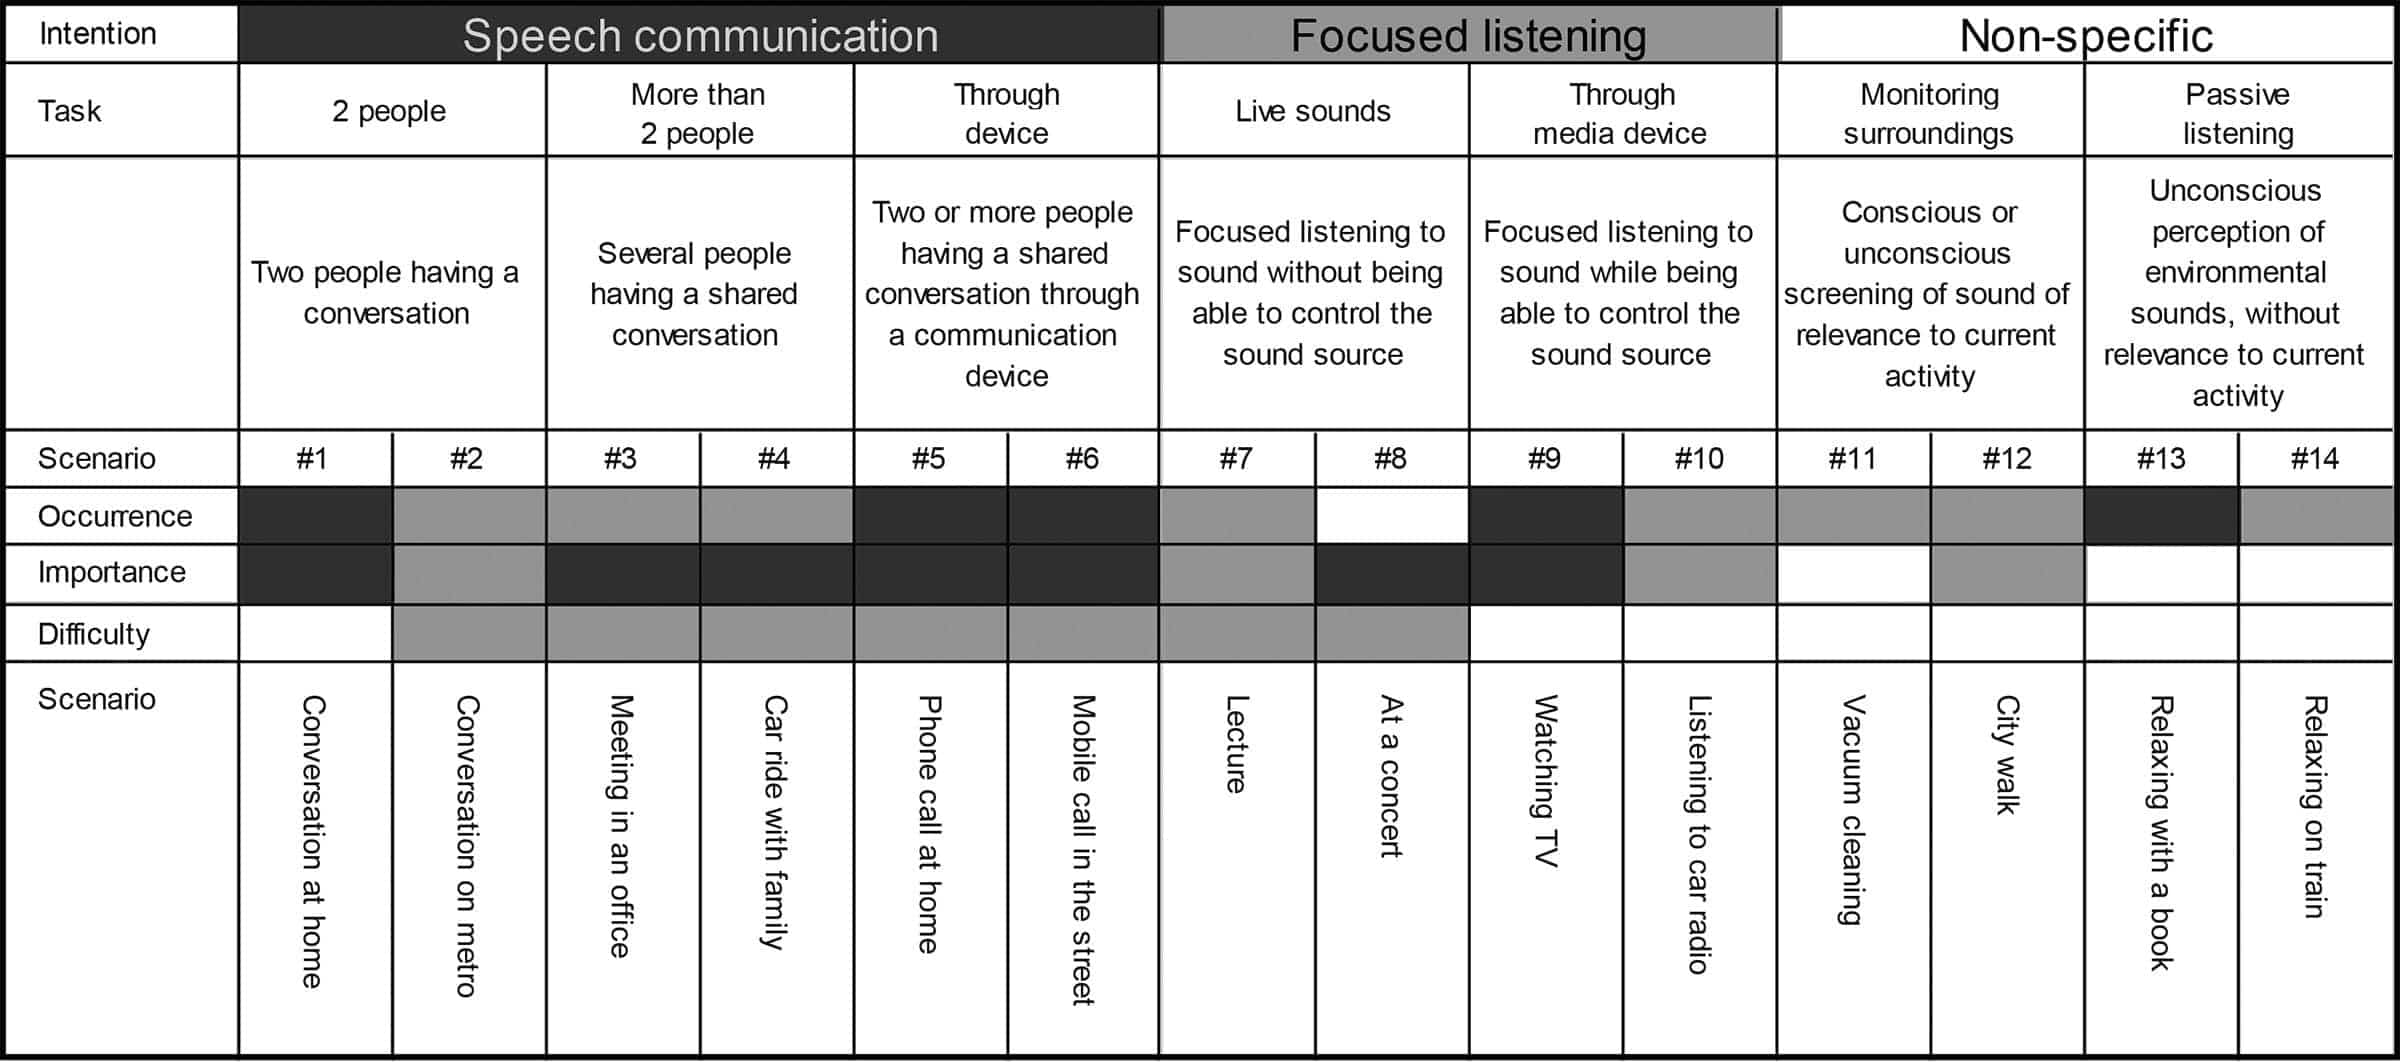
Figure 3. The CoSS framework. The framework is divided into intention categories, task categories, and sound scenarios. For each scenario, an indicator of the scenario’s occurrence, importance, and difficulty is provided. Darker shades represent higher values and lighter shades represent lower values. Figure from Wolters et al3 and used with permission from the Journal of the American Academy of Audiology.
Discussion
We have described two studies that focus on the everyday listening situations experienced by people with impaired hearing.
The study on realistic SNRs showed that most communication took place in positive SNRs. The median SNR for speech in babble (the noise background associated with the lowest A-weighted SNR) was 4.6 dB. The SNRs found were generally higher than the SNRs determined by Pearsons et al6 and closer to the SNRs reported by Teder.7
It could be argued that the SNRs calculated based on recordings made by informants with impaired hearing could differ from data recorded by normal-hearing informants. Perhaps the informants with hearing impairment had adjusted their lifestyle so that they avoided very noisy situations. People talking to these informants might also have raised their voice, thereby creating a higher SNR. The recoding time was also short (3-4 days) and difficult situations (presumably with low SNRs) might not occur often enough to be captured by the recordings used for the current analysis.
Even if the median SNRs did not vary a lot across situations described as “noisy,” the difficulty to hear in the situations varied, and the CoSS framework presents an attempt to categorize listening situations according to parameters other than acoustical. In the CoSS framework, intentions and tasks are the building blocks and 14 common sound scenarios were selected, primarily based on high occurrence in everyday life.
Someone might wonder why the commonly described “cocktail party situation” is not included in the list of common sound scenarios. First, the 14 common sound scenarios should only be considered examples. It is, of course, possible to use a cocktail party situation as an alternative scenario #4 (several people having a shared conversation in a noisy background). Second, the reason why the scenario is not included in the framework is that the selection of example scenarios was based on occurrence as the primary selection factor, and the cocktail party situation did not occur often in the data set.
We were surprised that there were so few studies that could be used for data extraction for the CoSS framework. All studies were from the audiological research field, and only one presented data from normal-hearing participants. All studies were performed in Western Europe or North America. However, we think that the strong focus on context makes the framework useful despite these limitations in the data set. With the advancements in the EMA technique, we also expect to see many more studies investigating real-life listening situations in the future.
In connection to the CoSS study, it could be argued that we are no longer only describing people’s auditory reality. Instead, the framework’s use of factors like intention, task, and importance resembles the definition of “Auditory Ecology,” which describes the relationship between the acoustical environments experienced in everyday life and the perceptual demands of different people in these environments.12 Thus, while auditory ecology focuses on the interaction between listener, listening demands, and listening environments, auditory reality is, as Noble states, “just whatever occurs in the life of any person…”1 However, there is a substantial overlap between the two terms, and in many contexts the differences are so subtle that the terms may be used interchangeably. Our main reason for using the term auditory reality in this paper is that the term is intuitively easy to understand.
Importance of the Results
The two studies described above have increased our knowledge about the auditory reality of people with impaired hearing. Why is this important? We will present two example areas.
1) Design and fitting of hearing device features. To develop better hearing devices, we need a thorough understanding of people’s auditory reality. The CoSS framework clearly illustrates that speech communication is not the only listening situation of interest. Even if communication is important and sometimes difficult, other situations might be more common and a hearing device needs to function in many listening situations.
Auditory reality also varies among people and over time. Using modern technology, a person’s auditory reality can be mapped out, and hearing device signal processing can be tailored to that person’s particular auditory reality. This may be done by a hearing care professional during fitting and fine-tuning of the device. Furthermore, options are available that allow the wearer to optimize the device for his/her auditory reality (eg, via a smartphone app).
Knowledge about realistic SNRs is also important when designing hearing device features. If a noise-reduction algorithm should function in commonly experienced noisy situations, the results of the SNR study indicate that it should make a difference also at positive SNRs.
2) Evaluation of hearing device features. When evaluating hearing device features, the knowledge gained in the two studies is also important. If the noise reduction algorithms in Figure 1 are to be evaluated, which scenario, which background noise type, and which SNR should be used?
Adaptive speech tests are often used. In this type of test, either the speech level or the noise level is kept constant. The SNR is then varied by changing the other entity to reach a predefined criterion, such as 50% correct responses. This means that all participants in a test are performing at the same level of difficulty, but at varying SNRs.
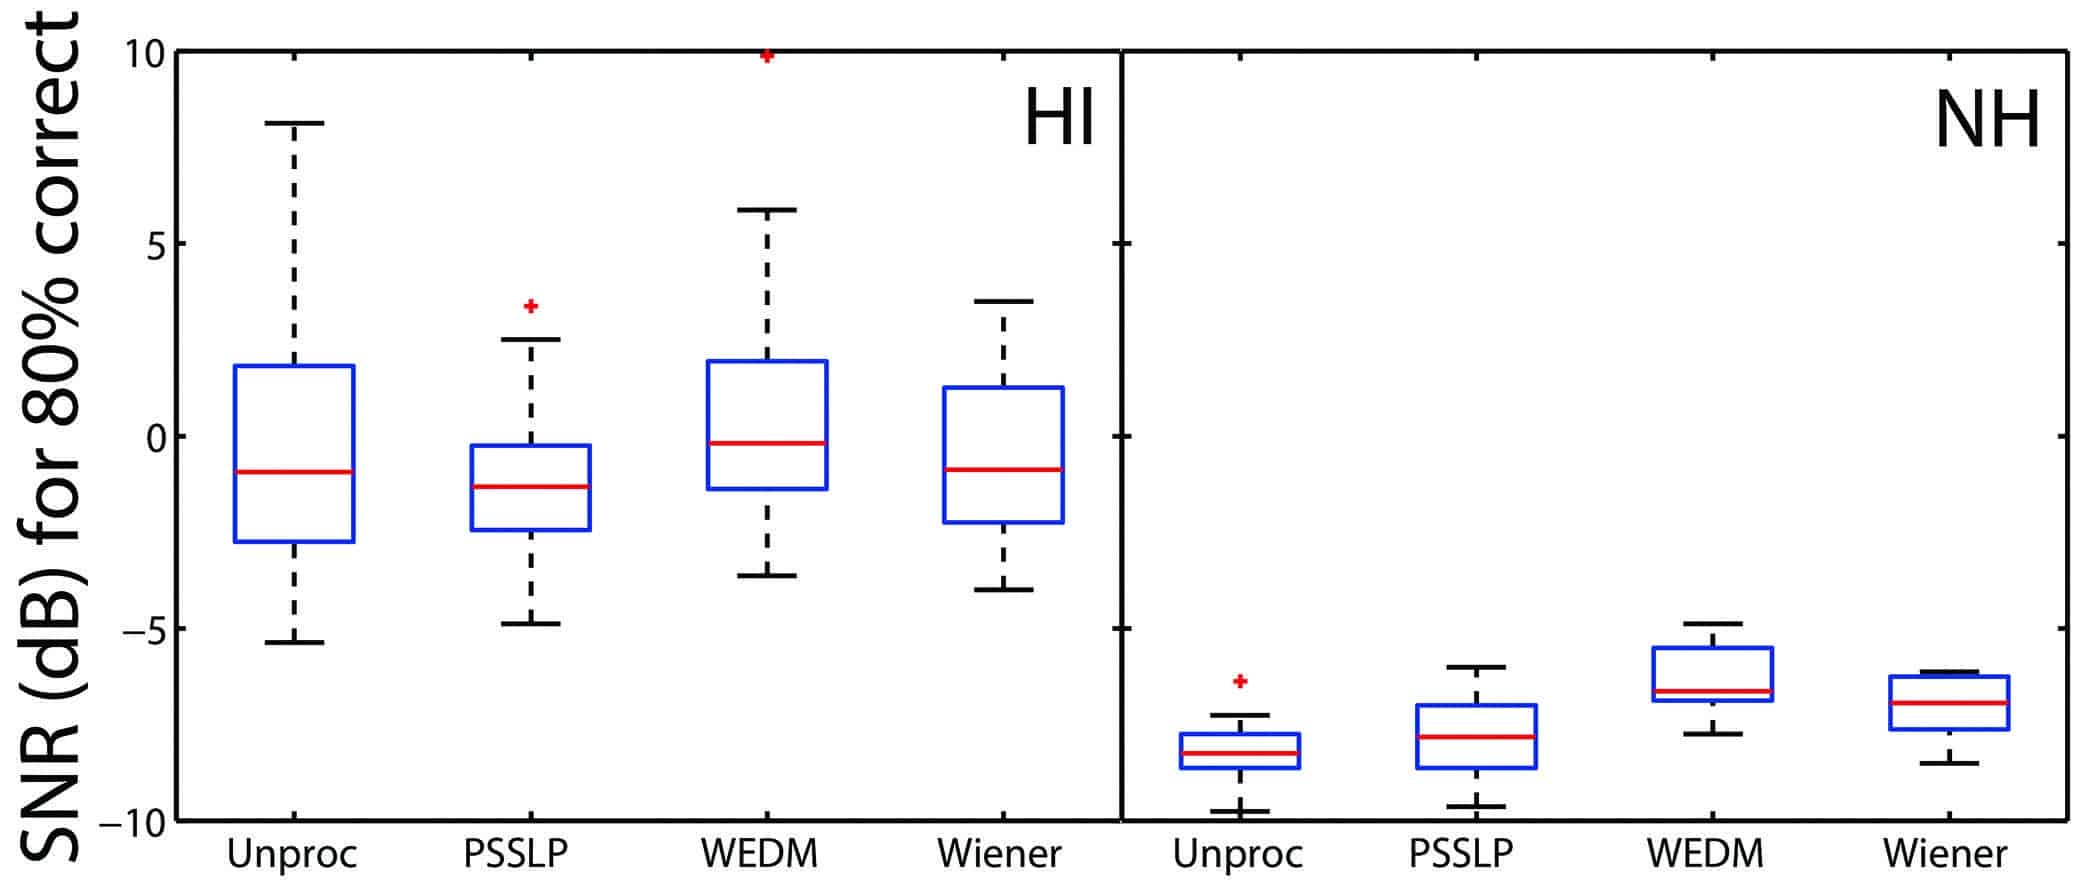
Figure 4. Results of an adaptive speech test. The SNRs at which the participants performed at 80% correct are presented. Each participant contributed with one SNR value and the boxplots show the distribution of results. Figure from Smeds et al13 and used with permission from the Journal of the Acoustical Society of America.
As an example, Figure 4 shows the results of an adaptive sentence test. One unprocessed condition and three conditions where speech in noise was processed using three NR algorithms were compared.13 The box plots illustrate the results from 20 participants with impaired hearing (left panel) and 10 participants with normal hearing (right panel). The evaluations have been performed at very different SNRs, and the median SNRs are all lower than the realistic SNRs derived in the study presented above. Without a careful analysis of how the various NR algorithms work as a function of SNR, it is difficult to interpret the data, since the NR algorithms could function in very different ways at, say +5 and -10 dB.14
There is a need for evaluation methods that can be performed at realistic SNRs. The problem with using many of the currently available speech tests is that the performance at positive SNRs is close to 100%, which makes it impossible to study the effect of, for example, a NR algorithm.
Research groups have therefore focused on speech tests that can be used at positive SNRs. One strategy is to use test material with less redundancy than sentence-based speech tests.15 Another strategy is to create more complex test setups, for instance, including reverberation.16 A third method is to manipulate test parameters, such as scoring method, masker characteristics, and target-masker spatial separation, to reach realistic SNRs.17
Alternatives to traditional speech testing have also been developed. In situations where speech understanding is close to 100%, listening effort may still vary. Attempts to measure listening effort include: 1) subjective ratings, 2) estimation of listening effort using measure of the cognitive load involved in the task, or 3) various physiological measures. This topic has been extensively covered in a special issue of Ear and Hearing.18
However, one can question if these laboratory tests really indicate real-life performance. Important real-life information may be gained using questionnaires, but questionnaires also have inherent problems. Evaluations are done retrospectively, which might create a recall bias. They are usually based on a set of predefined situations, some of which might not be applicable to the study participant, whereas some important situations might be missing. This means that questionnaires are probably more appropriate to use when evaluating if a hearing device intervention has generally met the wearer’s expectations, rather than when evaluating subtle signal processing differences.
Diaries have therefore been used in research for evaluation of hearing device features. Using these diaries give the test participants the chance, for example, to scale satisfaction or indicate preference when in a particular situation. This is a type of EMA technique, but it is a bit cumbersome to work with. With the introduction of smartphone-based EMA systems,10 we will likely see many studies where evaluations of hearing device features are performed in the informants’ real life.
In conclusion, this paper has presented two studies that have increased our knowledge about the auditory reality of people with hearing impairment. The findings have emphasized the importance of auditory reality on the design, fitting, and evaluation of hearing devices.
We are moving towards a firm grip on auditory reality!
Correspondence can be addressed to HR or Dr Smeds at: [email protected]
Original citation for this article: Smeds K, Wolters F. Towards a firm grip on auditory reality. Hearing Review. 2017;24(12):20-25.

References
-
Noble W. Auditory reality and self-assessment of hearing. Trends Amplif. 2008;12(2):113-120. doi: 10.1177/1084713808316172.
-
Smeds K, Wolters F, Rung M. Estimation of signal-to-noise ratios in realistic sound scenarios. J Am Acad Audiol. February 2015; 26(2):183-196. doi: 10.3766/jaaa.26.2.7.
-
Wolters F, Smeds K, Schmidt E, Christensen EK, and Norup C. Common Sound Scenarios: A context-driven categorization of everyday sound environments for application in hearing-device research. J Am Acad Audiol. July 2016; 27(7): p. 527-540. doi: 10.3766/jaaa.15105.
-
Smeds K, Bergman N, Hertzman S, Nyman T. Noise reduction in modern hearing aids— Long-term average gain measurements using speech. In: The International Symposium on Auditory and Audiological Research (ISAAR). Binaural processing and spatial hearing. Helsingør, Denmark;2009.
-
Kochkin S. MarkeTrak VIII: Consumer satisfaction with hearing aids is slowly increasing. Hear Jour. January 2010;63(1):19-32. doi: 10.1097/01.HJ.0000366912.40173.76
-
Pearsons KS, Bennett RL, Fidell S. Speech levels in various noise environments. Project report on contract 68 01-2466. Washington, DC: US Environmental Protection Agency (EPA);1977.
-
Teder H. Noise and speech levels in noisy environments. Hear Instrum. 1990;41(4):32-33.
-
Olsen WO. Average speech levels and spectra in various speaking/listening conditions: A summary of the Pearson, Bennett, & Fidell (1977) report. Am J Audiol. October 1998;7:21-25. doi:10.1044/1059-0889(1998/012)
-
Wagener KC, Hansen M, Ludvigsen C. Recording and classification of the acoustic environment of hearing aid users. J Am Acad Audiol. April 2008;19(4):348-370. doi: 10.3766/jaaa.19.4.7
-
Wu Y-H. 20Q: EMA methodology–research findings and clinical potential. June 12, 2017. Available at: https://www.audiologyonline.com/articles/20q-ema-methodology-research-findings-20193
-
International Organization For Standardization (ISO). ISO 12913-1:2014. Acoustics–Soundscape. Part 1: Definition and conceptual framework. Available at: https://www.iso.org/standard/52161.html
-
Gatehouse S, Elberling C, Naylor G. Aspects of auditory ecology and psychoacoustic function as determinants of benefits from and candidature for non-linear processing in hearing aids. In: Proceedings of the 18th Danavox Symposium. Kolding, Denmark: Danavox Jubilee Foundation;1999.
-
Smeds K, Leijon A, Wolters F, Hammarstedt A, Båsjö S, Hertzman S. Comparison of predictive measures of speech recognition after noise reduction processing. J Acoust Soc Am. September 2014;136(3):1363. doi: 10.1121/1.4892766
-
Naylor G. Theoretical issues of validity in the measurement of aided speech reception threshold in noise for comparing nonlinear hearing aid systems. J Am Acad Audiol. July 2016; 27(7):504-514. doi: 10.3766/jaaa.15093
-
Kuk F, Lau C-C, Korhonen P, Crose B. Speech intelligibility benefits of hearing aids at various input levels. J Am Acad Audiol. March 2015; 26(3):275-288. doi: 10.3766/jaaa.26.3.7
-
Best V, Keidser G, Buchholz JM, Freeston K. Psychometric effects of adding realism to a speech-in-noise test. In: Proceedings of Meetings on Acoustics (POMA). 2013;19:050067. doi:10.1121/1.4799505
-
Rønne FM, Laugesen S, Jensen NS. Selection of test-setup parameters to target specific signal-to-noise regions in speech-on-speech intelligibility testing. Int J Audiol. March 2017;56(8): 559-567. doi: 10.1080/14992027.2017.1300349.
-
Pichora-Fuller MK, Kramer SE, Eckert MA, et al. Hearing impairment and cognitive energy: The framework for understanding effortful listening (FUEL). Ear Hear. July/August 2016;37: 5S-27S. doi: 10.1097/AUD.0000000000000312.