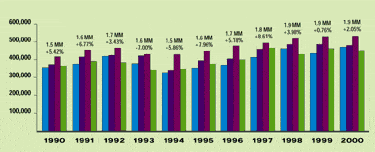
The average hearing instrument dispensing office in the U.S. witnessed nominal unit volume gains in 2000 compared to 1999, according HR’s analysis of Hearing Industry Assn. (HIA)1 end-of-year statistics. As shown in Fig. 1, hearing instrument net unit sales totaled 1.93 million in 2000, a 2% increase—or 38,800 more hearing instruments—over 1999 sales levels. But even this small gain has to be taken with a grain of salt: the Dept. of Veterans Affairs (VA) dispensed 34,300 more units in 2000 than in the previous year. That means only about 4500 more hearing instruments were sold in 2000 by the approximately 11,600 dispensing offices in the U.S.

Fig. 1. Net sales of hearing instruments in the U.S. reached 1.93-million units in 2000. When exports are included, total U.S. sales reached 2.05-million units in 2000. Source: HIA.
Despite these numbers, HR estimates that the average hearing instrument dispensing office saw net revenues climb by 8-12% due to the higher proportion of programmable and DSP instruments sold. Sales of analog programmable and digital signal processing (DSP) instruments—also called high performance hearing instruments (HPIs)— now comprise half of the entire hearing instrument market, according to HIA figures (Fig. 2). This is remarkable when one considers that, only five years ago, many leaders in the hearing industry were bemoaning the fact that HPIs accounted for a sorry 8.2% of sales.

Fig. 2. Popularity of programmable and digital instruments has now reached a point in which these two technologies together represent half of all hearing instruments dispensed. Last year is the first full year in which statistics on digital aids were available from HIA; prior to 2000, HIA reports combined programmable and DSP unit volumes (i.e., above DSP statistics for 1998-99 are HR estimates). Source: HIA and HR estimates (denoted by asterisks).
When including exports, U.S. net unit growth of hearing instruments was even smaller. A total of 2.05-million hearing instruments were sold—an increase of 0.08%. To some extent, this may reflect the shifting of industry power to Europe (discussed later in this article), and global manufacturing in general is making it possible for manufacturers to distribute products that are made in close proximity to the countries where they are dispensed.

Apparently, the hearing care market views optimist and pessimists as equals; it mangles both. The prevalent view of today’s hearing industry optimist is that fast-paced, improved technology will eventually carry the day. Arming themselves with sheer positivism, the optimists believe that DSP and directional microphone technology, as well as a host of other algorithm- and software-driven innovations, will eventually spur customer satisfaction and, hence, word-of-mouth advertising. Simultaneously, the aging, techno-savvy baby-boomer population will finally embrace hearing care products as a necessity for living their healthy hyper-social lifestyles.
In contrast, the prevalent view of today’s hearing industry pessimist is that the higher prices of HPIs will diffuse any effect that this technology has on consumers’ views about product value, and the baby-boomers look more and more like their grandparents every day: reluctant to admit to a hearing loss and even more reluctant spend money on a hearing aid. Additionally, the Schleprock faction contends that the hearing instrument distribution network has more holes in it than a Dade County election ballot, that marketing efforts by both the industry and private dispensers continue to be abysmal, and that the government—in its infinite wisdom— will somehow find a way to interject itself and transform a bad situation between the dispensing professions into an outright internecine feud.
When predicting gains or losses in the hearing industry, optimists and pessimists (and editors) can claim little advantage over one another. Estimates place the number of hearing-impaired people in the U.S. at 20-26 million2,3, with only about 5.6 million of them wearing hearing aids.4 Market penetration is stuck at somewhere around 20.4% and, by all indications, is not going up.2 What is happening in the hearing care market, and what might be expected in the next few years? This article will explore some of the major trends and present a perspective of the U.S. and the global market.
The U.S. Hearing Health Care Market
In terms of quarterly sales statistics, there was nothing remarkable about the year 2000. Quarterly U.S. sales of hearing instruments (Fig. 1) closely paralleled those of 1999. First-half net unit sales in 2000 totalled 918,000 units for a 3.6% increase over the previous year, followed by sales of 978,000 units in the second half for virtually no change (0.6%) compared to the previous year. The 1,930,005 total units dispensed last year places the 2-million unit mark within reach for 2001—should sales growth meet or exceed 3.6%. Unfortunately, this is by no means guaranteed.
Effect of high performance instruments: By far, the most exciting trend in the U.S. hearing instrument market—as well as the world market—is the explosive growth of programmable and DSP hearing instruments (HPIs). HPI technology is transforming the landscape of the hearing care field on both the manufacturer and dispenser levels. In 2000, the first full year in which HIA kept statistics on digital instruments, 384,000 DSP instruments were dispensed, compared to 587,000 units for programmable analog and 959,000 units for analog non-programmable (referred to in this article as simply “non-programmable”) instruments. While there are no available HIA statistics for the growth of DSP instruments in previous years, HR estimates that DSP market share has increased from approximately 7% in 1998, to 13% in 1999, to 20% in 2000 (Fig. 2). Correspondingly, programmable analog market share is estimated at 19%, 26% and 30% for these years respectively.
Looking at it in another way, the decline of non-programmable analog instruments parallels the rise of HPIs. 1997 was the last year in which sales of analog non-programmable instruments increased. Since then, these instruments have declined in market share from 1.39 million units (74%) in 1998, to 1.16 million (61%) in 1999, to 959,000 units (49%) in 2000. To place this trend in perspective, consider that there were 89,000 more programmable and 146,000 more DSP instruments dispensed in 2000—and almost 200,000 fewer non-programmable instruments.

Fig. 3. Trends in hearing instrument prices (adjusted for inflation, in 1999 US dollars) for hearing instruments as reported by dispensing professionals. Source: HR Dispenser Survey, 2000.5
While the total unit volume of hearing instruments increased by only 2% in 2000, HR estimates that the gross revenues of the average dispensing office rose by 8-12% due to the increased popularity of programmable and DSP instruments. Because a major proportion of sales are now comprised of these instrument types, the average cost of a hearing instrument is now around $1450. However, when looking at the actual price of the specific product types (Fig. 3), it’s clear that hearing instrument pricing has remained fairly consistent over the last six years—it’s just that more DSP and programmable hearing instruments are being chosen by consumers. Total gross revenues in the U.S. at the retail dispensing level are estimated by HR to be $2.8 billion in 2000, up from $2.5 billion in 1999.

Fig. 4. Percentage of net units by technology type (left) as reported by HIA, and percentage of gross revenues (right) these instrument represent as estimated by HR.
About 50% of hearing aid sales are analog non-programmable and 50% are DSP and programmable; however, each of the three technology types roughly comprise one-third of the gross revenues of a typical dispensing office in which hearing instrument sales are the primary revenue source (Fig. 4). HR estimates that, for the average office, about 32% of revenue is generated from non-programmable aids, 32% from DSP aids and 36% from programmable analog instruments. The statistics also show that the average dispensing office in 2000 had gross revenues of approximately $223,000, which concurs with the results of HR’s 2000 Dispenser Survey (June 2000, p. 12).5 (Editor’s Note: Average retail gross revenue figures reported in this article are derived by applying the price of each instrument type as reported in the HR Dispenser Survey5 and extrapolating them to the HIA statistics1 for those instruments. Because average instrument prices for 2000 are not yet available (the HR Dispenser Survey will be published in the June 2001 issue), this article assumes static prices (i.e., 2000 instrument prices equal 1999 prices). It is important to note that considerable variations may exist in retail gross revenue estimates due to the “bundling” of service and testing fees within hearing instrument prices (i.e., instruments and services are often reported as the “hearing instrument cost” in the annual HR Dispenser Survey). Additionally, factors such as third-party discounts, leasing programs, VA sales activity, etc., may affect retail values significantly. Thus, the retail dollar figures reported in this article are offered only as estimates and as a useful gauge for the actual value of the market.)
Sales Gains and Losses Highly Dependent on Region: Although the above marketing statistics are meant to reflect overall, average trends in U.S. hearing instrument sales, it can be seen that hearing instrument unit volume gains and losses were highly regional in 2000. When looking at HIA state-by-state statistics, it can be seen that 27 states and the District of Columbia experienced net unit losses of hearing instrument sales.
There was a definite pattern to these sales declines, with unit volume decreases concentrated in the Northeast, Midwest and parts of the Pacific Northwest. All states to the north of the Tennessee and North Carolina borders experienced sales losses, with the exception of Indiana, Rhode Island, New Hampshire and Delaware. Likewise, every Midwest state north of the Kansas and Missouri borders saw their sales fall. In the West, Washington, Oregon and Montana also saw sales decrease. While most of these hearing instrument sales losses were in the 2-5% range, a few states posted significant sales declines: Alaska (-13.4%), New Jersey (-15.4%), Vermont (-17.8%) and West Virginia (-9.0%).
The remaining 23 states generally experienced net unit volume gains in hearing instrument sales of 2-5%. As in past regional sales surveys11, the Southwestern states, particularly Colorado (15.6%) and New Mexico (7.8%) witnessed sizable increases. To the north, Idaho (16.1%) posted the largest percentage gain during 2000.
|
Table 1. Hearing Instrument Styles |
||||
|
Percentage of units dispensed by hearing aid style and technology type. Source: HIA. |
||||
| Non-Prog % | Prog % | DSP % | All % | |
| BTE | 21.9 | 14.0 | 25.6 | 20.2 |
| CIC | 7.2 | 17.6 | 27.9 | 14.5 |
| ITC | 20.6 | 25.9 | 22.3 | 22.5 |
| 1/2-Shell ITE | 8.6 | 9.1 | 6.0 | 8.2 |
| Full-Shell ITE | 37.3 | 32.6 | 17.7 | 31.9 |
| Other ITE | 4.3 | 0.9 | .5 | 2.5 |
| Eyeglass & misc | 0.1 | — | — | — |
| 100.0% | 100.0% | 100.0% | 100.0% | |
Instrument styles: HIA figures reveal that the digital instrument class is fairly distinct from styles of other hearing instrument technology types (Table 1).1 Half of all digital instruments are dispensed in the most “invisible/inconspicuous” styles (CICs 27.9%; ITCs 22.3%), one quarter (25.6%) are BTEs, while full-shell (17.7%) and half-shell (6.0%) ITEs account for the other quarter.
In contrast, half (50.2%) of non-programmable analog instruments are of the larger ITE styles (half, full and other ITE), while the “inconspicuous” aids (ITC + CIC) comprise only about one-quarter and BTE styles account for the other quarter of instrument styles.
Analog programmable instruments are somewhat in between digital and non-programmables: the “inconspicuous” ITC and CIC styles account for about 40% of sales, as do the larger half- and full-shell ITE models.
There appear to be only two significant trends taking place in the overall style preferences of U.S. consumers. The first is that CICs are gaining in overall popularity primarily due to the fast-paced volume gains of digital instruments. The second is that BTE use has increased slightly in the past two years, possibly due to the “renaissance” in directional microphone instruments and the favoring of BTEs in directional-mic fittings.
|
Table 2. Return for Credits |
||||
| Percentage of units returned by hearing aid style and technology type. Source: HIA. | ||||
| Non-Prog% | Prog% | DSP% | Per Style% | |
| BTE | 15.9 | 27.7 | 29.0 | 22.2 |
| CIC | 23.3 | 18.6 | 26.6 | 23.0 |
| ITC | 16.5 | 17.5 | 26.3 | 19.0 |
| Full-Shell ITE | 12.0 | 15.1 | 29.3 | 15.3 |
| Per Technology | 15.1% | 18.9 | 27.7 | 19.5 |
Hearing Instrument Returns: In 1999, Return for Credit (RFC) rates dropped by about 1% from the previous year. In 2000, however, the return for credits in the U.S. went up by 1.7% to 19.5% (Table 2). The rate is almost certainly reflective of the increase in the use of DSP and programmable instruments.
Four of the five most frequently returned kinds of hearing instruments were digital (full shell ITE: 29.3%; BTE 29.0%; Other ITE: 27.0% and CIC: 26.6%). With DSP instruments, there are at least two potential strikes going against the dispensing professional during the fitting: the style is more likely to be a CIC or ITE, and the consumer’s expectations may be greater. As a group, digital aids were returned 27.7% of the time, substantially higher than in 1999 when they were returned 25.1% of the time.
Programmable analog RFC rates actually went down by 2.3%, from 21.0% in 1999 to 18.7% in 2000. However, programmable BTEs had the third highest RFC rate (27.7%) of any hearing instrument type. Programmable CICs had RFCs of 18.6%, ITCs 17.5%, and full-shells 15.1%.
All non-programmable instruments, except CICs (23.3%), had relatively low return rates of 15.1% overall, approximately the same as in 1999 (15.5%). Non-programmable ITCs had RFCs of 16.5%, and non-programmable BTEs (15.9%) and full-shells (12.0%) of this type had the lowest return rates of any hearing instrument style.
Thus, the most frequently returned styles of hearing instruments from highest to lowest RFC rates were CICs (23.0%), BTEs (22.2%), ITCs (19.0%) and full-shell ITEs (15.3%).
When considering the rapid popularity of HPIs, the 1.7% increase in return rates is probably not surprising. However, when considering that one out of every five hearing instruments dispensed is returned to the manufacturer, RFCs represent an obvious place for the industry and the dispensing professionals to improve upon for the purpose of more expedient fittings and, ultimately, lower costs to the the consumer. (Editor’s Note: It should be noted that RFCs can be of dubious value for assessing factors such as customer satisfaction, market potential and dispenser/ manufacturer fitting success. Additionally, what manufacturers define as a “return” can significantly differ from dispensing professionals’ use of this term.)
A Brief Look at the Global Hearing Instrument Market
For decades, the U.S. hearing industry has remained relatively unconcerned about marketing and sales trends outside its borders. Because there were fewer hearing industry companies that had headquarters outside the U.S., and the overseas market was so different—especially when considering style preferences and/or reimbursement for hearing aid purchases—many of the statistics regarding worldwide hearing instrument sales almost seemed footnoted as “Has nothing to do with you.”
However, globalization of the hearing care field has arrived. Six of the seven largest hearing instrument manufacturers now have their world headquarters in Denmark, Germany, Italy and Switzerland (Fig. 6). What happens in Europe and the rest of the world now greatly impacts the U.S. hearing instrument market relative to the amount of resources these companies can commit to marketing, support, R&D, manufacturing, etc., in this country.
Worldwide Sales: North America accounts for 35-40% of the world’s hearing instrument market, Europe also accounts for 35-40%, the Pacific Rim countries comprise 12-14% and the Rest of the World (RoW) 11-13%.6,12
Worldwide hearing instrument sales were estimated in 2000 to be about 5.8-6.1 million units with a dollar value of approximately $1.7-2.1 billion at the manufacturing level.6,7 In 2000, unit growth for the worldwide hearing instrument market was estimated to be 6.4-7.2%6,7, compared to the 2.0% gains in the U.S. However, due to the increased sales of programmable and DSP instruments, the actual dollar-value growth during 2000 may be more like 14% for those companies that developed and marketed HPIs successfully.7 This double-digit growth in world market value is unlikely to continue for more than a few years, as the prices of the new high performance aids level off from competition and/or the possible advent of new products that could change HPI value (for example, rapid success of disposable/entry-level products or the advent of a “generic” digital integrated circuit.7,12 ).
It’s tempting to believe that, as prices of the high performance instruments go down, market penetration will automatically rise. Yet, several manufacturers and market watchers believe that the eventual lower prices of HPIs will not grow the hearing instrument market appreciably or even increase market penetration of HPIs in developed countries. Yet, price declines due to competition among manufacturers is likely to occur as the manufacturers strive to attract more dispensers and build larger distribution networks. One possible side effect is that, with the lower pricing of HPIs, the perceived consumer value of all hearing instruments may be bolstered, leading to more positive word-of-mouth advertising for the field in general.

Fig. 5. Estimated percentage of hearing instruments that are dispensed from the brand that the office uses most often, as reported by hearing instrument specialists and dispensing audiologists. Source: HR.5
Industry Consolidation: With the recent flurry of consolidation, there is a new look to the structure of the hearing industry (Fig. 5). According to Carnegie Research7 and Enskilda Securities12, almost two-fifths of worldwide hearing instrument sales can be attributed to the Siemens (21%) and GN Great Nordic (16-18%) groups. The Starkey (14-16%), William Demant (12-15%), and Phonak (12-15%) groups, along with Widex (8-9%), also hold significant worldwide market shares. Other manufacturers with notable shares of the global market include the Amplifon group (Miracle-Ear), Rion, Sonic Innovations and Telex, to name a few. It should be recognized that these statistics reflect worldwide market share; market share of the many manufacturers competing in the U.S., as well as their positions in the market, may be substantially different than those of the worldwide market.
|
Table 1. Return for Credits |
||||
|
Percentage of units returned by hearing aid style and technology type. Source: HIA. |
||||
| Non-Prog % | Prog % | DSP % | Per style % | |
| BTE | 15.9 | 27.7 | 29.0 | 22.2 |
| CIC | 23.3 | 18.6 | 26.6 | 23.0 |
| ITC | 16.5 | 17.5 | 26.3 | 19.0 |
| Full-Shell ITE | 12.0 | 15.1 | 29.3 | 15.3 |
| Per Technology | 15.1% | 18.9 | 27.7 | 19.5 |
The consolidation movement of the last two years is in reaction to the increasing necessity for “economy of scale,” according to Carsten Trads and David Smriga of GN ReSound who have presented seminars on consolidation, as well as published an article in HR on mergers and acquisitions.8 They contend that critical mass is crucial if a company expects to compete effectively in the global arena.
A good deal of consolidation is due to the cost of developing the new HPI technology and the scale of manufacturing instruments for the worldwide market. The costs of research and development (R&D) of hearing instruments have risen exponentially, while the average product life cycles have fallen precipitously. As detailed in last year’s HR market analysis9, the development costs of a mid-1980s hearing aid was $150-200,000, and the resulting product would be expected to generate revenues for 10 years or more (in some cases, as long as 15 years). Today, R&D costs range from $10-30 million and the products have a life cycle of only 3-4 years.8 This creates tremendous pressure on manufacturers to recoup their investments within shorter periods of time.
In order to gain the benefits of “economy of scale,” the companies have to gain market share and use their resources judiciously. Responding to the pressures of the new market, several companies merged or made acquisitions during 2000:
- Argosy merged with Lori/Unitron. Soon after, the Phonak Group acquired the Lori/Unitron and Argosy Group. Phonak also acquired the manufacturers/ distributors Auris (Denmark) and Ido Laem (Spain).
- Sonic Innovations offered its stock for public trading;
- William Demant purchased Dahlberg Canada, Hidden Hearing (a large dispensing chain in the UK, Ireland and Portugal) and purchased a minority share in AVADA;
- Philips Hearing Instruments Div. and Beltone officially merged. Months later, GN Great Nordic purchased these companies;
- Amplifon (owner of Miracle Ear) acquired the distributor Acoudire.
- William Demant and Starkey announced they would work jointly on wireless technology;
Many believe that industry consolidation may intensify before it subsides. While it’s true that the large “block-buster” deals are becoming more limited as fewer large, independent companies remain, there are several opportunities left for substantial acquisitions or mergers. Additionally, it’s possible that two or more of the major groups could be involved in a merger or acquisition with one another.
There has also been speculation on the potential merits, benefits and pitfalls of forward and backward integration. Simply put, forward integration is where a hearing instrument manufacturer or supplier purchases an established dispensing network to bolster and solidify the distribution of its products and gain market share. Backward integration is the opposite: a large retail dispensing network purchases a manufacturer or a manufacturer purchases a supplier.
The consolidation movement has also gained momentum in the retail sector in recent years. Currently, Beltone, Miracle Ear (Amplifon), Sonus, HEARx and Helix each have more than 100 offices in North America, while Newport Audiology and AVADA have about 50 or more dispensing offices. By some estimates, these networks can claim a combined market share as high as 20%12 (although HR estimates 12-15%). Dispensing networks are now able to leverage their marketing and distribution power to gain significant advantages. However, more than 75% of all hearing instruments are still dispensed from independently owned offices, and this situation is unlikely to change in the immediate future.
Potential Industry Influences for 2001 and the Distant Future
Directional Hearing Instruments: One of the main barriers to customer satisfaction with hearing instruments is performance in multiple environments. In a study published by HR last year, Kochkin found that multi-microphone instruments achieved customer satisfaction ratings 17% higher than conventional instruments and 14% higher than single-mic, omni-directional instruments.14
|
Worldwide Market Share |
|||
| Siemens Group* Siemens Rexton Electone A & M Hearing |
21% | William Demant Holding* Oticon Bernafon |
12-15% |
| GN Nordic Group* GN ReSound Beltone Danavox Viennatone Phillips Hrg. Instrum |
16-18% | Phonak Group* Phonak Lori/Unitron Argosy Unitron (Canada) |
12-15% |
| Starkey Group Starkey Micro-Tech Qualitone OMNI Nu-Ear |
14-16% | Widex Widex |
8-9% |
| Table 5. Consolidation of the hearing industry has been occurring for at least two decades, starting in the U.S. with Starkey’s acquisitions during the 80s and 90s. Today, it is estimated that six hearing instrument manufacturers account for approximately 85% of worldwide sales. However, it should be noted that U.S. market shares differ substantially from the worldwide figures shown here. Additionally, certain companies in a group may act as completely independent entities relative to operation, manufacturing, R&D, etc. Asterisks indicate public companies. Source: Carnegie Research, Enskilda Securities and HR. | |||
While directional hearing instruments have been around for decades, it wasn’t until the mid-90s that they were taken up seriously again by manufacturers.13 Today, there is a “renaissance” in directional microphone instruments. Of the 100 different product lines listed in the Jan. 2001 HR Programmable and DSP Instrument Buyers’ Guide, 58 had one or more models that offered a directional microphone option (it should be noted that many of these utilized D-MIC, Frontwave and VECTOR technology). Although no published numbers exist on their sales, it’s possible that directional instruments, as a product class, may parallel the growth of programmable and DSP instruments in the coming years. The increased popularity of directional instruments may also be fueling the slight increases seen in BTE unit volumes in the U.S.
Fewer product lines carried by dispensing offices: The HR Dispenser Survey5 indicated that hearing instrument dispensers are using relatively few brands of hearing instruments and using one product brand for the vast majority of their sales. Overall, 53% of all dispensing offices use four brands or fewer in their practices. When considering the major brand of hearing instrument used in an office, dispensing professionals report that they distribute 68% of all their hearing aids from that one brand (Fig. 5).
As discussed in last year’s analysis9, this may be reflective of the growing complexity of programming instruments and the proprietary software systems used to fit them. Sophisticated HPIs require training and time to become familiar with their fitting software, adjustable parameters, etc. (hence, part of the reason for their higher price). When considering only HPIs (i.e., disregarding all non-programmable aids), there are now over 100 instrument lines (41 digital and 59 programmable) from 21 different manufacturers. Each one of these lines has a number of different styles and models which require at least some knowledge of its features. At the same time, new products, software, fitting formulae, etc., are being introduced on a regular basis, requiring dispensing professionals to become familiar with them, or face the possibility of falling behind the competition and/or learning curve.
For dispensing professionals and manufacturers alike, the education required for fitting these products is no longer an option; it’s a requirement and a cost of doing business. Because many of the manufacturers have evolved distinct overall product/fitting “philosophies” (e.g., compression types, various noise reduction or speech enhancement strategies, etc.) that are reflected in all, or many, of their products and software, it’s much easier for a dispensing professional to take on a new line from a manufacturer they previously did business with. Thus, the efficacy and logic behind the manufacturers’ amplification philosophies and fitting rationales—along with the software that implement them—will continue to gain importance.
The above trend also requires manufacturers to commit more resources for education, sales and marketing efforts (on top of the previously mentioned R&D costs) if they hope to convince a dispensing professional to drop one brand for another. In the past, a new trimpot here and a new faceplate design there, might have been exciting enough for a dispensing office to switch brands. Today, an incremental improvement over a currently used product might not be enough to persuade a dispenser to switch brands. The results of this trend can be seen in the increased marketing presence, image-building and positioning of hearing instrument manufacturers as they strive to acquire greater market share.
Branding: Branding is likely to be a larger force in the years to come, as hearing instrument manufacturers look to add established, quality names to their product mix in order to fulfill the divergent needs of dispensing professionals worldwide. By establishing a “stable” of two or three well-known brands—with each having its own individual product identity, fitting philosophy, price points, etc.—a manufacturer stands a better chance of getting more products onto the shelves of a given dispensing office.7 Manufacturers may also have an eye on the distant future when branding could become a larger factor in mass marketing campaigns to consumers. Today’s general lack of brand recognition of hearing aids by consumers also leaves the market open to new entrants (including less reputable marketeers).
Eroding sources of organic growth: The increase in binaural fittings in the past two decades had large positive effects on the hearing industry and dispenser revenues. In 1979, binaural fittings were utilized only 27% of the time, rising to 46% of fittings in 198910 and to 63% in 1995.5 However, this number is unlikely to rise much further beyond the 68% level reported in 2000.5
A similar situation may be occurring relative to the average selling price of hearing aids, and a limited number of dispensing offices could eventually feel the financial pinch. HR estimates that, currently, for each 1% decline in DSP and programmable instrument prices, the average dispensing office (i.e., one that has gross revenues of $223,000 per year and relies on hearing aid sales for the bulk of its revenues) would experience a $1520 shortfall in sales—roughly equivalent to the gross revenues from one CIC or programmable instrument sale. The average office dispenses 13-18 hearing aids per month5 (or about $18,500 in monthly revenue), and larger deccreases in hearing aid prices over a number of years, combined with the current annual unit volume growth of 1-4%, might pose financial problems for smaller, private practices.
The Small Number of Dispensing Offices & Its Effect on Marketing: While this is an unpopular theory, the editor has contended on several occasions (e.g., see Sept. 1998, p. 4 and April 2000, p. 4) that the relatively small number of dispensing offices, combined with factors already described in this article (i.e., increased complexity of fittings and counseling time requirements), is preventing the hearing industry from making significant volume gains and increasing its market penetration.
There were approximately 11,600 offices in the U.S. in 2000 (up from 11,300 offices in 1998), although many of these are satellite or part-time offices, as well as practices/clinics/hospitals that focus primarily on diagnostics. If there are approximately 20-26 million hearing-impaired people, each of these offices would have to administer to an average of 1700-2200 active clients. Even if one is skeptical of the 26-million-person figure, half that number would still mean 1120 active clients per office—more than many offices could handle.
This is not to suggest that the number of offices determines consumer demand. However, the amount of marketing dollars appropriated by dispensing offices to attract new clients is, at the current time, quite small.5 Additionally, distribution of hearing instruments in some regions of the country is alarmingly low compared to regions of comparable population densities.11 Although the noble efforts of hearing awareness organizations are acknowledged, when the above facts are combined with a dearth of mass marketing to consumers by hearing aid manufacturers, a good argument can be made that hearing instruments are available only to consumers who research and pursue products themselves, as opposed to seeing and hearing about the products in advertisements.
Entry Level and Disposable Hearing Aids: Without question, one of the largest attention-getters in 2000 was Songbird Medical’s disposable hearing aid. The company spent most of 2000 carefully releasing Songbird into larger, select markets across the U.S. At the same time, a new class of “entry-level” instruments has emerged, including GN ReSound’s Avance, Sonic Innovations’ Conforma, Audina’s Easy Ear, A&M Ltd.’s Hear & Go and Audio ‘D’s Simplicity.
It remains unknown how these instruments will influence the market. Many liken the new instrument class to “reading glasses for the ears” or a convenient way to “try” amplification, while others see the devices as longer-term hearing solutions. The instruments have the potential to bring many new users into the market and provide a quality, economical alternative for consumers. However, others have expressed concern that the products may not really be much less expensive in the long-term, may leave the field more susceptible to unscrupulous marketeers and may not always represent the best fitting choices or technology.15 Whatever their effect, these new instruments have the potential to change businesses’ ways of looking at fees-for-service (see Joel Mynders’ article in this issue) and may profoundly influence the hearing industry in a relatively short period of time.
Professional Training: Without question, the professional training of hearing care professionals has increased over the last 10 years, and the results may be seen on many levels. The number of academic, CEU and technology-update opportunities have increased dramatically, as reflected on the calendar pages and websites of hearing-related media. Several AuD curriculums that cater to current practicing audiologists, including programs composed chiefly of online courses, are available. For hearing instrument specialists, a new two-year program is now available from Spokane Falls Community College in Washington state, and this program went online in January.
Reaching Out to Physicians: In 1993, less than one-fifth (18%) of consumers reported receiving a hearing screning during their last physical exam. One of the main strategies of the Better Hearing Institute (BHI), as well as several of the professional organizations, is to raise hearing healthcare awareness in physicians. BHI is embarking on an ambitious program to provide family practitioners and primary care physicians with information on how to recognize the signs of hearing loss, as well as providing doctors with information on the serious potential consequences of undiagnosed hearing loss.
Possibility of Merging Technologies: When looking at the long-term picture, the potential convergence or “cross-pollination” of technology between the hearing industry and the telecommunications industry is certainly interesting:
- William Demant (the parent company of Oticon and Bernafon) manufactures headsets through its company DanaCom;
- GN Great Nordic manufactures headsets through GN Netcom, and has manufactured its CommPort communication device for firemen in collaboration with Motorola;
- Telex is well known in the U.S. for its headsets and telecommunication systems;
Starkey has smaller operations involved in headset manufacturing and is also reportedly working with Oticon on the development of wireless technology. Starkey President William Austin expressed high hopes for the use of Bluetooth technology in hearing instruments during an IHS Technology Luncheon two years ago.
Phonak has developed a CIC-like radio communication device and has been reported to be working on the development of headsets with a large telecommunications company.7
When considering the obstacles both industries face (electronic packaging, speech intelligibility and voice recognition, signal integrity, etc.), it is apparent that hearing and telecommunications engineers are trying to tackle many of the same problems. But could the devices ever converge to form a James Bond-like ITE/cellphone? Big questions include how much would that kind of product cost, what kind of features and sound quality would it offer, and how would it be dispensed? An even larger question to someone eyeing entry into this market is, Who would buy it? At an average price of around $1400, a custom-fitted hearing aid is far dearer in price than the typical $39 cell phone.
FDA Activity: Looming on the horizon since 1994 has been the possible release of the FDA’s revised hearing aid regulation. Since the middle of 2000, the Agency is reportedly leaning toward a system that essentially turns the regulations over to the states to decide dispensing criteria. Should this happen, interdisciplinary feuds and corresponding bad press could put hearing instrument sales into a nosedive, much like what occurred during the last time revision of the Hearing Aid Rule was proposed in 1993-94.
In late-December 2000, the Hearing Aid Rule had reportedly been sent to the Office of Management and Budget (OMB) for a 90-day review in preparation for its publication in the Federal Registry and the period of commentary. As the new administration in Washington took over, however, White House Chief of Staff Andrew Card ordered that rules not yet issued be reviewed by the new appointed leadership of each agency. The Hearing Aid Rule reportedly has been returned to the Dept. of Health and Human Services for review.
Only One Thing Unchanged: Market Penetration
Certainly, there is an array of other issues and emerging technologies that could initiate significant change in the hearing industry. On the technical side, research into genetics and hair cell generation (e.g., see this month’s article on research at the House Ear Institute), middle-ear implants16, advances in speech processing and voice recognition, and new pharmaceutical approaches to hearing loss are only a few examples. On the marketing side, the major shifts in U.S. (and world) demographics toward older clients, e-commerce and the role of the Internet in dispensing (see Peter Mark’s article in the Dec. 2000 HR17), as well as more concentration on gaining the attention of the hearing-impaired persons’ “significant others”18—often the primary motivators in initiating an office visit—all have the potential to transform the industry as we know it.
And, with a static 20.4% market penetration, there appears to be a good argument that the industry might be in need of some positive transformation.
|
Hearing Review Headlines in 2000 |
|
| January 2000 Congress passes newborn hearing screening legislation New York to reimburse hearing screening for all babies National Day of Hearing Testing launched by SHHH AAS to hold Scientific Meeting Millennium conference on hearing aids and batteries Sonus to award AAA Convention 2000 Scholarships Symphonix and Siemens announce strategic partnership Mid-Atlantic Hearing Expo scheduled February 2000 March 2000 April 2000 May 2000 June 2000 |
July 2000 Symphonix reports financial results HearPO Corp. signs five agreements Marcon charter members receive award CID development office wins Excellence Award Helix continues growth in Ontario August 2000 September 2000 October 2000 November 2000 December 2000 |
Karl Strom is editor of The Hearing Review. He can be contacted via email at [email protected] ; phone: 218-525-5558; fax: 218-525-5559.
References
1. Hearing Industries Assn: Quarterly Statistics Report for the Fourth Quarter 2000. Alexandria, VA: HIA, 2001.
2. Kochkin S: “Baby boomers” spur growth in potential market, but penetration rate declines. Hear Jour 1999; 52 (1): 33-48.
3. Nat. Center for Health Statistics: Health, United States, 1993. Hyattsville, MD: Public Health Service, 1994.
4. Kochkin S: MarkeTrak V: “Why my hearing aids are in the drawer”: The consumers’ perspective. Hear Jour 2000; 53 (2): 34-42.
5. Skafte MD: The 1999 hearing instrument market—the dispensers’ perspective. Hearing Review 2000; 7 (6): 8-40.
6. Badri V: The evolving worldwide hearing instrument market. Hearing Review 1998; 5 (6): 35-37.
7. Clemens M: Hearing Aids: Industry Report. Copenhagen, Denmark: Carnegie Nordic Equities, Oct. 2, 2000.
8. Smriga D & Trads C: Effects of mergers and acquisitions on hearing health care. Hearing Review 2000; 7 (4): 8-16.
9. Strom KE: The hearing care market at the turn of the 21st century. Hearing Review 2000; 7 (3): 8-22, 100.
10. Cranmer KS: Hearing instrument market analysis. Hear Instrum 1990; 41 (5): 6-10.
11. Strom KE: 1999 regional marketing review. Hearing Review 2000; 7 (4): 48-51, 60.
12. Enskilda Securities: Hearing Aids. A Sound Growth Story. Copenhagen, Denmark, Jan 8, 2001.
13. Preves D: Directional microphone use in ITE instruments. Hearing Review 1998; 4 (7): 21-27.
14. Kochkin S: Customer satisfaction with single and multiple microphone digital hearing instruments. Hearing Review 2000; 7 (11): 24-34.
15. Sweetow R: An analysis of entry-level, disposable, instant-fit and implantable hearing aids. Hear Jour 2001; 54 (2): 28-43.
16. Strom KE: An update on implant technology: Implantable hearing aids. Hearing Review 1999; 6 (12): 12, 33-34, 66.
17. Mark P: Entering the Internet surf: A professional perspective. Hearing Review 2000; 7 (12): 24-29.
18. Walsh S: Personal communication, 2000.