Marketing | August 2015 Hearing Review
Why care about industry benchmarks? Because it provides your business with insights and a guide for future improvement and growth.
In this era of increased competition, shrinking ASPs, higher cost-of-goods, and squeezed margins, owners of hearing healthcare practices need to pay more attention than ever to their business efficiencies, sources of new patients, marketing spend, and strategies regarding third-party payers. Overall, this PBS shows there are ample opportunities for growing a hearing healthcare business for those HCPs who are willing to analyze the data and ask more profound questions than “Why should I care?”
Although a practice benchmark study (PBS) may not be at the top of your summer reading list, it does present several opportunities for strategic hearing care professionals (HCPs) to gain insights into growing a practice and differentiating themselves from the competition. PBS analysis provides more than a mere snapshot of your peers’ businesses; the data serves as “informational fuel” for your practice, helping you to prioritize goals and identify potential gaps in your business.
In last year’s PBS,1 we focused on turning key findings into action items to help you compete and win. This article renews its focus on analysis over summary. After all, data from a PBS is perhaps most useful when it goes beyond a mere summary of key findings and succeeds in answering the question: Why should I care?
The goal of this article is to help you find relevance and meaning simply by answering that question.
Background on this PBS
American Opinion Research was commissioned to conduct a survey on business practices from July to September 2014. Like previous benchmark studies, information obtained was based on 18 months of historical data—in this case January 2013 through June 2014.
Respondents included practices from 261 locations across the United States, and questions ranged from practice demographics and financial metrics to staffing and marketing. New topics investigated this year included the growing impact of national/Big Box retailers (eg, Costco), third-party payers (eg, insurance companies), online lead-generation of referral programs, social media, and the Affordable Care Act.
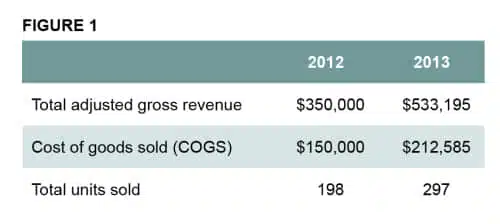
Finding 1: Total adjusted gross revenue, cost of goods sold (COGS), and total units sold have all increased.
Why should I care? The survey’s financial findings are consistent with other industry data that suggests HCPs are selling more hearing aids, with receiver-in-canal (RIC) instruments continuing to dominate sales.2 Average cost of goods (COGS) increased by $62,585 due to a higher technology mix and units (40% COG), while total units sold increased 50% and total revenue soared by nearly 35%.
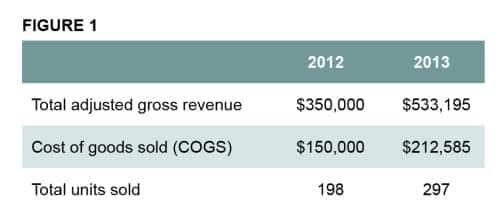
Table 1. Comparison of mean total adjusted gross revenue, COGS and total units sold for 2012 vs. 2013.
These substantial increases are likely due to the increase in number of multi-office practices in our sample, but it’s also indicative of a stronger market in general. According to MarkeTrak 9 (MT9),3 the average age of hearing aid owners may be getting younger, and more first-time buyers have entered the market. This, combined with increased adoption rates and higher overall satisfaction scores with hearing aids, all help drive more hearing aid sales.
However, despite all this good news, the percentage of new patients fit with hearing aids actually decreased for the third straight year. As mentioned in last year’s benchmark report, independent practices should strive to have at least 60% of their total gross revenue come from new patients.1 Why is this so important? According to the data in this survey, hearing aid sales from existing patients (who presumably “traded up”) decreased from 31% to 21% in one year.
In theory, this trend makes sense: the shelf life of hearing aid technology is constantly improving, and new features can now be added via a quick software update. Improvements to manufacturing processes have resulted in more robust hearing instruments.
The bottom line is that HCPs can no longer afford to bank on revenue from repeat business. More effort needs to be placed in marketing to and attracting new business.
Finding 2: In medical practices, 68% of new patients and 65% of total revenue come from physician referrals.
Why should I care? The story here is that the numbers for non-medical practices paint quite a different picture. Compared to their medical counterparts, HCPs in non-medical practices only had 19% of new referrals and 18% of revenue come from physician referrals (Table 2). Now, if you’re an HCP in a non-medical practice, you may be tempted to say to yourself, “Well, sure that’s possible for them—they’re physicians.” However, what if I told you that medical practices in this study earned more than 3.5 times the referrals and 3.5 times the revenue, but they also spent 2 times as much on marketing to physicians?

Table 2. Patient referral sources versus revenue and market spend.
Suddenly this changes things. Some non-medical practitioners think that physician referrals magically flow to ENTs and other medical HCPs by nature of them being “in the medical field.” While networking and other relationship marketing certainly have their roles, this is not always the case. Here, the data clearly shows the power of physician marketing and presents a compelling reason why more of the marketing budget needs to be allocated to this very important referral group.
Remember, you don’t need to be a physician to succeed in physician and disease-state marketing—you just need to do it. According to our survey, only 21% of respondents admit to being knowledgeable about the 2011 Affordable Care Act (ACA). This is a missed opportunity! In addition to new Medicare guidelines, HCPs must, as Brian Taylor and Bob Tysoe point out,4 “educate to obligate.” For HCPs to stay competitive, more emphasis needs to be placed on co-morbidity and disease-state marketing.
Finding 3: Patient referrals accounted for 22% of mean total revenue—with virtually no marketing budget.
Why should I care? As seen in Table 2, patient referrals in non-medical practices make up the lion’s share (26%) of total revenue for survey respondents. Medical practices were not far behind, with 22% of their total revenue coming from patient referrals, respectively. While these numbers are relatively close, both groups shared a more similar statistic: less than 1% of their total marketing budget was spent on patient referrals. Consider that this was the #1 referral source for non-medical practices, and the #2 source for medical practices.
So is this good news or bad? Some HCPs may read this and marvel at the outstanding cost per lead that comes from patient referrals. However, there is a different view. Imagine if practices allocated just 5% or 10% of their marketing budget to patient referrals? Think about how much more potential business could be had.
Existing patients are the proverbial low-hanging fruit. There’s simply no excuse not to spend money on fueling this crucial engine of practice growth. If you’ve already maxed out your marketing budget, perhaps it’s time to re-examine your marketing allocations—which brings us to our last finding.
Finding 4. Nearly half (48%) of a marketing budget is spent on traditional marketing—which accounted for only 15% of new patient referrals.
Why should I care? There’s a place for traditional marketing practices such as print advertising in newspapers, direct mail pieces, and even the Yellow Pages. But when nearly half of an entire marketing budget yields less than one-sixth of new referrals, it is time to question whether your traditional marketing tactics are really working. In last year’s PBS, the average spend on traditional marketing was nearly identical. When asked about future allocations, participants planned to spend 10% less on traditional marketing. Clearly, this was not the case with this year’s sample.
Marketing is essential to growing your practice. However, using your marketing dollars effectively is equally important. To compete, practices must first take a hard look at what they’re spending their money on, and then measure and evaluate each ad placement and every campaign for their effectiveness.
In Table 2, observe that non-medical practices spent 8% of their marketing budget on events which yielded 7% of total revenue. This is nearly a 1:1 return on investment.
Digital marketing/social media also plays an important role. We now know that 59% of adults ages 65+ go online, with 79% going online daily. Social media use in the US has increased by 356% since 2006.5,6 While digital marketing may seem daunting, many small agencies can help guide your practice through online options and cost-effective tactics.
Noteworthy and Actionable
Absent from this paper was discussion surrounding the average sales price (ASP) of instruments. The data we collected showed a sharp decline in ASPs. It should be noted, that other surveys7 and most industry analysts cite a recent trend of annual 1-2% declines in ASPs, which have served to dampen the 2-4% gains in hearing aid unit volume sales. However, we omitted discussion of ASPs in this survey because we strongly suspect that the sharp decline was due to our not separating income from third-party referral sources, such as insurance companies, AARP, HearingPlanet, etc. We plan to adjust our survey questionnaire to account for this in our next PBS.
The above brings up a very hot topic: unbundling—the itemization of your services and products. The influx of third-party referrals and payers into the market has now made unbundling an essential business practice. This results in fitting fees and other sources of revenue that don’t involve the purchase of a hearing aid.
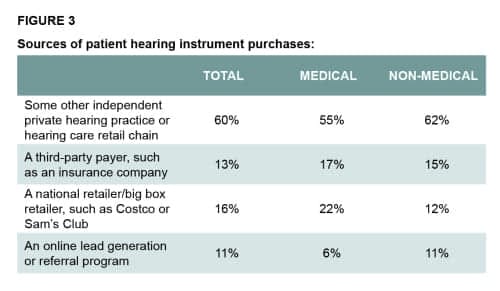
Table 3. The source of purchase for new patients who were already owners of hearing aids.
Data from our previous PBS showed that revenue from third-party payers accounted for 8% of new business, and that number grew to 13% in our most recent survey. This trend is likely to continue. HCPs need to examine their strategy for dealing with third-party payers and develop an action plan to maximize these referral sources. The choice is no longer whether to unbundle, but rather how.
How to compete with retail chains and Big Box stores is another hot topic that only seems to be getting hotter by the day. Nearly 60% of survey respondents felt that large retail/Big Box chains were considered a major threat to their business. While the threat to independent practices cannot be disputed, it’s interesting to note that, by far, the greatest percentage of patients seen who already had hearing instruments purchased them from another independent private hearing care practice (Table 3).
Part of staying competitive means making smart decisions based on your data. It’s often a matter of focusing more effort on programs that drive business (eg, patient, physician referrals, and disease-state marketing) and spending your marketing budget wisely.
Today’s market is survival of the fittest. In the end, practices that take time to analyze their business and ask themselves “Why should I care?” are the ones that will most often win.
Research Demographics
Demographic highlights include:
- 33% of respondents have owned or worked at their practice for 11+ years, 54% for 3 to 10 years, and 12% for 2 years or fewer.
- 55% are audiologists and 43% hearing instrument specialists (HIS). Of the audiologists, 40% have an AuD, 30% are masters-level degreed audiologists; 2% are MDs, and 2% are PhDs.
- 42% of practices received their dispensing license more than 20 years ago.
- 30% consist of one location, and 70% have multiple locations (full or part-time).
- Of the 261 total office locations, most (63%) are open full-time and 37% are part-time. 94% of the part-time locations are part of multiple-location operations.
- Full-time locations are open an average of 38 hours each week, and part-time only locations an average of 17 hours each week.
- 15% of locations are in urban areas of populations greater than 500,000, 28% in urban areas under 500,000, 35% in suburban areas, and 22% in rural areas.
- All medical practices (medical institutions/physician offices) have full-time HCPs, and 44% have part-time HCPs.
- All private/retail practices have full-time HCPs, and 32% have part-time HCPs.
- Among private/retail practices, 77% have an audiologist, 40% a HIS, and 3% an assistant
- Among medical practices, 85% have an audiologist, 21% a HIS, and 21% an assistant.
- 61% of private/retail practices have non-dispensing employees, and 75% of medical practices have non-dispensing employees.
A Word of Caution
Throughout the paper, we compare data with previous years in an effort to identify trends and draw conclusions. While the findings of this PBS tend to align with other industry trends,7-9 it’s important to remember that the data reported is merely the result of the respondents of the survey. As we know, it’s extremely difficult (and sometimes impossible) to conduct a survey that results in an exact apples-to-apples sample. Every effort was made during the fielding of the survey to ensure the data gathered would yield as accurate a comparison as possible.
Noteworthy differences in this year’s sample compared to last year’s include:
- An additional 59 practices participating in the survey;
- 31% increase in practices with multiple locations;
- 21% increase in HCPs from physician offices (non-hospital), and
- 18% decrease in HCPs who have worked at practice for 11+ years.
The increase in total number of participating practices may be due to a natural maturation process that surveys tend to experience. Now in its third year, our PBS has grown in awareness and gained legitimacy among HCPs.
The rise in number of practices with multiple locations could be attributed to what we warned against a year ago—survival of the fittest. While the market has certainly improved, it has also taken its toll. Combined with the effects of vertical integration, this could indicate that the most successful practices are prospering and multiplying while the weaker ones are either losing market share or closing.7-9
So what about the increase in number of physician offices or the fact that 18% fewer HCPs with 11+ years of experience participated? This doesn’t suggest HCPs are gravitating toward the medical field any more than a decrease in length of service suggests practitioners are retiring, or that younger HCPs are flooding in. Rather, as what often happens in any survey, this is simply a result of the sample.
In this era of increased competition, shrinking ASPs, higher cost-of-goods due to higher technology mix, and squeezed margins, owners of hearing healthcare practices need to pay more attention than ever to their business efficiency, sources of new patients, marketing spend, and strategies regarding third-party payers. Overall, this PBS shows there are ample opportunities for growing a hearing healthcare business for those HCPs who are willing to analyze the data and ask more profound questions than “Why should I care?”
References
-
Gleitman R. How data from a practice benchmark study can help hearing practices compete—and win: Turning industry benchmarks into action points for your practice. Hearing Review. 2014;21(7):14-17. Available at: https://hearingreview.com/2014/06/data-practice-benchmark-study-can-help-hearing-practices-compete-win
-
Strom KE. Hearing aid sales increase by 4.8% in 2014; RICs continue market domination. Hearing Review. 2015;22(3)[Mar]:6. Available at: https://hearingreview.com/2015/01/hearing-aid-sales-increase-4-8-2014-rics-continue-market-domination
-
Abrams HB, Kihm J. An Introduction to MarkeTrak IX: A New Baseline for the Hearing Aid Market. Hearing Review. 2015;22(6):16. Available at: https://hearingreview.com/2015/05/introduction-marketrak-ix-new-baseline-hearing-aid-market
-
Taylor B, Tysoe B. Forming strategic alliances with primary care medicine: interventional audiology in practice: How to leverage peer-reviewed health science to build a physician referral base. Hearing Review. 2014; 21(7):22-27. Available at: https://hearingreview.com/2014/06/forming-strategic-alliances-primary-care-medicine-interventional-audiology-practice
-
Pew Research Center. Internet use over time. June 11, 2015. Available at: http://www.pewinternet.org/data-trend/internet-use/internet-use-over-time.
-
US social media use has increased by 356% since 2006. Netpop Research. 2012; April.
-
Phonak Market Research Department. 2013 survey of US dispensing practice metrics, Part 1. Hearing Review. 2013;19(12):24-33. Available at: https://hearingreview.com/2014/01/2013-survey-of-us-dispensing-practice-metrics
-
Phonak Market Research Department. 2013 survey of US dispensing practice metrics, Part 2. Hearing Review. 2014;20(1):32-41.
-
Strom KE. HR 2013 dispenser survey: Dispensing in the age of internet and big box retailers. Hearing Review. 2014;21(4):22-28. Available at: https://hearingreview.com/2014/04/hr-2013-hearing-aid-dispenser-survey-dispensing-age-internet-big-box-retailers-comparison-present-past-key-business-indicators-dispensing-offices

Correspondence can be addressed to: [email protected]
Original citation for this article: Gleitman, R. Your Business and Practice Benchmarking. Hearing Review. 2015;22(8):18.?