June 2020 online feature
May was tough, but the month signaled a business turn-around. June looks stronger still.
By Karl Strom, editor
Hearing healthcare practices made good progress toward recovery in May and look to do significantly better in June, according to results from The Hearing Review’s Covid-19 Impact Survey #3, which was conducted from May 13-22, 2020 (just prior to the US Memorial Day holiday weekend).
HR’s Covid-19 Impact Survey #1 and #2 looked at the hearing aid dispensing market during March and April, respectively. To review, on March 18, the CDC warned people ages 60+ not to engage in non-essential medical care, and by that time state and local governments were already closing schools, restaurants, and warning citizens to begin “social distancing.” By the weekend of March 21-22, the situation for dispensing businesses was becoming grim. Not surprisingly, Hearing Review’s Covid-19 Impact Survey #1, conducted between March 19-24, produced a wide range of responses from hearing care professionals (HCPs) as the situation rapidly deteriorated. Essentially, the first survey showed that, by the week of March 23, practice owners realized they were facing dire business conditions.
In the subsequent HR Covid-19 Impact Survey #2, conducted from April 9-17, responses from HCPs suggested a mostly closed-for-business status during that time: fewer than one-third of private and retail practices were physically seeing patients, and almost two-thirds of all dispensing offices predicted they would experience a 90% or greater decrease in gross revenues during April.
However, Survey #2 also suggested May would mark the start of the recovery, as government Covid-19 health mandates and restrictions eased. The present survey confirms this, and points toward June (all things considered) as a relatively robust turn-around for audiology and hearing aid dispensing businesses.
Survey #3 Results
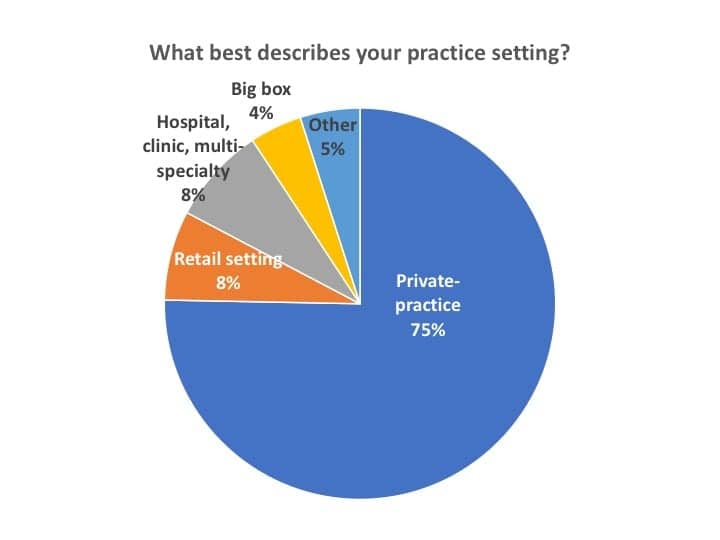
Respondents. A total of 179 hearing care professionals responded to Survey #3 during the 10-day period from May 13-22. Of these responses, 162 were dispensing professionals from the US and Canada, and 137 of which were involved in private practice and retail (PP&R) settings (83%), as shown in Figure 1. Other respondents’ work settings included hospital, clinics, and multi-speciality (including ENT) offices (8%), Big box and mass merchandisers (4%), and other practices like university clinics, etc (5%). Canadian offices made up 3% of survey responses.
Editor’s note: Because the Covid-19 pandemic appears to have hit private practice and retail (PP&R) offices disproportionately hard—and these offices constitute 83% of this survey’s respondents (and HR’s core readership)—I will focus primarily on this segment. In almost all cases, except where noted, the statistics for the total dispensing professionals (ie, including hospitals/clinics, big box, ENT offices, etc) were generally within 3% of those of PP&R offices. Readers interested in the “all dispenser” figures may contact the editor for more detailed data.
Staffing and Patient Visits
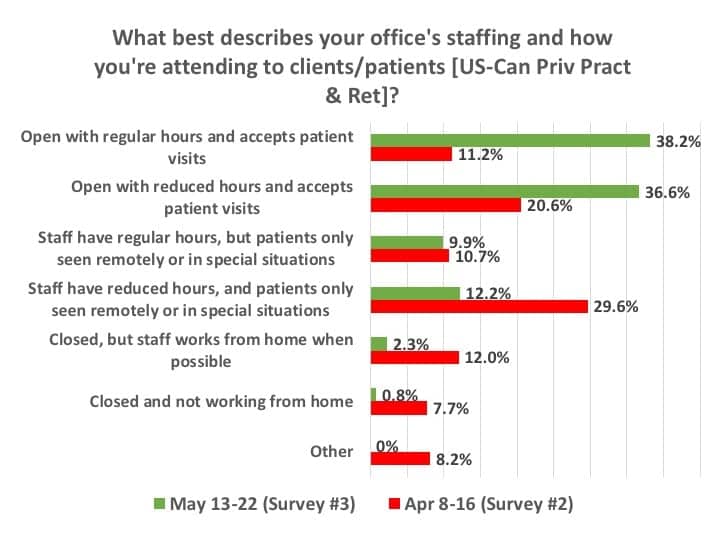
As shown in Figure 2, when asked in mid-May what best described their office staffing and the attending to patients/clients, three-quarters (74.8%) of respondents who worked in US and Canadian PP&R settings said they were accepting patient visits, with an even split between those offices observing regular operational hours (38.2%) and those with scaled back or reduced staffing (36.6%). This is a marked contrast from April, when less an one-third (31.8%) of practices were actually seeing patients, and the rest were only seeing patients remotely or in special circumstances (40.3%), or were closed altogether (27.9%). When asked in mid-May about the overall open/closed status of their office for the remainder of the month (Figure 3), 41% said they would retain usual hours for the office and staff, 46% said they would observe scaled-back office hours and/or staffing, 9% said they would remain closed in May, while 4% said they would be closed for 1-2 weeks.

Of the quarter (24.7%) of survey participants who responded to a question asking why they were not seeing patients, the most common reasons were state and local mandates (40%), safety concerns about patient (31%) and employee (12%) health, and “other” write-in considerations (11%) which were primarily comprised of a combination of these. Only 4% cited professional organization recommendations and 2% financial reasons (eg, not enough patients).
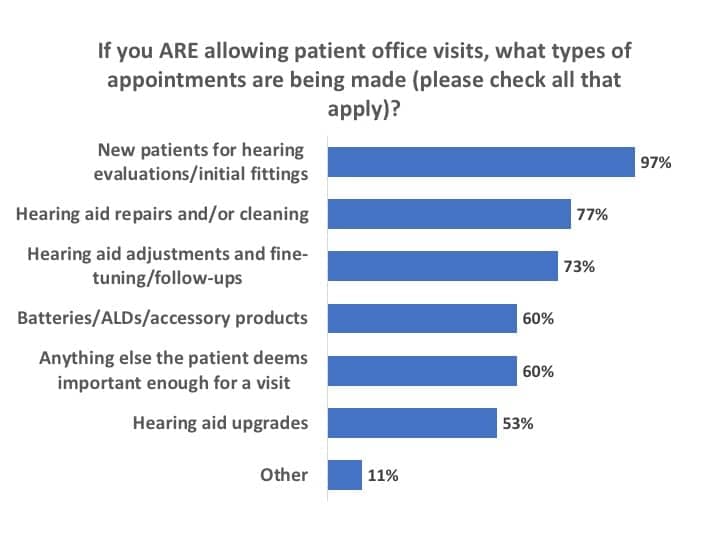
Of those three-quarters of PP&R offices seeing patients in mid-May, the majority (60%) were essentially accepting appointments for anything their patients deemed important enough for an office visit (Figure 4). Almost all (97%) indicated they were making appointments for new patients’ audiological evaluations and initial fittings, while about three-quarters were seeing patients for hearing aid repairs/cleaning (77%), hearing aid adjustments and follow-ups (73%), as well as batteries, ALDs, and accessory products (60%).

When doing so, nearly all were practicing enhanced infection control (Figure 5). While the vast majority indicated using masks and/or faceshields (87%), wiping down any surface a patient might touch with disinfectant (87%), and limiting the number of patients in the office/waiting room (84%), a sizable percentage of dispensing professionals also entered in the “other” option of the questionnaire that they were “adhering to CDC guidelines” or similar protocols for infection control and protection of visiting patients (ie, adding to many of the percentages shown in Figure 5).
Hearing Aid Sales, Revenues, and Financial Status of Practices
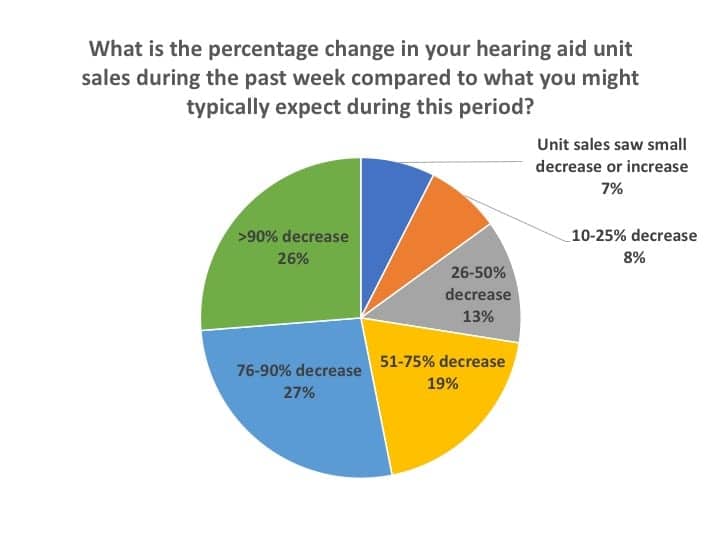
Despite the good news relative to the opening of more dispensing practices, the Covid-19 pandemic still had a large negative impact on revenues during the May 13-22 time-frame of the survey. Figure 6 shows answers to the question, “What is the percentage change in your hearing aid unit sales during the past week compared to what you might typically expect during this period?” More than one-half (53%) of respondents said that either their hearing aid unit sales had decreased by over 90% (26%) or by 76-90% (27%). Another one-fifth (19%) of respondents said that their hearing aid unit sales were 51-75% below normal, while just over one-quarter (28%) said their sales had decreased by half or less.
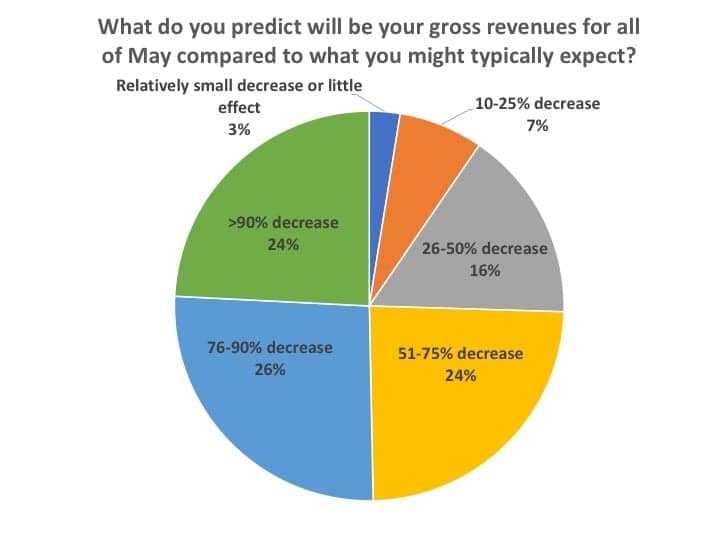
When asked to predict what their May gross revenues would be in comparison to “what you might typically expect” during that month, the answers followed roughly the same pattern as hearing aid sales, except slightly better (Figure 7). About one-quarter each said they’d experience a gross revenue shortfall of over 90%, 76-90%, or 51-75%. About one-in-seven (16%) said their revenues would be decreased by 26-50%, while 10% predicted a revenue decline of less than 25%. Recall that Survey #2 in April indicated many respondents were pursuing alternate cash-generating avenues that didn’t necessarily depend on personal visits, ranging from reprogramming aids remotely via teleaudiology to contacting current customers to inquire about their need for batteries, upgrades and repairs, etc, which could help explain the differential between Figures 6 and 7.
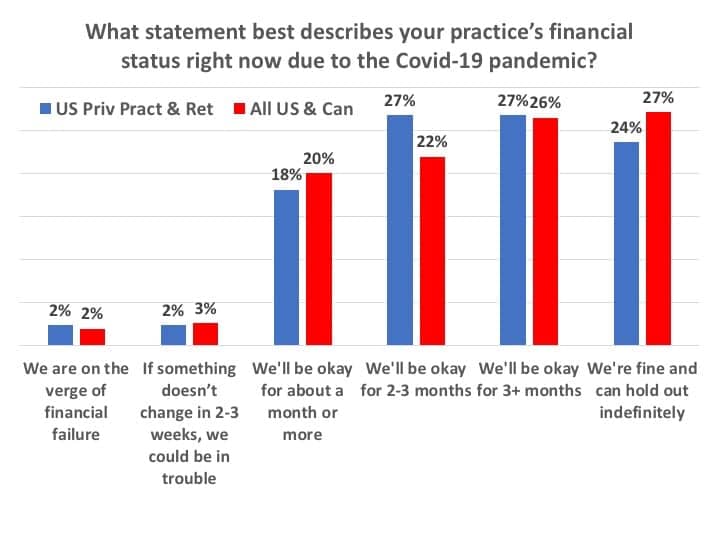
Given these drastic reductions in gross revenues, what was the financial status of the respondents’ offices and practices? When asked this question, only 5% of all US and Canada HCPs appeared to be in real financial peril—reporting their businesses were on the verge of financial failure (2%) or in trouble “if something doesn’t change” (3%) in June (Figure 8). Another one-fifth (20%) of all dispensing offices said they’d be okay for about a month or more. In contrast, three-quarters (75%) of all US and Canadian offices indicated they would “be okay” financially, with about half (48%) feeling confident of their financial solvency for 2-3+ months, and over a quarter (27%) reporting they would be able to “hold out indefinitely.” Figure 8 also includes responses for only US PP&R practices, which one might interpret as having only a slightly less-positive financial status.
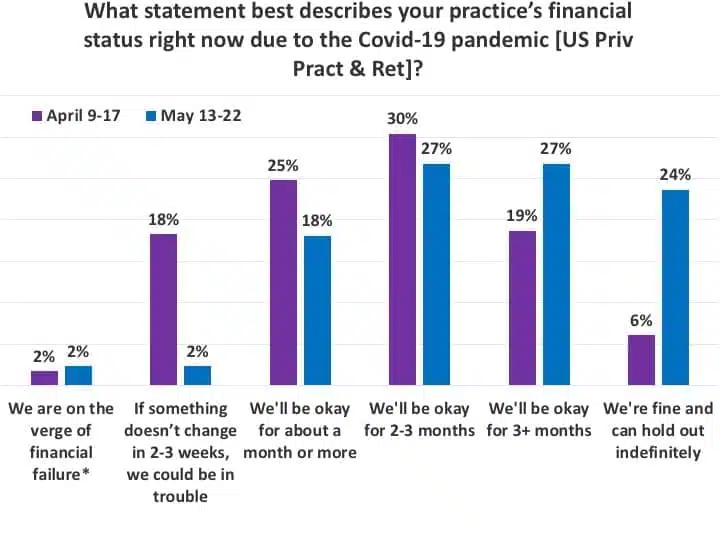
While Figure 8 still provides reason for concern—particularly given that 5% of respondents said their businesses were in imminent financial danger and about 1 in 5 noted they might be only “okay for about a month or more”—the responses to this question in the present survey were far better than those found in April’s Survey #2 (Figure 9). In particular, when comparing US PP&R responses for April and May, more than half (51%) of respondents in May said they would be “okay for 3 months or more” or “indefinitely” compared to only one-quarter (25%) of respondents in April. Moreover, Figure 9 shows that fewer than 1-in-20 HCPs (4%) in May said their practices were either on the verge of financial failure or could be in trouble within 2-3 weeks, whereas 1-in-5 practices (20%) reported this status in our April survey.
Tactics for Business Survival during the Pandemic
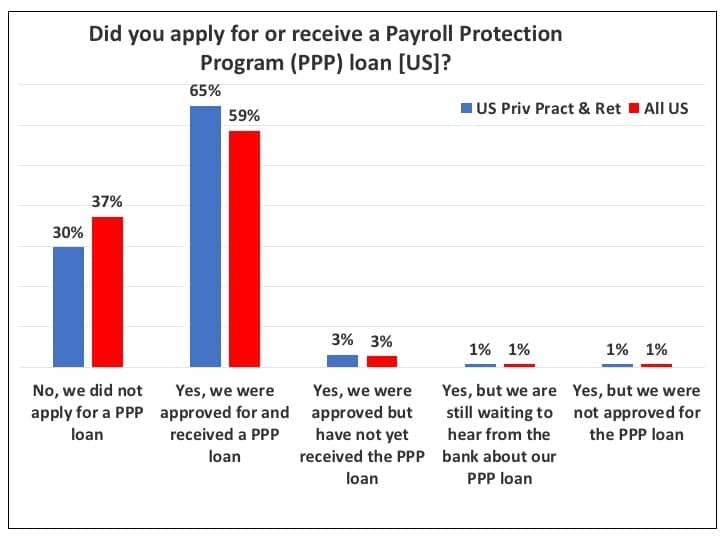
For many US PP&R hearing care businesses, the Payroll Protection Program (PPP) loan has been a significant factor in surviving the pandemic’s financial effects. Figure 10 indicates that about 70% of US PP&R offices applied for the PPP loan and about 65% ended up receiving it at the time of the May 13-22 survey. Only about 5% had either not yet received the loan when the Survey #3 was administered (3%), were still waiting to hear from their bank about the status of their loan (1%), or had been turned down for the loan (1%). Predictably, when looking at all US responses—including big box and mass merchandisers, hospitals, and other dispensing offices that may not have been eligible for the loan—the total percentage that had applied for and received the PPP loan was less, with 59% applying for it.
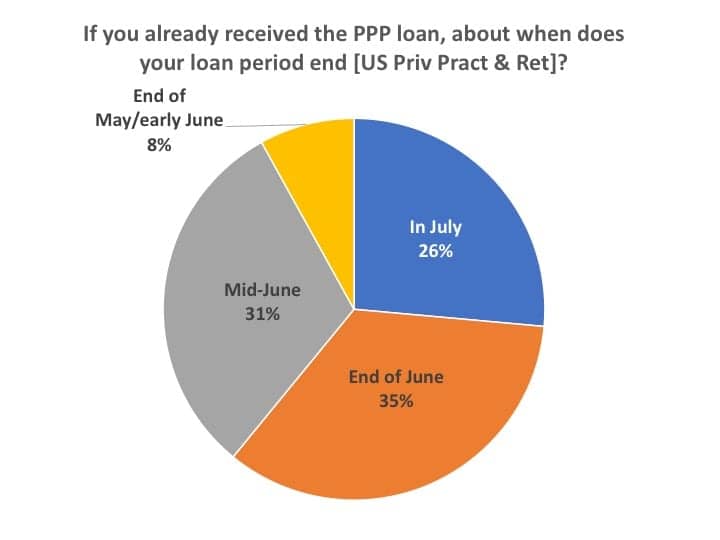
Figure 11 shows that the largest percentage of these PPP loans will terminate at the end of June (35%), although almost equal percentages of the loans will expire in mid-June (31%) and in July (26%).
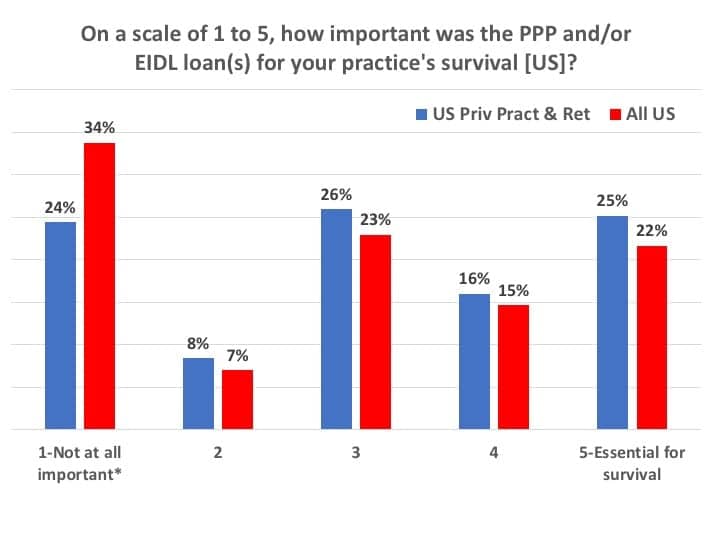
When asked to rate the PPP and Economic Injury Disaster Loan (EIDL) programs’ importance to the survival of their practices on a “1 to 5” scale (Figure 12), more than two-thirds (67%) of PP&R dispensers rated it as a “3” or more (ie, important to essential). One out of four practices (25%) rated the loans as “5-essential for survival.” It’s interesting to note that, in the April Survey #2, about 6 out of 7 (85%) US PP&R offices had considered these loans as being important to essential (ie, a 3-5 rating), with 35% rating them as “essential for survival”—perhaps because things appeared quite a bit more desperate at that time. (*Editor’s note: It was obvious that several survey participants, including those working in big box and hospital settings, skipped this question or indicated it wasn’t applicable because their offices didn’t use the PPP/EIDL loan program; thus, these were tallied within the category “not at all important.”)
Hearing care businesses used many methods for extending cash flow besides the PPP loan to get through April and May. When considering all survey respondents, the most common tactics were dipping into the business reserve funds (46%), the owner taking a pay cut or not paying her/himself (40%), using credit cards to free up or extend payments (22%), and the owner lending money to the business (20%). More than one-third (36%) of PP&L respondents in April’s Survey #2 said they had applied for or received an EIDL loan, but far fewer (17%) in the May survey indicated that the EIDL loan had been important means extending cash flow (possibly because the EIDL loan may be seen by practice owners as working capital while the PPP loan is more for extending cash flow via payroll assistance).
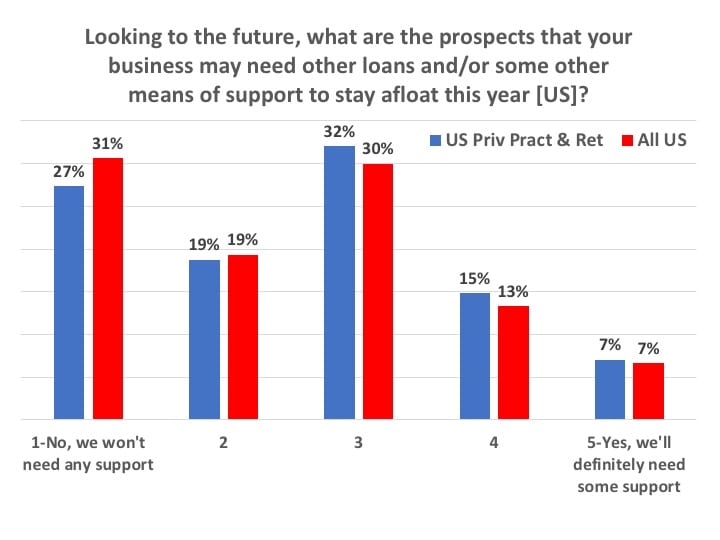
So, given the above, did respondents in May think they might need more loans and/or some other means of support to stay afloat for the remainder of 2020? When asked this question, the most common response by those working in US practices was a tentative “no” (Figure 13). Half (50%) of all US practices responded with a 1 or 2 rating, meaning “No, we won’t need any support” or leaning that way, while only one-fifth (20%) responded with a 4 or 5 rating, meaning “Yes, we’ll definitely need some support” or leaning that way. That left 30% of respondents firmly in the middle, where they may or may not need more support by year’s end.
Predictions for June
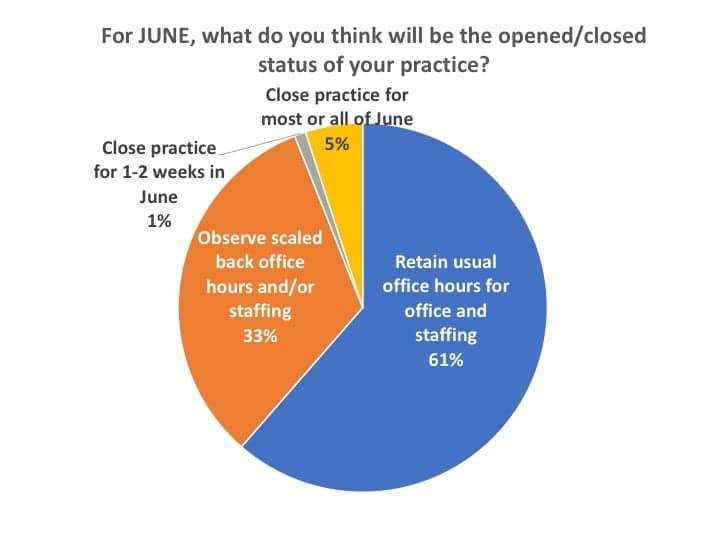
When US survey participants were asked if their dispensing office would be open or closed in June (Figure 14), almost all (94%) said they planned to retain usual office hours and staffing (61%) or observe scaled back office hours and/or staffing (33%). Only 5% said they anticipated their practice to be closed and 1% said they thought they would be closed 1-2 weeks in June (these were mostly big box and mass merchandisers, hospitals, university clinics, etc).
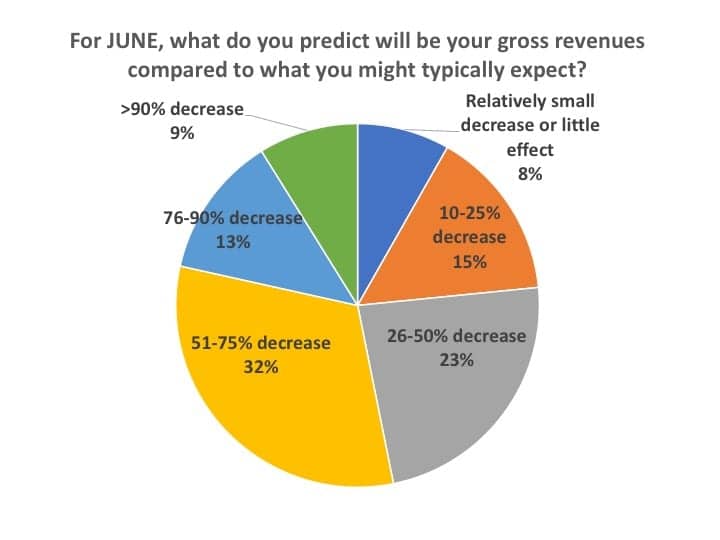
When asked to predict their practice’s gross revenues in June (Figure 15), just under half (46%) of respondents expected their revenues to be 50% or better than what they’d expect for a typical June: 23% said they expected a gross revenue decrease of 26-50%, 15% a decrease of 10-25%, with 8% a relatively small decrease or little difference from typical June revenues. However, the largest percentage (32%) of HCPs forecasted their gross revenues would still remain off by 51-75%, while 13% predicted a 76-90% decrease, and 9% predicted a revenue decrease worse than 90% (ie, essentially a closed office).
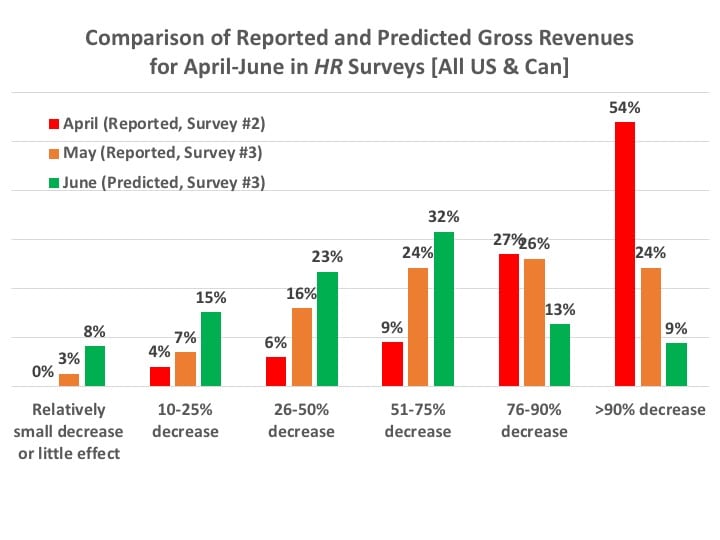
Of course, in ordinary times, these data would seem like terrible news and make one gasp for air. However, in today’s context, when comparing the above statistics with those of Figures 6 and 7—showing recovery from a near-financial market shutdown in March-April to the defibrillation of business witnessed in May—one can be forgiven for looking at this with some relief. When you add to these the June predictions for gross revenues (Figure 16), you get some solid proof for a relatively robust recovery. As noted in a previous editorial,3 all you really have to do is look at the last column in Figure 16—which essentially shows those US and Canadian practices that were fully shut down—to see that only 9% of practices still expect the worst in June. Again, I’ll emphasize this is not good for ordinary times, but these are no ordinary times.
The hearing healthcare market is jolting itself back to life. And rather quickly.
Use of Telehealth during the Covid-19 Pandemic
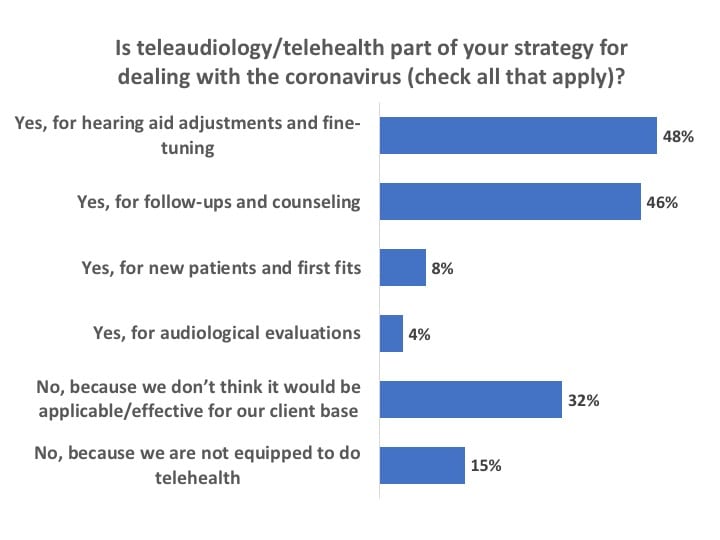
If you’re really searching for any silver lining to the pandemic in hearing healthcare, two obvious items could be: 1) a greater awareness of and adherence to infection control, and 2) the accelerated use of teleaudiology in practice protocols. Prior to the pandemic, the general consensus within the industry was that, although about 25% of dispensing professionals may have downloaded teleaudiology software for hearing aid programming, testing, and other patient services, less than 5% probably used telecare with any regularity. However, as the coronavirus drove a wedge between HCPs and their patients, telecare options from manufacturers exploded and teleaudiology use definitely did increase (Figure 17). Almost half of all survey respondents reported that their practices were using teleaudiology for hearing aid adjustments and fine-tuning (48%) and for follow-ups and counseling (46%).
I would love to be able to leave the story here and conclude that teleaudiology use is booming, and telecare has become an important, permanent tool in the dispensing armamentarium. This is because, in my (and others’) opinion, teleaudiology should play an essential future role in increasing practice efficiencies, while broadening access and professional service offerings for consumers (particularly in the upcoming age of over-the-counter devices).
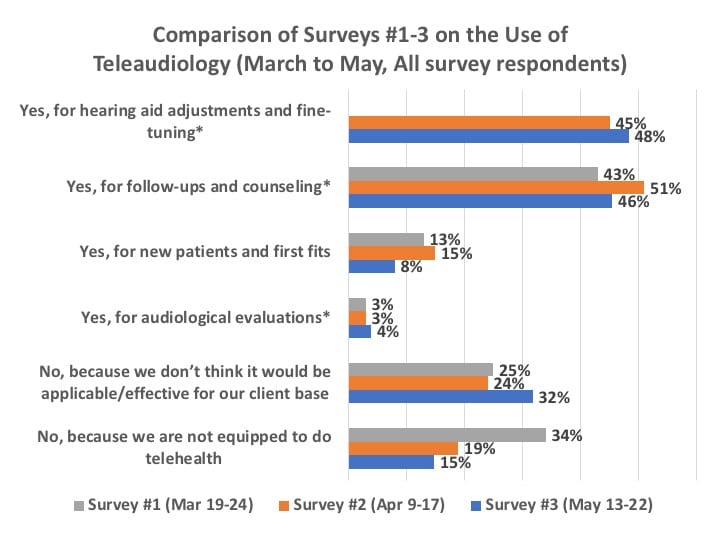
However, Figures 18 and 19 paint a more complex picture. Figure 18 confirms that, in general, the use of teleaudiology for hearing aid adjustment and fine-tuning, as well as patient follow-up, has grown. However, even with the impressive new teleaudiology fitting software introductions by hearing aid manufacturers in the last several months, the technology’s use actually regressed for new patients and first fits (8% of respondents in May from 13% and 15% in March and April). Obviously, this may have occurred because it was becoming possible in May to see patients again, as state and local mandates loosened; still, one would have hoped to see these numbers hold fast or even continue to rise. The good news is that, for HCPs who said they were not using teleaudiology, only 15% said it was because they were not equipped to do so—showing recognition that much of this equipment is readily available. However, this good news is somewhat counterbalanced by the growing one-third (32%) of HCPs who thought teleaudiology wasn’t applicable or effective for their client base. (*Editor’s note: Survey #1 provided only a response for using teleaudiology for “follow-ups,” while Surveys #2 and #3 asked slightly more refined questions that included hearing aid fine-tuning/adjustment and audiological evaluations.)
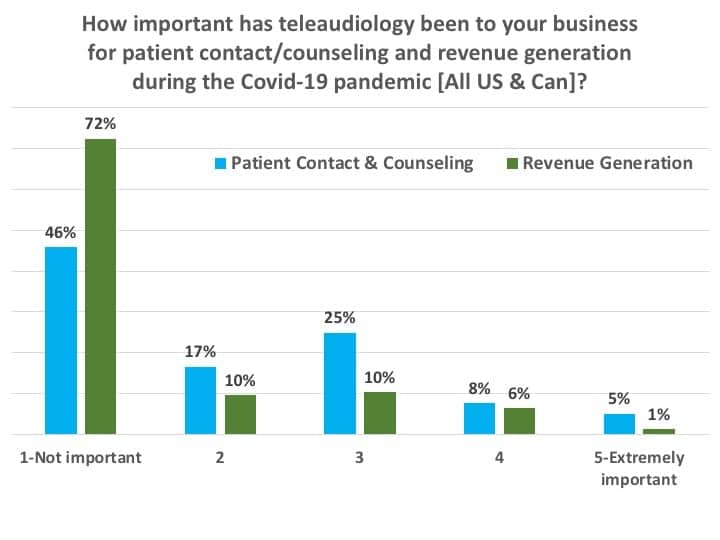
Figure 19 summarizes results from two separate questions: 1) “On a scale of 1 to 5, how important has teleaudiology been to your business for patient contact/counseling during the Covid-19 pandemic?” and 2) “On a scale of 1 to 5, how important has teleaudiology been to your business for revenue generation during the Covid-19 pandemic?” A total of 38% of HCPs rated teleaudiology important to extremely important (ie, a 3-5 rating) for patient contact and counseling, while 17% rated it similarly important for revenue generation. It should be noted these aren’t “bad” numbers; certainly, the pandemic has placed a spotlight on the utility of teleaudiology. However, it also appears teleaudiology still has plenty of room to grow within the profession of hearing healthcare.
Key Findings
For the period from May 13-22, this survey found:
- Three-quarters (74.8%) of respondents who worked in US and Canadian private practice and retail (PP&R) settings said they were physically seeing patients (Figure 2), with an even split between those offices observing regular operational hours (38.2%) and those with scaled back or reduced staffing (36.6%). When predicting their June opened/closed status (Figure 14), almost all US respondents (94%) said they planned to retain usual office hours and staffing (61%) or observe scaled back office hours and/or staffing (33%). Only 5% predicted they would be closed.
- The financial status of many practices improved significantly in May. Fewer than 1-in-20 HCPs (4%) in May said their practices were either on the verge of financial failure or could be in trouble within 2-3 weeks, whereas 1-in-5 practices (20%) reported this level of financial trouble in our April survey (Figure 9).
- 70% of US PP&R practices applied for the Payroll Protection Program (PPP) loan and about 65% ended up receiving it at the time of the May 13-22 survey. The majority (61%) of these loans will expire around the end of June or in July, and 25% of all PP&R respondents deemed the PPP and Economic Injury Disaster Loan (EIDL) programs as having been essential for financial survival.
- Close to half (46%) of survey respondents predicted their practices would see gross revenues of 50% or better compared to a typical June (Figure 15), although nearly one-third (32%) were still predicting a sales shortfall in the neighborhood of 51-75%.
- Teleaudiology is being used extensively by dispensing professionals, with nearly half of all survey respondents saying they have used it for follow-ups and counseling or for hearing aid adjustments and fine-tuning. However, in terms of actual importance and revenue generation, the survey suggests teleaudiology still has great room to grow.
References
- Strom KE. Hearing Review coronavirus impact survey results (March 19-24). March 25, 2020. Available at: https://hearingreview.com/practice-building/practice-management/management-strategies/hearing-review-coronavirus- impact-survey-results-march-19-23
- Strom KE. Results of the Covid-19 impact Survey #2 (April 9-17) for hearing healthcare practices. April 22, 2020. Available at: https://hearingreview.com/practice-building/marketing/surveys-statistics/results-of-covid-19-impact-survey-2-april-8-16-for-hearing-healthcare-practices
- Strom KE. Better times ahead. Hearing Review. 2020;27(6):6. Available at: https://hearingreview.com/inside-hearing/blogs/hearing-healthcare

Karl Strom is editor of The Hearing Review and as been reporting on hearing healthcare issues for over 25 years.
Correspondence can be addressed to: [email protected]