Digital signal processing (DSP) technology has had 15 years to evolve within the hearing instrument industry. We have reached the point where creative new algorithm features are being released as often as every 6 months. Historic hardware limitations, such as high battery consumption and limited processing power, no longer completely define the boundaries of what is possible. Hearing instruments are more often differentiated on the basis of software algorithms rather than hardware platforms. Thus, the algorithms that a manufacturer designs today to differentiate its products are dictated more by the company’s philosophy than by technological restrictions.
One could argue that there is little evidence that individual differences in features yield measurable performance effects.1-3 However, it may also be true that the whole of a hearing instrument is greater than the sum of its features. That whole is what is determined by the fitting philosophy of its developers. Thus, if the developer’s design philosophy can effect performance improvements, then hearing aids based on widely different design philosophies should demonstrate discernable differences in performance.
However, if the philosophy is merely an extension of a series of features that have little real impact, then by extension the sum of the features should not generate performance differences. In that case, hearing instruments based on widely different philosophies will not demonstrate discernable differences in performance.

|
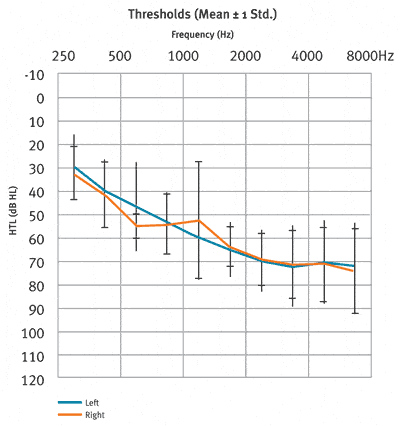
| FIGURE 1. Mean hearing threshold levels (HTL) of the 12 subjects in the study. |
In the following study, we compared several aspects of the performance and perceived satisfaction of hearing aids from three manufacturers having different design philosophies. We chose to evaluate the top-of-the-line premium product offerings from each company as it is the premium products that offer the most features. Being fully featured, they provide the greatest opportunity for differentiation and the most obvious manifestation of design philosophy.
Study Design
Subjects and methods. We fitted 12 experienced hearing aid wearers—6 BTE and 6 ITE wearers—with three sets of hearing instruments (one from each manufacturer) having the same shell styles as their own aids. The subjects were typical hearing instrument wearers with symmetric sensorineural hearing loss (SNHL) ranging in age from 38 to 86 years with a mean age of 71. Figure 1 shows their mean hearing threshold levels (HTL) with a ±1 standard deviation. All testing was completed at the International Center for Hearing and Speech Research at Rochester Institute of Technology.
An effort was made to replicate typical clinical fittings for the three sets of aids as closely as possible. Therefore, all of the hearing instruments were initially fitted according to each manufacturer’s preferred settings using their own fitting software. Subjects were instructed on the care and use of each instrument set and were provided with manufacturer-specific user manuals. Table 1 highlights the distinctive features of each manufacturer’s hearing instruments (Instruments A, B, C).

|
| TABLE 1. Summary of features of the three hearing aid systems examined in this study. |
The fitting philosophies of the three types of hearing instruments can be described as follows.
- Instrument A is a traditional fully automatic premium product. There are some adaptive features that automatically engage/disengaging in different listening environments. However, the fitter can make adjustments only to a single base program destination in the automatic mode. There is no self-learning behavior and no user-adjustable controls such as a VC.
- Instrument B relies on wireless connectivity. Some adaptive features use information from both aids to model performance changes. There is one adjustable base destination as in instrument A. However, there is self-learning for the user-adjustable VC and compression ratios.
- Instrument C is configurable by both the fitter and the wearer of the device. The fitter may fully configure four listening destinations within the automatic program. The wearer can personalize adaptive features in each of four destinations and teach the instruments their desired settings using the remote control. The hearing aid learns user preferences for the VC and adaptive feature settings.
The participants wore each set of hearing aids for 3 weeks in randomized order, completing speech perception tests and questionnaires at the end of each trial based on final settings, whether learned or quick fit. At the completion of each 3-week trial, the aids were returned and replaced with the next set until all testing was completed with each aid.
Results
Participants were asked to rank order the three sets of hearing instruments from their highest (first) preference to the lowest (third). Figure 2 shows their rankings.
The fully automatic devices were least preferred by 9 of 12 participants. The wireless and configurable instruments were evenly split between first and second choices for 10.5 participants. The fractions of participants arose when some people felt that two instruments were tied. One person said Instruments A and B were equal and ranked first. Another said they were equal and ranked third.

|
| FIGURE 2. Subjects rank order the three sets of hearing instruments from their highest (first) preference to their lowest (third). |

|
| FIGURE 3. Mean values and the range of values assigned to each set of instruments. |
At the end of each 3-week trial, the participants were asked several questions regarding the hearing instruments they had just tried. They were asked, “Given the value of your own aids, please estimate the value of the current hearing aids.” Figure 3 shows the mean values and the range of values assigned to each set of instruments.
Participants were also asked to “Rate the overall performance of these hearing aids” on a 1-10 scale. The rating scale they used is shown on the left-hand side of Figure 4. Next we asked them to “Indicate your overall satisfaction with these hearing aids” (Figure 5).

|
| FIGURE 4. Subjects’ range of responses to the question, “Rate the overall performance of these hearing aids on a 1-10 scale.” Rating scale is shown on the y-axis, and the “x” indicates the mean response. |

|
| FIGURE 5. Range of responses relative to the subjects’ overall satisfaction with the three hearing instruments, where the “x” indicates the mean response. |
Speech reception thresholds were obtained for phrases from the Coordinate Response Measure (CRM) corpus4 in three conditions:
- Quiet listening;
- Speech plus co-located 4-talker babble (both at 0º azimuth); and
- Speech (0º azimuth) plus spatially separated 4-talker babble (180º azimuth).
The mean SRTs and the mean +1 Std are shown in Figure 6.

|
| FIGURE 6. Mean speech reception thresholds obtained for phrases from the CRM corpus4 in three conditions: quiet listening, speech plus colocated 4-talker babble (both at 0º azimuth), and speech (0º azimuth) plus spatially separated 4-talker babble (180º azimuth). |
Naturally, thresholds are lower (better) in quiet than when there is no audible noise floor present. Thus, the Quiet SRTs are much lower than the co-located speech and babble (front) or spatially separated speech and babble (back) for all three hearing aids.
There were no significant differences in speech reception thresholds between any hearing aids in the Quiet condition or for Signal-to-Noise Ratios (SNR) in the Front Noise condition. Overall, the Back Noise thresholds are better than the Front Noise thresholds due to spatial release from masking and the effects of directional microphones. In the Back Noise condition (Figure 6), the thresholds for Instrument C were significantly better than those for Instruments A and B (P <0.0001). This highly significant improvement in noise was also clinically relevant. The SNR benefit for Instrument C over Instrument B was 4.1 dB, and Instrument C was also 4.8 dB better with noise from behind the participant than Instrument A.
Summary

|
|
Myths that Discourage Improvements in Hearing Aid Design, by Mead C. Killion, PhD. Jan 2004 HR. Fitting Tips: Essentials of Hearing Aid Selection, Part 1: Cosmetics Are Not Just What Meets the Ear, by Joel M. Mynders, BC-HIS. Oct 2003 HR. |
In this study we compared the performance and perceived benefit of three premium hearing instruments from different manufacturers. Even though all three are top-of-the-line premium products, there were large differences in perceived performance and satisfaction. The fully automatic Instrument A was consistently given significantly poorer ratings in every category. For overall rankings, Instrument B (wireless connectivity) and Instrument C (user configurable) were almost interchangeable. Furthermore, the mean estimates of performance and satisfaction were equivalent. However, the configurable aid was given higher value ratings over the other two and never received a low rating from any participant in any category.
Tests of speech reception indicated that all three aids performed equally in quiet and co-located noise, but the configurable aid outperformed the other two by a wide margin when presented with spatially separated noise.
In conclusion, it is clear that these devices, which are based on widely different design philosophies, also demonstrate considerable differences in performance that hearing-impaired listeners can discern. Although, in most cases, all of the hearing instruments shown provide acceptable-to-exceptional results as judged by consumers, there is a perceivable difference; hearing aids are not all designed equally.
This article suggests that the whole is greater than the sum of the features, and design philosophy can dictate the success of a product.
Acknowledgement
Research for this study was sponsored by Unitron Hearing Ltd, Plymouth, Minn.
References
- Preves D. Hearing aids and listening in noise. Sem Hear. 2000;21(2):103-22.
- Haskell GB, Noffsinger D, Larson VD, et al. Subjective measures of hearing aid benefit in the NIDCD/VA Clinical Trial. Ear Hear. 2002;23(4): 301-7.
- Cord M, Baskent D, Kalluri S, Moore BC. Disparity between clinical assessment and real-world performance of hearing aids. Hearing Review. 2007;8(7):22-6.
- Bolia RS, Nelson WT, Ericson MA, et al. A speech corpus for multitalker communications research. J Acoust Soc Am. 2000;107:1065-6.
Citation for this article:
Hayes D, Eddins DA. Comparison of Three Premium Products: Does Design Philosophy Matter? Hearing Review. 2008;15(13):24-30.