
|
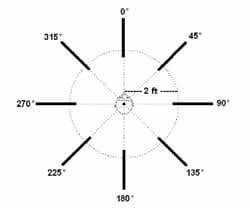
| FIGURE 1. The R-SPACE recording system. Eight highly directional microphones capture sounds from all horizontal directions, 2 feet from the listening position. |
With the advent of effective directional microphones in hearing aids came a need for effective tools for evaluating the real-world performance of these devices. Field trials relying on self-report by end-users can be costly and time-consuming, potentially impeding the development of new and better products. Performance trials conducted in laboratories, if shown to yield results that accurately reflect real-world performance, can offer far greater efficiency and cost-effectiveness compared to field trials.
Toward meeting the need for an accurate laboratory test environment, Revitronix and Etymotic Research collaborated in the development of the R-SPACE™ (patents pending) research sound system. This system has been shown to provide accurate simulations of real-world acoustic environments, while offering the advantages of efficiency, control, and repeatability found only in a laboratory.
This article will review the development of the system, will describe how the system works, and will present data from two studies that showed that speech intelligibility results obtained in the system are very similar to those obtained in actual noisy environments.

|
| FIGURE 2. The R-SPACE playback system. Eight loudspeakers in a laboratory array complete the “natural” paths of sounds recorded earlier in an actual environment. |
The System
The complete R-SPACE system consists of two equipment sets: one for recording and one for playback.
Figure 1 illustrates the recording system. Eight highly directional, interference-tube microphones are set in a circular array, pointing outward at every 45° angle around the circle, with 0° as a front-center reference. The pickup points of the microphones are 2 feet from the center of the array. In this way, environmental sounds are picked up from all horizontal directions “on their way” to the listening position. These direction-dependent environmental sounds are recorded on eight separate tracks of a digital recording system so that they can later be played back in the laboratory.
Figure 2 illustrates the R-SPACE playback system. The direction-dependent sounds that were recorded earlier in a real environment are allowed to complete their “natural” paths to the listener, but in a different time and place (ie, in the laboratory).
Why eight loudspeakers at a 2-foot radius? The development of the R-SPACE system targeted three specific goals:
- The simulated environments should sound real;
- The simulated environments should allow directional hearing aids and the hearing mechanism to perform in the lab as they do in the real world; and
- A formal study1 was to confirm that lab results on speech intelligibility accurately predicted real-world results over a wide range of directional solutions.

|
| FIGURE 3. Setup at the “dessert party” recordings at Etymotic Research, used for “realism” trials. Note that the radius of the recording array was smaller than the 2-foot radius as depicted in Figure 1, the latter of which has been used since. For the dessert-party setup, we had overlooked that the diaphragms of the shotgun microphones were actually near the back, rather than at the front, of the shotgun microphone tubes. |
Goal #1 was satisfied in two stages: We first conducted informal listening tests, and then a formal experimental study to confirm the results of the listening tests.
Robert Schulein, Etymotic Research’s lead R-SPACE project engineer, determined from the initial, informal listening tests that a four-loudspeaker playback system could not create the desired level of realism, especially for sounds coming from the sides. Additionally, calculations by Julstrom2 demonstrated that four loudspeakers could not be expected to fulfill Goal #2 with accuracy for directional microphones worn on the head, especially when allowing for minor head rotation during listening. Julstrom’s calculations did, however, indicate that eight loudspeakers could be expected to fulfill Goal #2 with the desired degree of accuracy.2
A further consideration of Goal #2 was to allow for consistent results from one laboratory site to another, and so the arrangement of the loudspeakers should be chosen to minimize the influence of the acoustics of the particular playback environment. This meant that the loudspeakers had to be as close to the listener as possible, without creating substantial proximity or head-shadow effects.

|
| FIGURE 4a-b. R-SPACE playback setups, after the Etymotic Research dessert party for “realism” listening trials. “Normal” (4a) and “Anechoic” (4b) playback rooms were tested. |
Subsequently, an eight-point system with a 2-foot radius was adopted for formal trials. Later evidence reported by Nilsson et al3 showed that across-lab results for a loudspeaker array with a 1-meter radius could yield inconsistent results across test sites. That report attributed across-laboratory inconsistencies to varied acoustic conditions in the various laboratories tested.
Listening Trial of the System
Having chosen the configuration of the recording and playback arrays, we conducted a formal listening trial. The sounds of a “dessert party” were recorded in the lunchroom at Etymotic Research, simultaneously through a prototype R-SPACE recording array and a KEMAR that was fitted with binaural hearing aid microphones, as shown in Figure 3. Following the initial recordings of the dessert party, the KEMAR was then placed in a prototype R-SPACE loudspeaker array, in two types of rooms: “normal” and “anechoic” (Figures 4a and 4b, respectively).
The eight-track, “simulated” lunchroom environment was presented through the R-SPACE loudspeakers in both playback rooms, where it was then re-recorded through the same KEMAR-worn binaural hearing aid microphones as for the original party. Additional playback conditions (“normal” room only) included a “stereo” setup (two separated frontal loudspeakers), a “monaural” setup (one loudspeaker at the right ear), and a simulated “telephone” setup (same as “monaural,” but using a 300-3000 Hz filtered bandwidth). The subjects, who listened to samples of the binaural recordings made at the actual party and in the various simulation conditions, were the same people who had been present at the dessert party.

|
| FIGURE 5. “Realism” trials using binaural KEMAR dessert party recordings. “Absolute” ratings refer to subjects’ memories of what it actually sounded like at the dessert party. “Comparative” ratings refer to A-B-A comparisons where “A” was always the binaural recording made “Live” at the dessert party, and “B” was the test condition. Note that in the “Live” A-B-A comparison (dark bar, far right), all three snippets were exactly the same. (Tel=Telephone; Mono=Monauraul; Ster=Stereo; RSRm=R-SPACE Room; RSAn=R-SPACE Anechoic) |
The data are summarized in Figure 5. For the data labeled “Absolute” realism, subjects were asked the question: “To what extent do the sounds you hear sound like what you remember from being at the party?” The data labeled “Comparative” realism were obtained using A-B-A comparisons for which the “A” sample was always the binaural recording made at the actual party and the “B” sample was either from the actual party again (“Live”) or from one of the simulation conditions. Subjects were asked: “To what extent does snippet B sound like snippet A?” The results (Figure 5) indicated an acceptable level of perceived realism for the R-SPACE system, in both “normal room” and “anechoic” playback conditions.
Is It Live or Is It R-SPACE? Restaurant Recordings and Validation
After completing the formal listening tests described above, approximately 5 years had passed since the early discussions of what has become the R-SPACE system. The prototype of the system, depicted in Figures 1 and 2, showed considerable promise based on the informal and formal listening tests.

|
| FIGURE 6. (click to enlarge)Schematic diagram of restaurant recordings and subsequent validation study (see Compton-Conley et al1). |
Environmental recordings. Environmental recordings for future use in R-SPACE-equipped laboratories were critical. Simultaneously, recordings were to be made for a formal validation study that was to become the doctoral dissertation of one of this paper’s co-authors, Cynthia Compton-Conley.4 The general plan was to administer, via insert earphones, a modified HINT procedure5 to normal-hearing subjects, for which the interfering noise consisted of binaural KEMAR recordings made in an actual noisy restaurant and in various “traditional” clinical settings. A diagram of the complete project is shown in Figure 6 (for complete details, see the papers by Compton-Conley1,4).
The first step was to make two sets of simultaneous recordings in a noisy restaurant (Lou Malnati’s, near Etymotic Research in Elk Grove Village, Ill). Figure 7 shows pictures of the setting up for calibration and the actual recording session in the restaurant. One set of restaurant recordings was made via the R-SPACE recording system, which had been placed in the middle of the restaurant dining room, essentially replacing one table (see “Signal Recording” in Figure 6, upper left). Each of the eight interference-tube microphones fed a separate track of a digital audio recorder.

|
| FIGURE 7a-b.Setting up for calibration (7a) and the actual breakfast recording session (7b) at Lou Malnati’s Restaurant. The KEMAR was wearing three sets of binaural hearing-aid microphones, and was encircled by the R-SPACE recording microphone setup. |
“Live” noise condition. The other simultaneous set of recordings was made using a KEMAR placed at the center of the R-SPACE microphone array. The KEMAR was wearing three binaural pairs of hearing aid microphones: omnidirectional, super-cardioid directional, and ultra-directional array—which fed an additional six tracks of the digital audio recorder. A 15th digital audio track was recorded simultaneously using an omnidirectional sound-field microphone that was suspended 6 inches above the top of the KEMAR’s head, for calibration purposes. Approximately 55 minutes of continuous restaurant din was recorded in this fashion. The binaural KEMAR recordings served as the “Live” noise condition in the validation study.
R-SPACE noise condition. The next step was to make a set of binaural KEMAR recordings in the R-SPACE playback system (see center left “Signal Recording” in Figure 6). The eight tracks that had been captured in the restaurant via the R-SPACE recording system were fed to the eight loudspeakers at respective positions in the R-SPACE playback system, which was located in the same room used for the earlier listening trials (Figure 4a). The KEMAR at the center of the loudspeaker array wore the same binaural hearing aid microphones as in the restaurant. Also, as in the restaurant, an omnidirectional sound-field microphone was suspended 6 inches above the KEMAR’s head for calibration purposes. In this fashion, an additional seven tracks of digital audio were recorded in the R-SPACE playback system, reproducing the original 55 minutes of restaurant noise. The new binaural KEMAR recordings served as the R-SPACE noise condition in the validation study.

|
| FIGURE 8.Results from the initial validation trials (Compton-Conley et al1). Modified HINT scores across microphone conditions in the R-SPACE playback system were statistically indistinguishable from the scores in the “Live” condition. Scores in the IAC conditions had significant differences from those in the “Live” condition. |
Target speech materials. The final recording stage (see lower left “Signal Recording” in Figure 6) was to make three sets of binaural KEMAR recordings in a large IAC sound booth (12’L x 9.4’W x 7.5′ H). The same setup of binaural and sound-field calibration microphones as used in the earlier two stages created seven new digital audio tracks per recording condition in the IAC booth. One set of recordings was of the sentences from the HINT CD, presented from 2 feet away at 0° (the same relative location of the front-center loudspeaker of the R-SPACE playback system). This set of binaural KEMAR recordings was to provide the target speech materials for the validation study.
IAC 90° and IAC 180° noise conditions. The other two sets of IAC booth recordings captured playback of the din that had been recorded from 6 inches above the KEMAR’s head in the restaurant via the omnidirectional sound-field mic. For one set, the omnidirectional restaurant track was played through a single overhead loudspeaker 2 feet from the KEMAR’s ears. For the other set, the omnidirectional restaurant track was played through a single loudspeaker 2 feet directly behind the KEMAR’s ears. These final two sets of binaural KEMAR recordings were to provide the IAC 90° and IAC 180° noise conditions in the validation study, respectively.

|
| FIGURE 9.Setup for recordings for “Live” (lunchroom) phase of the second validation study. |
Recordings of directional microphone conditions. The final stimuli for the validation trials consisted of four tracks played from a digital audio multitrack recorder (see “Signal Delivery” on the right side of Figure 6, page 57). Two tracks consisted of the HINT sentences, recorded binaurally from 0° in the IAC booth, and the other two tracks consisted of restaurant noise, recorded binaurally either in the actual restaurant (“Live”), in the R-SPACE playback system, in the IAC booth from 90°, or in the IAC booth from 180°. Sets of four-track sentence recordings with the four noise conditions were made for each of the three binaural hearing aid microphone conditions: omnidirectional (Omni), directional (DMic), and ultra-directional (Array).
Modified HINT. A modified adaptive HINT procedure was used in the study. Each pair of binaural HINT sentence tracks and binaural restaurant noise tracks were routed to two separate 2-channel audiometers. The outputs of the two audiometers were routed to a mixer, and its “stereo” earphone-amplifier output fed a pair of ER4B field-corrected insert earphones. The nominal presentation level for the restaurant noise was set for 75 dB SPL (as measured with the earphones attached to a 2cc coupler).

|
| FIGURE 10.During the lunchroom party, co-author Killion reads IEEE sentences at progressive sound-pressure levels, as monitored via a modified sound-level meter. |
With this setup, the sentence levels could be controlled adaptively by adjusting the left and right attenuators of one of the audiometers to arrive at the signal-to-noise ratio (SNR) required for subjects’ getting all words in sentences correct 50% of the time.
Trial results. Subjects were 12 normal-hearing listeners. The results of the trials are summarized in Figure 8. In essence, the scores for the modified HINT procedure across microphone conditions in the R-SPACE playback system were statistically indistinguishable from the scores in the “Live” condition. The scores for the two IAC conditions had significant differences from those in the “Live” condition.
The reader should keep in mind that these results were for normal-hearing listeners, and for microphone conditions that represented a wide range of directivity indexes: 0.3, 4.2, and 7.7 DI (on KEMAR). A subsequent study revealed similar results for hearing-impaired listeners, and for a much narrower range of directivity indexes.

|
| FIGURE 11.Mean audiograms for the 15 hearingimpaired subjects in the lunchroom (live) part of the second validation study. |
New Validation Data
Although the original validation study described above was robust in its design and implementation, the scope of the study was somewhat limited; it used normal-hearing subjects and a wide range of directivity indexes. We weren’t quite ready to recommend to the world that performance trials in actual “live” environments were no longer necessary. We felt there was still a need to corroborate the earlier results with a new set of trials involving both “live” and “R-SPACE” conditions, using subjects with impaired hearing, and across a narrower range of directivity indexes.
This corroboration came serendipitously. A manufacturer of directional hearing aids had advertised an unusually large “directional benefit” for one of its products, as observed under laboratory measurement conditions. We set out to evaluate the performance of that product in “real-world” listening conditions. Although an extension of the R-SPACE validation wasn’t part of that study from the outset, in the end that product performance evaluation provided the corroboration of the accuracy of the R-SPACE system we were looking for.

|
| FIGURE 12.Results for the lunchroom (live) part of the second validation study. Speech-in-noise performance was poorest for the omnidirectional hearing aids and best for the CC-MICs. The results for the experimental adaptive directional hearing aids fell in between the former. |
The study consisted of “live” and “R-SPACE” speech-in-noise tests for the experimental hearing aids in omnidirectional and adaptive directional modes. A third condition used CC-MIC hypercardioid (free field) directional microphones. The “live” testing took place at yet another party in the lunchroom at Etymotic Research, this time actually serving lunch.
Using a multitrack digital audio recording system, speech-in-noise tests were recorded in real-time at the party. These tests used a modified form of the QuickSIN.6 With the actual QuickSIN, the target sentences are held at a more-or-less constant level, while the background noise rises in steps as the test progresses. In the modified form, the din of the lunch party was kept at an approximately constant level, as monitored by a “captain” at each table who viewed a projected display of a ceiling-mounted sound-level meter (Figure 9). One of the authors (Killion) read lists of sentences7 at progressively higher signal levels, as monitored via a headworn boom mic connected to a separate, modified sound-level meter (Figure 10). The sentence talker (Killion) was positioned approximately 2 feet from the KEMAR. In this way, lists of sentences that were spoken “live” in background noise could later be arranged into QuickSIN-like tests having SNRs that progressed downward in approximately equal steps.

|
| FIGURE 13.Results from the R-SPACE part of the second validation study. As for the lunchroom (live) part of the study, speech-in-noise performance was poorest for the omnidirectional hearing aids and best for the CCMICs, with the results for the experimental adaptive directional hearing aids falling centrally in between. |
Six tracks were recorded via three binaural pairs of hearing aid microphones on a KEMAR. Two tracks were from the test ITE hearing aids in the omnidirectional mode, two tracks were from the test ITE hearing aids in the adaptive directional mode, and two tracks were from CC-MICs mounted onto the surface of the KEMAR’s head, near the ears. The hearing aid output signals were recorded via a Zwislocki coupler, and the CC-MIC signals were recorded directly via a custom-built preamplifier. A seventh track was recorded from a mini-shotgun microphone just in front of the sentence talker (Figure 10, page 59) for speech-level calibration purposes. An eighth track was recorded from an omnidirectional sound-field microphone near the (drop) ceiling of the lunchroom (Figure 9, page 59) for noise calibration purposes.
After the “live” recordings of speech-in-noise tests were completed for each hearing aid and CC-MIC condition, compact discs (CDs) were created for presentation to subjects listening through ER3A earphones. The actual SNRs achieved for each sentence during the live recordings were measured post hoc and were taken into account in the resulting data. The data collection, taken individually for left and right ears, was done by Ruth Bentler, PhD, at the University of Iowa. Figure 11 shows the mean audiograms for the 15 hearing-impaired subjects. Figure 12 shows the results.

|
| FIGURE 14.Summary of the second validation results, for subjects with hearing impairment (lunchroom) or simulated hearing impairment (R-SPACE). The diagonal line that traces the R-SPACE results has been redrawn against the lunchroom results to show the degree of difference between the data for the two conditions. |
As Figure 12 shows, the level of performance of the experimental adaptive directional hearing aids in the lunchroom setting fell between the levels of performance of the omnidirectional hearing aids and the CC-MICs. Specifically, the mean SNRs needed for subjects to correctly repeat 50% of the key words in the IEEE sentences lined up as follows:
Highest: Omnidirectional
Middle: Experimental adaptive directional
Lowest: CC-MIC
The lower the score, the better the “directional benefit.” The range of performance for these hearing-impaired subjects, after collapsing the data for left and right ears, spanned about 3.7 dB from lowest to highest, with the scores for the experimental device falling about midway between those for the other two devices.
More Simulations
Concurrent with, but separate from, the data collection for the “live” phase of the study, similar data were collected substituting the R-SPACE simulation of the restaurant breakfast (Figure 7b) for the Etymotic lunch party (Figure 9). Other differences from the “live” phase were:

|
| TABLE 1.Speech-in-noise data (in dB) for Lunchroom (“live”) versus R-SPACE phases of the second validation study. Lunchroom subjects were hearing-impaired, and the experimental directional aids were ITEs. R-SPACE subjects were normal-hearing with simulated hearing impairment, and the experimental directional aids were BTEs. |
- A speech-in-noise test developed for the R-SPACE system, called “PDQ-SIN,”8 was used instead of the modified QuickSIN described earlier;
- The experimental hearing aids were BTEs instead of ITEs, but containing the same adaptive directional technology;
- Subjects (n = 12) had normal-hearing, but were given “simulated” hearing losses by brickwall filtering the test materials above 2400 Hz; and
- Subjects listened through ER4B earphones, instead of ER3A earphones.
Otherwise, the conditions and methods were identical to the “live” phase of the study. Figure 13 shows the results. In this case, the data (collected by Mary Meskan, PhD) were reported in terms of “SNR-Loss,” rather than SNR-50. The two measures are very much the same. They both observe the SNR for 50% correct, except that the SNR-Loss unit is given relative to a presumed “normal” SNR-50, similar to the way dB HL is given relative to a reference threshold earphone SPL.
The range of the scores for the R-SPACE phase was slightly greater than that for the “live” phase: 4.6 dB as opposed to 3.7 dB. The lineup of the scores, however, was nearly identical to that of the “live” results—the scores of the experimental directional device falling centrally between the scores for the other two devices. As seen in Figure 14, the speech-in-noise results for the real-world vs R-SPACE conditions were very similar.

|
| TABLE 2.Summary of the two validation studies: Compton-Conley et al1 and current study. The results are seen in Figures 8 and 14, respectively. |
Table 1 summarizes the data for the two phases of the study. Given the differences in test conditions and reporting methods for the two phases, the numbers that are of particular interest are the across-device differences, “live” vs R-SPACE. As Table 1 shows, the range of comparative “error” (R-SPACE vs lunchroom) was 0.3 to 0.9 dB. The highest error (0.9 dB) was for the CC-MIC vs Omni comparison.
Table 2 summarizes the conditions of the first and second validation studies. Given the complexity of the method of preparation of the lunchroom recordings, and in light of the precise accuracy shown in the earlier validation results, it could be argued that the current R-SPACE data may even be more predictive of true real-world performance than are the current real-world data (although both data sets once again showed very similar results)!

|
| Myths About Hearing in Noise and Directional Microphones by Mead C. Killion, PhD.
Interpreting the Directivity Index by Andrew Dittberner, PhD, and Ruth Bentler, PhD. Adaptive Directional Microphone Technology and Hearing Aids: Theoretical and Clinical Implications by David A. Fabry, PhD. Is Real-World Directional Benefit Predictable? by Francis Kuk, PhD, Denise Keenan, MA, and Carl Ludvigsen, MS. How to Measure and Demonstrate Four Key Digital Hearing Aid Performance Features, Part 1 and Part 2 by David J. Smriga, MA. |
Conclusions
A research sound system has been developed, which has been shown to provide accurate speech-in-noise data compared to real-world conditions, for a wide range of directional solutions, with high resolution regarding directivity index. It is hoped that this system can provide a standard for institutional laboratories and manufacturers, so that they can arrive at valid real-world data in an efficient manner and so that such data can be compared directly across laboratories.
Currently, three hearing-aid research labs, and one lab concerned with voice-recognition devices for computers, have installed R-SPACE systems. In addition to relevance to conventional hearing aid research, recent interest has developed in the application of directional microphone technology to cochlear implants. So far, two cochlear implant sites in the United States have installed R-SPACE systems for their ongoing research.
A secondary long-term goal is to distill and economize the research system into an accurate system designed for clinics and dispensaries, so that clients can experience the benefit of new hearing instruments during the fitting process.
Acknowledgments
Robert Schulein, RBS Consultants, Schaumburg, Ill, contributed many of the essential design features for the development of the R-SPACE system. Ruth Bentler, PhD, University of Iowa, Iowa City, contributed the data for the lunchroom portion of the second validation study. Mary Meskan, PhD, Meskan Consulting, Des Plaines, Ill, contributed the data for the R-SPACE portion of the second validation study.
This article was submitted to HR by Lawrence J. Revit, president of Revitronix, Braintree, Vt; Mead C. Killion, PhD, president of Etymotic Research, Elk Grove Village, Ill; and Cynthia L. Compton-Conley, PhD, professor and director of the Assistive Device Center at Gallaudet University, Washington, DC. Correspondence can be addressed to [email protected] or Lawrence J. Revit, Revitronix, 60 Murphy Road, Braintree, VT 05060; e-mail: .
References
- Compton-Conley CL, Neuman AC, Killion MC, Levitt H. Performance of directional microphones for hearing aids: real-world versus simulation. J Am Acad Audiol. 2004;15:440–455.
- Revit LJ, Schulein RB, Julstrom S. Toward accurate assessment of real-world hearing aid benefit. Hearing Review. 2002;9(8):34-38,51.
- Nilsson M, Ghent RM, Bray V, Harris R. Development of a test environment to evaluate performance of modern hearing aid features. J Am Acad Audiol. 2005;16:27-41.
- Compton CL. The validation of a sound field simulator for measurement of the real world performance of directional microphones for hearing aids. Dissertation Abstracts International; 2002.
- Nilsson MJ, Soli SD, Sullivan JA. Development of the Hearing In Noise Test for the measurement of speech reception thresholds in quiet and in noise. J Acoust Soc Am. 1994;95:1085–1099.
- Killion MC, Niquette PA, Gudmundsen GI, Revit LJ, Banerjee S. Development of a quick speech-in-noise test for measuring signal-to-noise ratio loss in normal-hearing and hearing-impaired listeners. J Acoust Soc Am. 2004;116(4):2395-405.
- Institute of Electrical and Electronics Engineers. IEEE recommended practice for speech quality measurements. Appendix C. Boulder, Colo: Global Engineering Documents; 1969.
- Christensen LA, Helmink D, Soede W, Killion MC. Complaints about hearing in noise: a new answer. Hearing Review. 2002;9(6):34-36.