Business Management | March 2021 Hearing Review
Medicare beneficiary demographics and utilization/payment for audiologic procedures
By Ian Windmill, PhD, and Barry Freeman, PhD
The purpose of this 14-year review of Medicare data is to inform budgetary or productivity decisions within hearing care practices and support initiatives related to payments at the state or federal level. While reimbursement for audiologic procedures has changed over the past 14 years, payments have been relatively stable since 2013. The absolute number of patients referred for audiologic services has increased, but the proportion of referrals has not changed over the past 12 years, with Medicare beneficiaries receiving air/bone conduction SRT, word recognition, and tympanometry. Diagnostic testing was conducted less than 20% of the time and tinnitus evaluations less than 1% of the time on the Medicare population. The stability of Medicare payments allows practitioners to predict revenues in upcoming years and provides a benchmark for judging payments from other third parties. The majority of Medicare beneficiaries receive hearing evaluations but not diagnostic assessments.
There will be no shortage of persons with hearing loss or vestibular disorders in the foreseeable future. Consider the aging population and the increased number of newborns needing services,1 and the links between hearing loss and comorbid conditions.2-9 These factors suggest that services for hearing loss, tinnitus, and vestibular disorders will continue to increase in future decades. Even with the emergence of new treatment options, such as gene therapy for hearing loss, individuals will still need to be tested, monitored, counseled, and advised on their care pathway.
A key to the future success of hearing care providers will be the ability to respond to the increased demand in an efficient and cost-effective manner without compromising patient care. A review of the past decade’s Medicare data from the Centers for Medicare and Medicaid Services (CMS)10,11 offers insights important to responding to the demands associated with the aging population and their hearing and balance related concerns. Every year CMS releases data on payments, procedures codes, and the demographics of patients served by individual providers. The public can access these databases that include such information as average charge per procedure by individual provider, the amount reimbursed per procedure per provider, the number/type of procedures each provider performs, and the comorbidities of patients seen by each provider.
The focus of this article is on the demographics of Medicare beneficiaries seen by audiologists, and the payments for commonly used assessment procedures. The purpose of this review is to increase awareness for budgetary, productivity, and patient outcome decisions within hearing care practices as they pertain to audiologic procedures.
The CMS data provides guidance to ensure audiologists respond to changes in healthcare and achieve the best outcomes for patients. CMS is seeking Value Based Care9: those providers who offer the best return on investment when diagnosing, managing and treating beneficiaries with medically necessary conditions. CMS prioritizes Value Based Care (VBC) where providers:
- Adhere to clinical best practices with a focus on wellness and prevention.
- Offer proactive, preventative, and efficient care.
- Manage people’s wellness, instead of treating hearing and balance disorders as they occur.
- Identify hearing and balance risk, as well as manage and treat existing disorders associated with hearing loss or balance disorders.
We’d like to emphasize this review of data comes with the several important considerations and caveats detailed in the sidebar “Parameters of this Review” (found at the end of the online version). In particular, it only includes data from the traditional Medicare program and does not include data from Medicare Advantage programs which now make up about 33% of all Medicare beneficiaries. Additionally, due to the way CMS gathers and/or reports data, there may be some important omissions and discrepancies if one is looking at specific procedures or various segments of audiology practices, as noted in the sidebar below.
Demographics of Medicare Beneficiaries
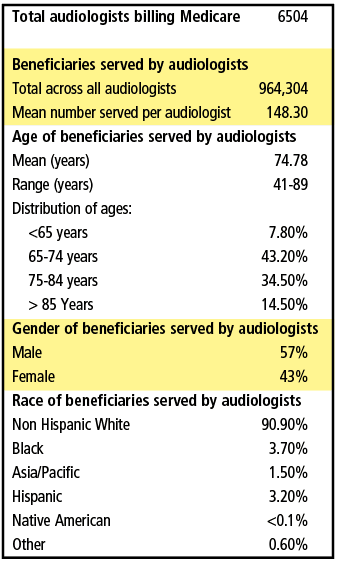
A snapshot of the demographics for Medicare beneficiaries served by audiologists in 2017 is shown in Table 1. There were 6504 audiologists that provided services to 964,304 Medicare beneficiaries that year, with the mean number of beneficiaries served per audiologist of about 150 annually. The mean age of the beneficiaries seen by audiologists is about 75 years with about 78% of the beneficiaries between the ages of 65 and 84 years old. There were a higher proportion of males served, and the vast majority (91%) were non-Hispanic white people.
Table 2 shows the number of Medicare beneficiaries who were referred for an audiologic evaluation from 2007 through 2018. Since 2007, the number of referrals has increased about 15% from 1.18M to about 1.35M. However, the percentage of annual referrals has remained relatively stable at around 3.3-3.5% per year for all eligible Medicare beneficiaries. Given the 6540 audiologists who billed more than 10 Medicare beneficiaries in 2017, and assuming this same number of audiologists provided care every year since 2007, this would indicate a net increase of 2.47 patients per year per audiologist.
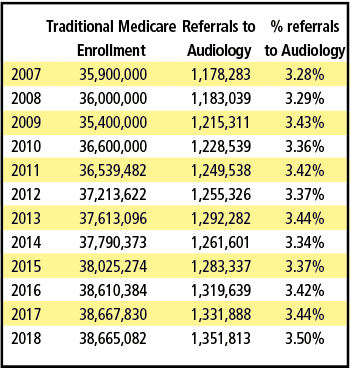
These numbers are a disappointment considering the decade-long efforts by audiologists to promote services to primary care physicians coupled with Medicare’s Annual Wellness Visit that includes “hearing screening and fall risk.” Despite these efforts to generate more referrals, and better hearing and balance care, the percentage of beneficiaries referred to audiologists has not changed substantially.
Payments for Audiologic Procedures
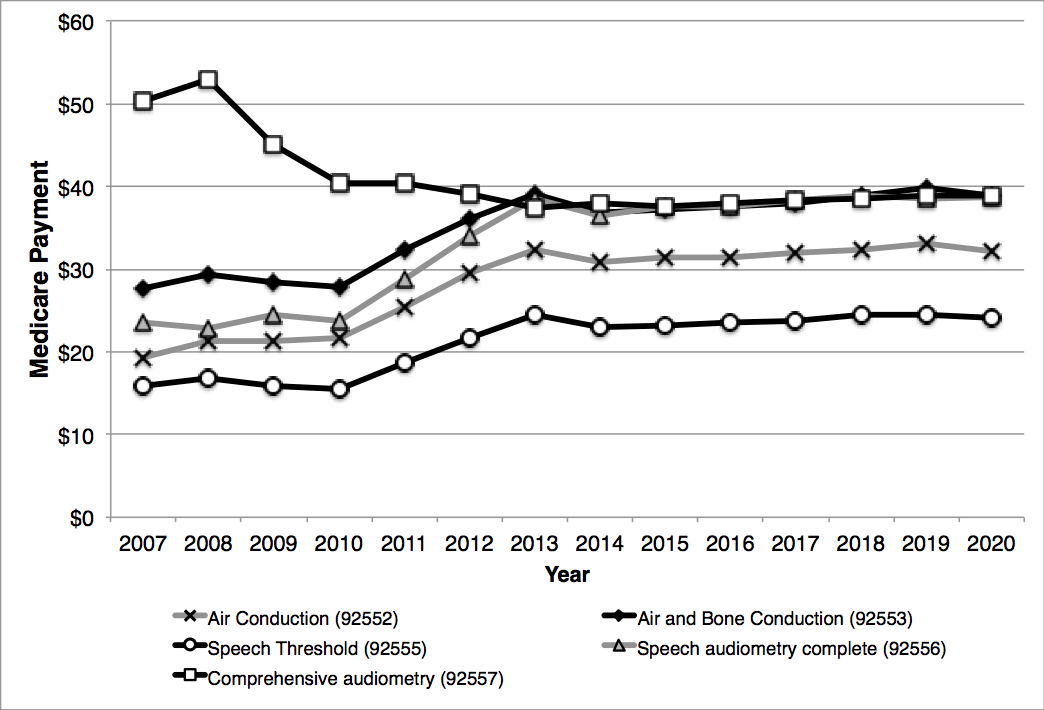
Anecdotally, there is a sense that reimbursement for audiologic procedures has mostly decreased over time. Figures 3-6 show the Medicare allowed payments (allowable) for hearing and vestibular procedures from 2007 through 2008. (Medicare pays 80% of the allowable and requires the remaining 20% be paid by the beneficiary.) As can be seen, there was substantial change to payments for most procedures between the years 2007 and 2012. However, since 2013 the Medicare allowable for these codes have remained relatively stable. Figure 1, for example, shows that the Comprehensive Audiometric Assessment (CPT 92557) was reimbursed at $52 in 2008 but has stabilized to $38-$39 range since 2013. Some procedures, however, like Air Conduction threshold testing (92552) were reimbursed about $20 in 2007 but today pay about $31 for this procedure. Similarly, in 2007, the reimbursement for Air and Bone Thresholds (92553) was $28 but today is about $38. Two important observations are:
- Reimbursement rates are stable for the majority of audiology procedures, and
- Some unbundled procedures (eg, Air and Bone conduction–CPT 92553) are being reimbursed at rates similar to the bundled codes (eg, Comprehensive Audiometric Assessment – CPT 92557).
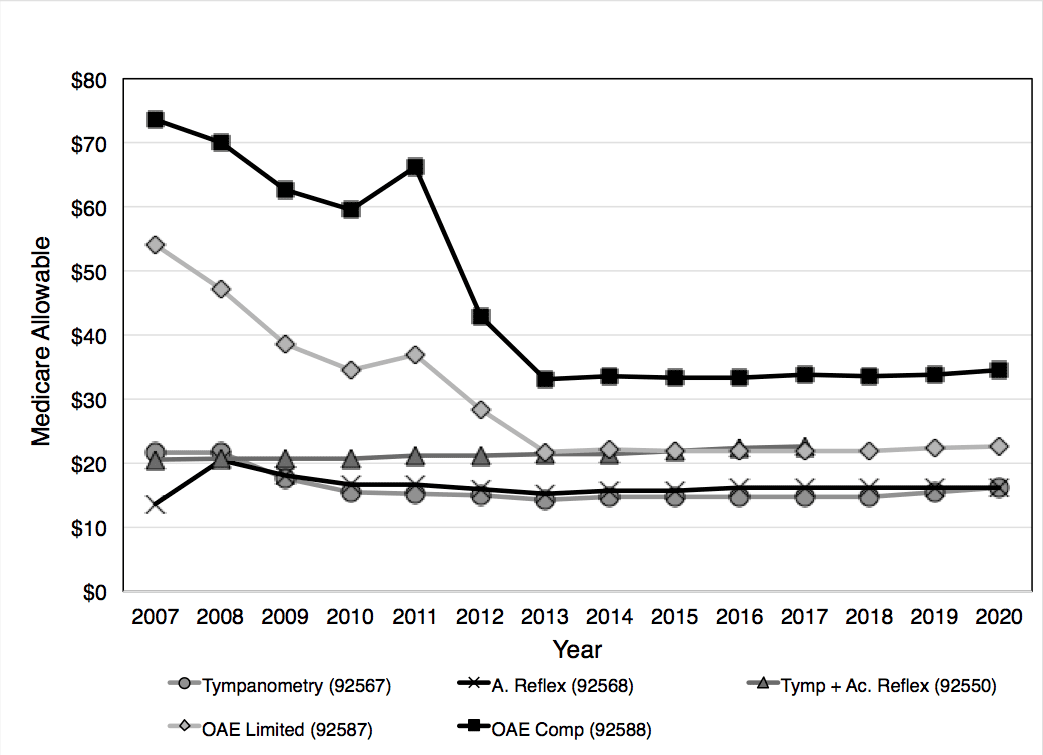
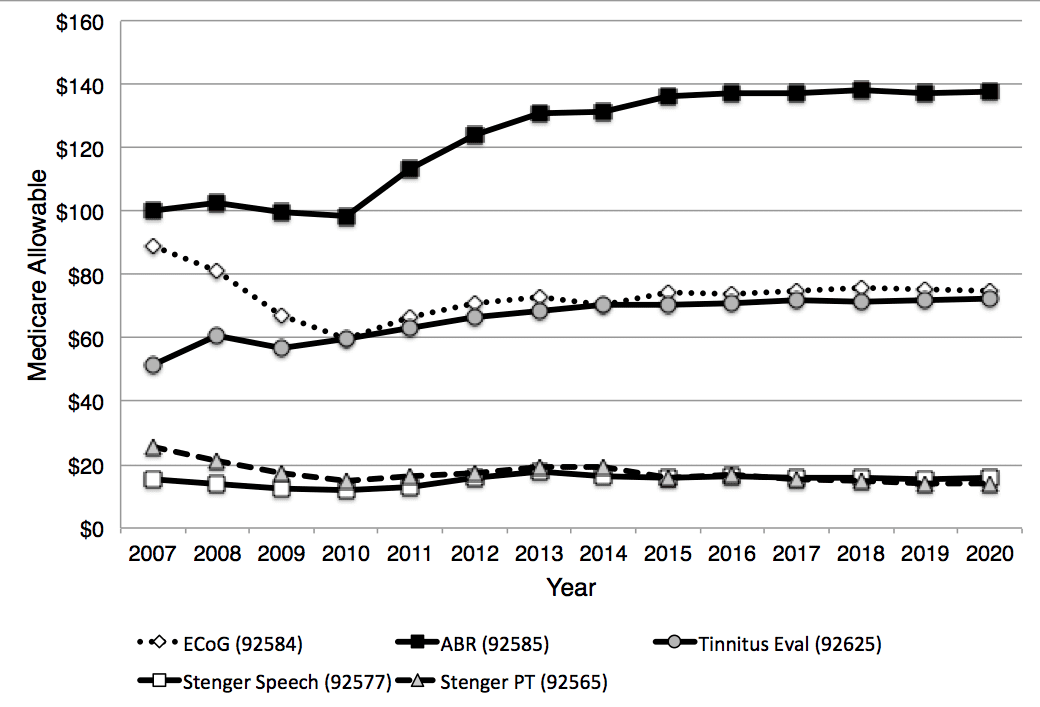
Similarly, payments for audiologic diagnostic tests show decreasing payments through the same pattern for OAE procedures (92587 and 92588). Payments for tympanometry and reflex procedures have been quite stable over the past decade (Figure 2). Figure 3 shows changes for targeted audiologic procedures. As can be seen, payments for ABR have increased over the time period 2007 through 2020, while most of the other procedures shown have been fairly flat in terms of the Medicare allowable procedures. (Note: The Consumer Price Index, or CPI, suggests an inflation rate of about 27% over the entire study timeframe (2007-2020), and about 12% between 2013-2020.)
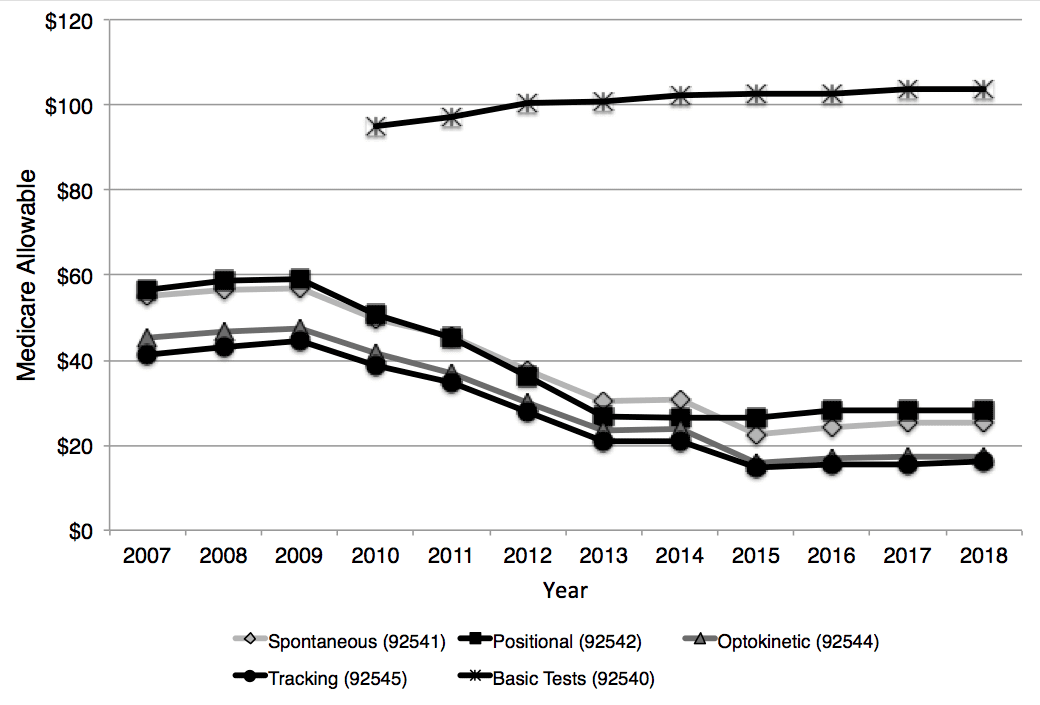
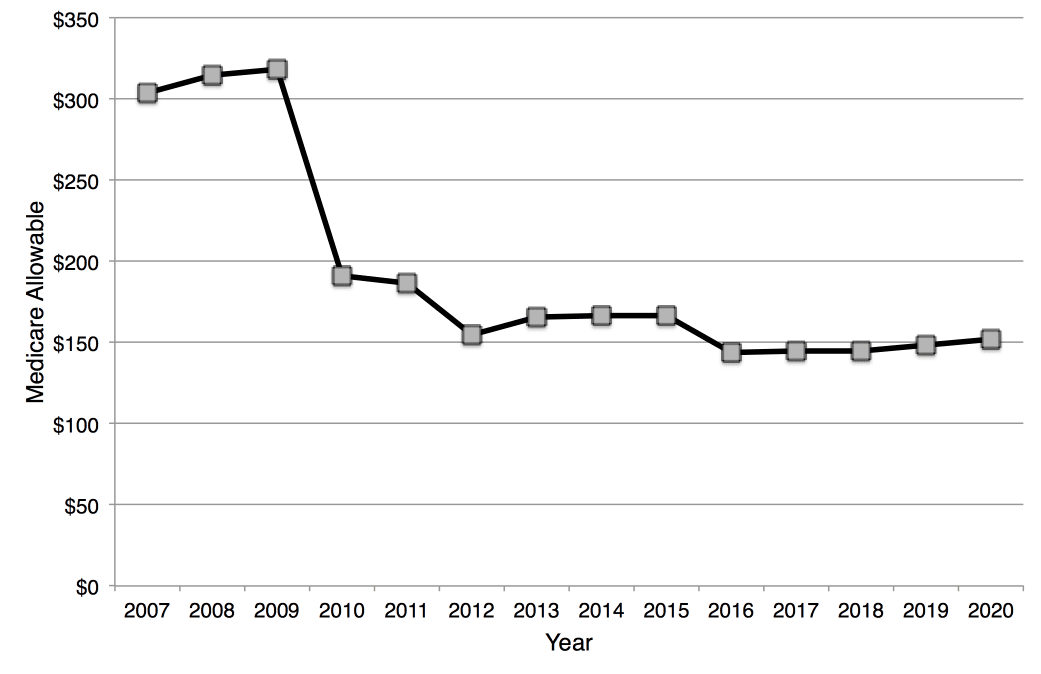
The patterns described above can also be seen in the reimbursement over the years for vestibular tests. Figures 4 and 5 show a declining reimbursement for individual test components of the ENG/VNG battery until about 2013, when the allowable payments stabilize. However, in 2011, these tests were combined into a single billing code (92540) when conducted on the same day with the same patient. Payments for the Basic Vestibular Test procedure increased slightly over the first few years but has been stable since 2013. The ENG/VNG battery of tests is often conducted sequentially on a patient in an effort to evaluate various sub-components of the vestibular-ocular reflex. This battery includes tests for spontaneous nystagmus, optokinetic nystagmus, positional nystagmus, eye tracking, and caloric stimulation. When viewing the total payment since 2007 if all the sub-tests plus 4 caloric stimulations were conducted (codes for caloric stimulation were changed in 2016 from charging each individual stimulation to combined stimulations, either monothermal bilateral or bithermal bilateral), payments for the ENG/VNG battery have declined by more than 50% over time, although again the Medicare allowable has been fairly stable over the past few years.
Utilization Across Audiologic Procedures
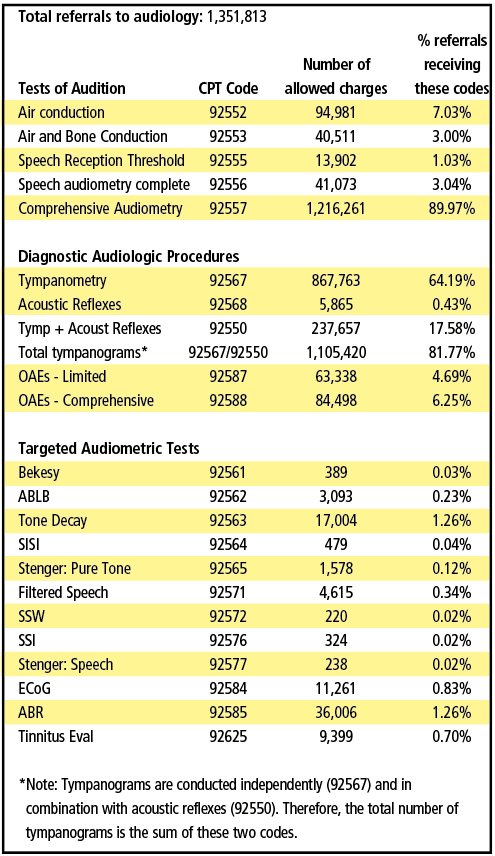
Table 3 shows number of times Medicare allowed each code during 2018 and the percentage of time each code was billed. The percentage was calculated using the number of allowed charges for each procedure divided by the total number of referrals (see “Parameters of this Review” sidebar for how total referrals were determined.) As can be seen, nearly 90% of Medicare beneficiaries referred for hearing assessments received Comprehensive Audiometry (92557). This indicates that nearly all Medicare beneficiaries received air conduction, bone conduction, speech reception thresholds, and word recognition testing.
For the Diagnostic Audiologic Procedures, about two-thirds (64%) were tested using tympanometry. In actuality, the number receiving tympanograms was considerably higher. Combining the stand-alone code of 92567 with the bundled code of 92550 (tympanometry and acoustic reflexes) indicates that 82% of patients actually were tested with tympanometry. (The stand alone code of 92568 for acoustic reflexes was phased out in 2016.) Nonetheless, approximately 18% of patients had acoustic reflex testing. Beyond acoustic reflex testing, no other test was administered to more than 6.25% of Medicare beneficiaries (OAEs-Limited), although the two OAE codes combined (92587 and 92588) would indicate that 11% of patients were tested using the OAE procedure. The incidence of tinnitus in this population is considered to be substantive, yet less than 1% of the patients had a tinnitus evaluation. In fact, the tone-decay procedure was conducted more often than a tinnitus evaluation.
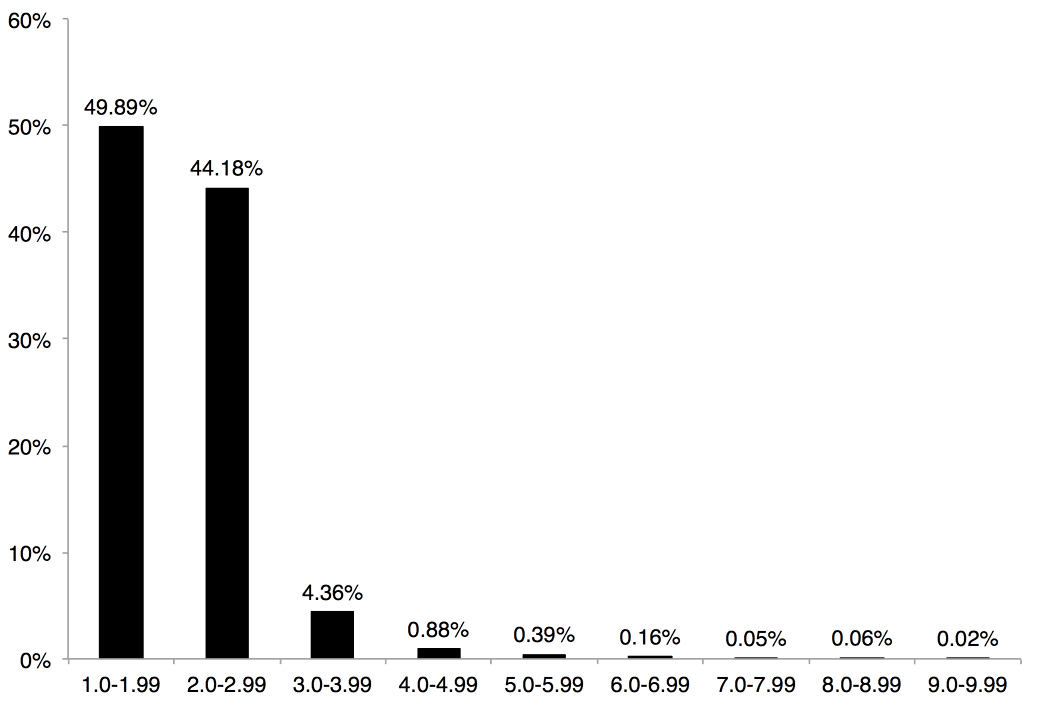
It could be argued that the methodology used to calculate the utilization of codes (ie, the number of pure-tone tests conducted) results in a skewing of the data. However, these conclusions are supported by an examination of the number of different CPT codes that were submitted by audiologists per patient. Figure 6 shows that 95% of the time audiologists submitted only one or two CPT codes. Only in 5% of the cases were more than three CPT codes submitted. This supports the idea that Comprehensive Audiometry (92557) and/or Tympanometry (92550 or 92567) are conducted on the majority of patients.
Conversely, the Medicare population is not representative of total US or pathologic demographics either; presbycusis is specific to this older population, while other forms of hearing loss or auditory system dysfunction may not be as prevalent as in younger populations. Therefore, the necessity to conduct additional tests may not be needed in the Medicare population.

That said, CMS does track the chronic conditions and comorbidities of Medicare beneficiaries referred by physicians to audiologists based on the medical necessity to diagnose, manage, and treat audiologic complaints. Figure 7 summarizes the percent of patients seen by audiologists with each chronic condition and comorbidity. According to the Medicare data, an estimated 30-50% of these patients have chronic conditions and comorbidities that can contribute to hearing or balance disorders. For example, 64.95% of audiology patients had hypertension and 29.11% had diabetes. This data is tracked for each individual audiologist and cross-referenced by the comorbidities and chronic conditions of the beneficiaries.
The fact that these patients were referred by physicians indicates a medical necessity for an evaluation to diagnose, manage, and treat their audiologic complaints, and thus would suggest a higher utilization of diagnostic tests or targeted test procedures. In addition, Audiology best practice guidelines include several components for an “adult diagnostic assessment to make diagnostic and rehabilitation decisions”12 that do not appear to be a part of the standard of care represented by the CMS data.
Parameters of this Review and Some Important Acknowledgements about CMS Data
- Only payments for the traditional Medicare program are included in this review. Data from Medicare Advantage programs, which include about 33% of Medicare beneficiaries, are not available. Therefore, the data included in this review is applicable to approximately two-thirds of individuals enrolled in traditional fee for service Medicare.
- Payments for audiology procedure codes (99201-99205) for years 2007-2020 are accessible at the Centers for Medicare and Medicaid Physician Fee Schedule Lookup website (https://www.cms.gov/apps/physician-fee-schedule/license-agreement.aspx).
- The number of allowed services, allowed charges and payments for audiology procedures CPT codes for years 2007-2018 are accessible online at the Centers for Medicare and Medicaid (CMS) Part B National Summary Data File website (https://www.cms.gov/Research-Statistics-Data-and-Systems/Downloadable-Public-Use-Files/Part-B-National-Summary-Data-File/Overview.html). Data for 2019 was not yet available from CMS.
- Current Procedural Terminology (CPT) codes are used to designate tests typically used to evaluate and/or treat hearing and balance complaints. CPT codes and descriptions are copyrighted (1995-2017) by the American Medical Association (AMA). CPT is a registered trademark of the AMA.
- For the purposes of this review, the total number of referrals for audiologic testing, exclusive of referrals for vestibular tests, is based on the sum of the number of patients receiving air conduction (92552), air and bone conduction (92553), or Comprehensive audiometry (92557). This assumes that every referral made for audiologic testing receives air conduction testing at a minimum. Therefore, every referral must get one of these three codes, but no referral gets more than one of these three codes at any one visit. For the purposes of this review, the number of referrals for vestibular testing was not taken into consideration when calculating the total number of referrals. Therefore, the actual number of referrals for hearing and balance care is higher than the numbers used in this report for “total number of referrals”.
- In general, sorting through Medicare data to identify the exact number of Medicare beneficiaries served by audiologists is confounded by several variables, including:
- Many audiologic procedures are billed under the names of physicians, practices, or hospitals. Audiologists may have performed many of these procedures but their names do not appear on the submitted bill.
- Referral to audiologists is not a guarantee of specific tests or protocols. There may be Medicare beneficiaries that were referred to audiologists who received only a tympanogram or only a vestibular evaluation.
- Some percentage of referrals is likely for follow-up testing following medical management. No attempt is made to differentiate these referrals from those referred for their initial audiologic evaluation.
- The Medicare data set only includes providers who bill more than 10 Medicare beneficiaries annually. Data for providers who serve 10 or less beneficiaries annually is not available publicly.
- There are those patients and services provided by audiologists but Medicare denied payment due to reasons, such as lack of medical necessity, not having a physician referral, or not a covered benefit. The number of denied charges is not available.
- There are likely those referrals of Medicare beneficiaries referred for reasons tied to amplification devices, and therefore a charge may not be submitted by the audiologist to Medicare.
- The phrases “hearing care” or “hearing and balance care” are used throughout this article as the Medicare data sets indicate that a high proportion of audiologic tests were billed under physician names, and that the vast majority of these physicians were otolaryngologists. For example, Comprehensive Audiologic Assessment (CPT 92557) was billed under physician names approximately 25% of the time.
- The phrase “audiologic procedures” refers to those codes that reflect behavioral and electrophysiologic tests for hearing and balance assessment, and that reflect the common code sets used by audiologists in clinical practice. Audiologic procedures were arbitrarily divided into four categories. This categorization is not intended to convey the importance or priority of any procedure, for judgment regarding appropriate test protocols, or to be used as a guide for the development of procedures to be used clinically. It is simply arbitrary and for convenience of conveying information.
- Tests of audition refer to air conduction, bone conduction, speech reception threshold (SRT), and speech recognition testing (CPT codes 92552, 92553, 92555, 92556, and 92557). Within this document, the combination of SRT and speech recognition testing will be referred to as “speech audiometry complete.”
- Diagnostic audiologic procedures include tympanometry (92567), acoustic reflexes (92568 prior to 2010; 92550 after 2010), and otoacoustic emissions (92587 and 92588).
- Targeted audiometric tests include auditory brainstem response (ABR) procedures (92585), tinnitus evaluations (92625), Pure Tone Stenger (92565), Speech Stenger (92577), and electrocohleography (92584). Data is also available for the tone decay test (92563), filtered speech (92571), Bekesy audiometry (92561), Alternate Binaural Loudness Balance (92562), Short Increment Sensitivity Index (92564), Staggered Spondaic Word test (92572), Sensorineural Acuity Level (92575), and Synthetic Sentence Index (92576), but is not included in this report except for the year 2018.
- Vestibular procedures include those associated with ENG/VNG, including Basic Vestibular Evaluation (92540), Spontaneous nystagmus (92541), Positional Nystagmus (92542), Optokinetic (92544), Oscillating tracking test (92545), and caloric stimulation (92543, 92537 or 92538). Not included in this review was Rotational Testing (92546) and Computerized Dynamic Posturography (92548).
Summary
A review of Medicare data shows changes in reimbursement over the past 14 years for audiologic procedures—although, for the most part, payments have been relatively stable since 2013. This stability, irrespective of whether the payments are consistent with the time, effort, and expenses involved, does allow a practice to predict revenues in upcoming years. Medicare data also provides a benchmark by which payments from other third-parties can be measured.
Examination of trends reveals the following:
- While the absolute number of patients referred for audiologic services have increased, the proportion of referrals has not changed over the past 12 years.
- Overall, some audiologic procedures have seen an increase in payments and others have seen a decrease; however, most payments for audiologic procedures have been stable for the past 6-7 years (slightly declining when considering inflation effects).
- Those payments associated with the most common audiologic procedures (eg, Comprehensive Audiometry (92557), Tympanometry (92567), and primary vestibular testing) have shown the greatest decline in payments.
- In general, payments declined when two or more procedures were combined/bundled (eg Tympanometry + Acoustic Reflexes, Vestibular Evaluation, Comprehensive Audiometry, etc).
- Proportionally, the majority of Medicare beneficiaries received air conduction, bone conduction speech reception threshold, word recognition, and tympanometry. Diagnostic testing was conducted less than 20% of the time.
- Tinnitus evaluations were conducted less than 1% of the time on the Medicare population.
- Many chronic conditions and comorbidities of Medicare beneficiaries referred for medically necessary audiologic evaluations are being closely monitored by CMS.
References
- US Census Bureau. 2017 National Population Projections Tables: Main Series. Available at: https://www.census.gov/data/tables/2017/demo/popproj/2017-summary-tables.html
- Agarwal S, Mishra A, Jagade M, Kasbekar V, Nagle SK. Effects of hypertension on hearing. Ind J Otolaryngol Head and Neck. 2013;65: 614-618.
- Abrams H. Hearing loss and associated comorbidities: What do we know? Hearing Review. 2017;24(12):32-35.
- Lapira A. Diabetes and hearing loss: a review. ENT and Audiology News. 2017;26(3)[Jul/Aug]. Available at: https://www.entandaudiologynews.com/features/audiology-features/post/diabetes-and-hearing-loss-a-review
- Beck DL, Danhauer JL, Abrams HB, et al. Audiologic considerations for people with normal hearing sensitivity yet hearing difficulty and/or speech-in-noise problems. Hearing Review. 2018;25(10)[Oct]:28-38.
- Spankovich C Gonzalez VB, Su D, Bishop CE. Self reported hearing difficulty, tinnitus, and normal audiometric thresholds–the National and Nutrition Examination Survey 1999-2002. Hear Res. 2018;358:30-36.
- Spankovich C, Yerraguntia K. Evaluation and management of patients with diabetes and hearing loss. Semin Hear. 2019; 40(4):308-314.
- Bray V. Depression, hearing loss, and treatment with hearing aids. April 3, 2019. Available at: https://hearingreview.com/hearing-loss/health-wellness/depression-hearing-loss-and-hearing-aids
- Kauffman L. Hearing and Value-based Healthcare. March 3, 2018. Available at: https://hearingreview.com/wp-content/uploads/2018/03/ValueBasedHearingCare_FeatureReport_0318HR.pdf
- Center for Medicare and Medicaid Services. Overview of the Medicare Physician Fee Schedule Search. Available at: https://www.cms.gov/apps/physician-fee-schedule/license-agreement.aspx
- Center for Medicare and Medicaid Services. Part B National Summary Data File. Available at: https://www.cms.gov/Research-Statistics-Data-and-Systems/Downloadable-Public-Use-Files/Part-B-National-Summary-Data-File/Overview.html
- Bratt G, Campbell K, Cherow E, et al. Audiology Clinical Practice Algorithms and Statements. Audiology Today. 2000; Available at: https://audiology-web.s3.amazonaws.com/migrated/ClinicalPracticeAlgorithms.pdf_5399751e73e3f4.85494279.pdf

About the authors: Ian M. Windmill, PhD, is the Clinical Director of the Division of Audiology at Cincinnati Children’s Hospital Medical Center in Cincinnati, Ohio, and Barry A. Freeman, PhD, is a long-time audiology educator and former industry executive who has more recently founded Audiology Consultants Inc in Parkland, Fla. Both are former presidents of the American Academy of Audiology (AAA).
CORRESPONDENCE can be addressed to Dr Freeman at: [email protected]
CITATION FOR THIS ARTICLE: Windmill IM, Freeman BA. Medicare payments for hearing care procedures: A 14-year review. Hearing Review. 2021 Mar;28(3):12-18.