|
|
|
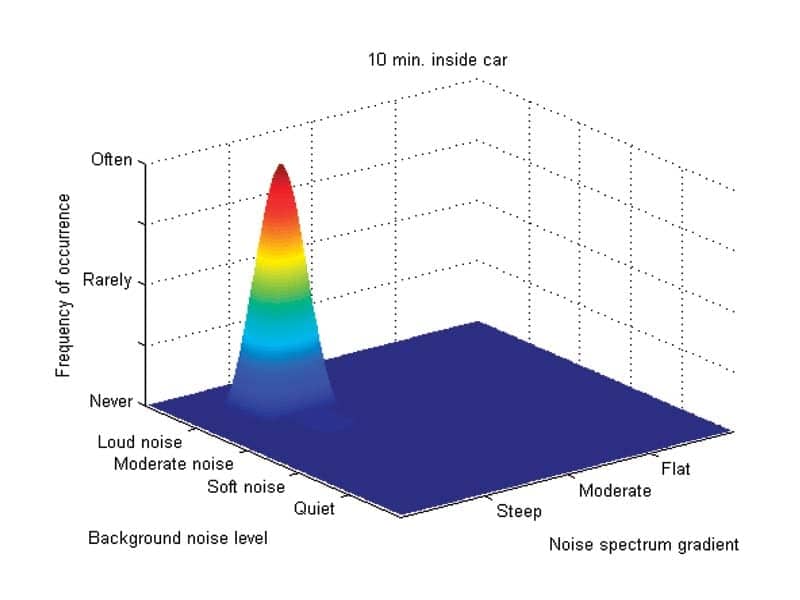
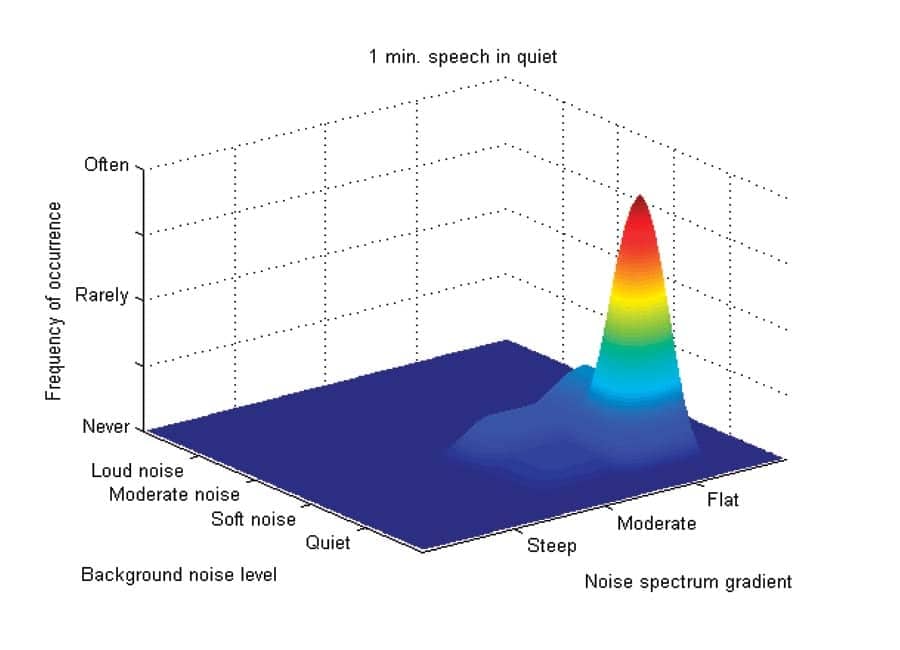
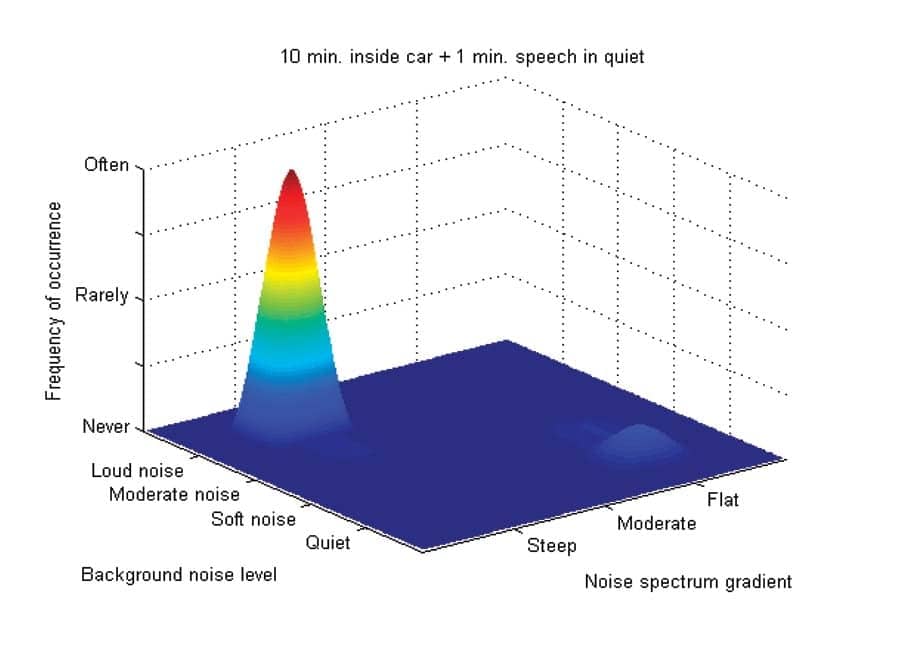
| FIGURE 1a-c. The limitation of current datalogging systems to provide fine-tuning clues for isolated acoustic events. Background noise level (x-axis), noise spectrum gradient (z-axis), and the frequency of occurence (y-axis) are shown. The height (and color) of the cone represents how frequently that sound occurs. The sound environments are: a) A 10-minute recording inside a car which has a loud steep characteristic dominated by low frequencies; b) A 1-minute recording of female speech which has a flat spectrum with energy in high and low frequencies, and c) A composite of 1a & 1b which under-represents the speech (flat) component. (click each image for larger view.) |
The majority of hearing aids are fit using the manufacturer’s proprietary targets or generic targets if the result is less than satisfactory. The wearers report on the specific problems and the clinicians adjust the relevant gain parameters on the hearing aids.1 The appropriateness or effectiveness of the adjustment assumes that:
1) The wearers are accurate in the description of the acoustic/physical environments responsible for the complaints;
2) The clinicians understand precisely the wearers’ descriptions, and
3) The clinicians are familiar with the input-output (I-O) characteristics of the hearing aid.2
Violation of any of these three assumptions could lead to a failure in the resolution of the problem.
More recently, the use of simulated sound environments (multimedia presentation) has been promoted to “bring the patient’s sound environments into the clinic” and as a tool to fine-tune gain settings on the hearing aids.3 While this is effective, it is not the wearers’ real sound environments, and there are a finite number of these simulated environments to choose from.
The use of simulated real-ear display,4 such as the SoundTracker in the Senso Diva and Widex Inteo hearing aids, provides a visual spectral-intensity display of the actual stimulus that causes the wearers’ complaints so the proper gain adjustment may be made. However, it is tied to the clinician’s office settings because a computer (with Noahlink) is necessary to display the sound pressure levels.
For a better understanding of the acoustics that lead to a user’s complaint, something that is more portable is necessary to record those acoustic events. In this article, we describe another approach to bringing the wearers’ environments into the clinic: how the duration of datalogging is critical in solving complaints that are tied to a specific acoustic environment.
Benefits of Datalogging
There are at least two levels of analyses used in today’s datalogging systems:
Simple. Simple datalogging involves minimal analysis of the input acoustic data. The internal clock within the hearing aid measures the time lapsed when the activation criteria for a specific feature is reached. An example is the recording of the hour of use of the hearing aid or of the various listening programs within the hearing aid. By inference, some may use the duration of use of a specific program to estimate the kinds of listening environments in which the wearers were engaged.
Despite this “simple” approach to datalogging, the information generated can be very useful. For example, logging the hours of hearing aid use or of each specific listening program allows clinicians to ascertain that the wearers are using the hearing aids in the intended manner. It also allows them to examine if the use pattern of the different programs matches the types of environments reported by the wearers.
Advanced. Advanced datalogging systems use detailed acoustic analyses of the input information. The analysis can include the nature (eg, speech vs noise vs wind) of the input sounds, the spectra of the sounds, the intensity of the sounds, and the frequency of occurrence of different sounds. By reconstituting the results of the analyses, one may be able to identify the environments encountered by the wearers, as well as how frequently each environment occurred. When this information is compared to the settings on the hearing aids, the clinicians can judge the appropriateness of the settings for the wearers, or if specific adjustments are necessary.
But There Are Limitations…
Despite the complexity in the analysis of the current datalogging systems, one common limitation is that they do not provide clues to resolve complaints from isolated acoustic events. Examples of such events may include a particular speaker’s voice, a train passing at the subway station, or a bird song which the wearer has difficulty hearing.
The reason for this limitation is the averaging used in datalogging systems. Data-logging is the accumulation of data over time. As such, the data that are acquired during the isolated acoustic events will be added to the data collected since the beginning of the fitting. This results in a loss of acoustic details of the isolated acoustic event—thus no clues will be available to the clinician relative to fine-tuning/trouble-shooting purposes.
Figure 1a shows the 3-D display of the analyzed data recorded inside a car on a highway for 10 minutes. In this example, one can say that the sound is mostly loud and has a steep (mostly low-frequency) spectrum. Figure 1b is a 3-D display of a one-minute sample of female speech in quiet. The most dominant sound has a “flat” spectrum, meaning that it has energy in both the high and low frequencies. Also, the level of the sound is mostly “soft.” When the logged data of these two sounds are added together (Figure 1c), one sees only one peak similar to that seen in Figure 1a. The “peak” seen in Figure 1b disappeared.
|
|
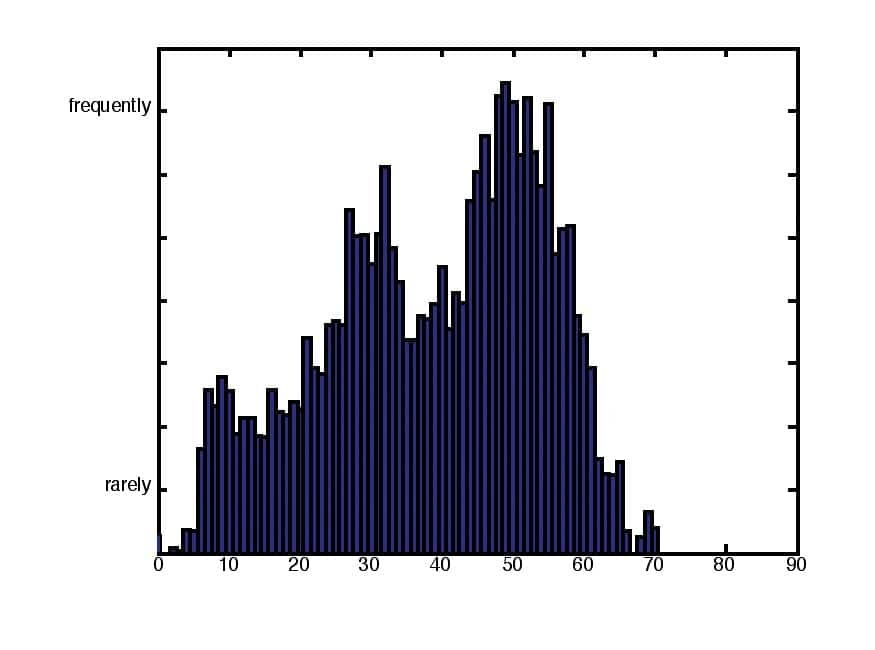
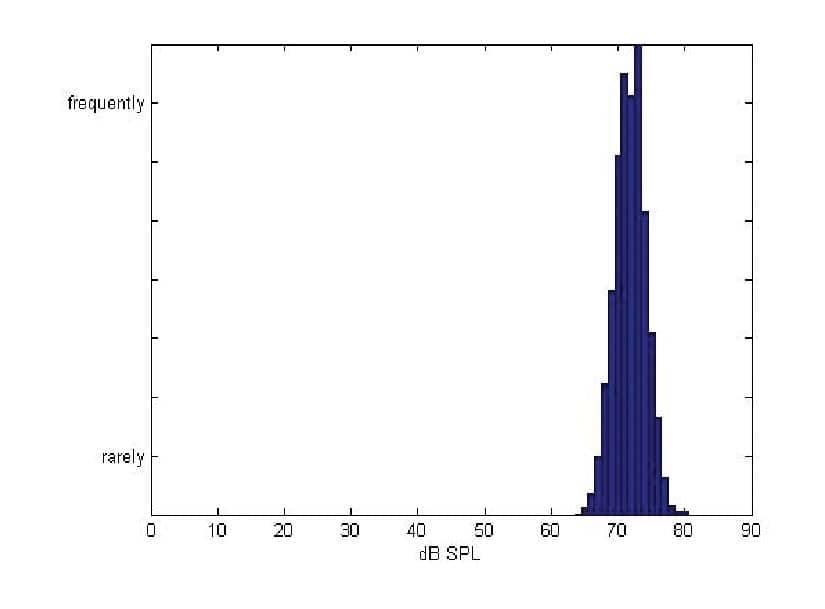
| FIGURE 2a-b. Level distribution functions measured in one channel of the Inteo hearing aid over a 2-minute period. The top is that of a speech input, and the bottom is the noise generated by a car. (click each image for larger view.) |
Consequently, if one desires to use datalogging for trouble-shooting/fine-tuning complaints from isolated acoustic events, the system must include three key ingredients. First, it must have the necessary hardware for an accurate acoustic analysis; it must be able to code the input as accurately as possible. A high caliber microphone and a non-distorting input stage is necessary. Second, it must have an algorithm that allows the complete analysis and characterization of the input signals. Third, it must have a mechanism to separate the results of the short-term analyses from the long-term analyses.
Datalogging Components
The Inteo hearing aid introduced by Widex uses Integrated Signal Processing (ISP) technology to link all its functional components so that integration and processing of information is achieved through four modules. These are: 1) the Dynamic Integrator (DI) which stores and integrates the actions of the other 3 modules; 2) the High Definition Sound Analysis (HDSA) module which analyzes the acoustic environments and stores the results of the analysis in the Sound Diary; 3) the High Definition Sound Processing (HDSP) module which processes the acoustic input in pre-defined manners, and 4) the High Definition System Optimization (HDSO) module which optimizes the actions of the HDSP and HDSA modules. For example, an input dynamic range of 107 dB SPL is made possible by the HDSO so the HDSA module has the full range of input for a complete analysis. Readers are referred to Kromen et al.5 for a detailed description of these modules.
Level distribution: The basis for all analysis. The Inteo uses the patented Level Distribution function6 to measure how frequently sounds of a particular intensity occur during a specific period of time. Figure 2a shows that, for the speech input, sounds around 50-60 dB SPL occur most frequently, followed by those around 30 dB SPL.
|

|
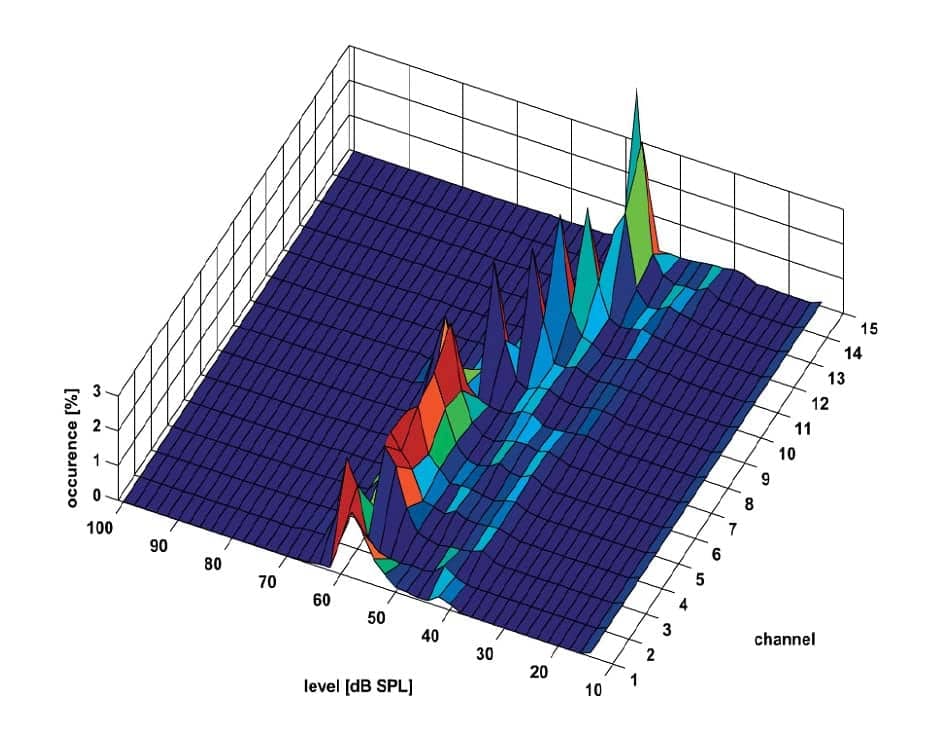
| FIGURE 3a-b. 3-D display of car noise (top) and playground noise with speech (bottom) illustrating the unique pattern formed by each acoustic environment. (click each image for larger view.) |
On the other hand, sounds above 70 dB SPL rarely occur. In fact, when the level distribution function of a speech signal is examined, there is usually more than one peak or a broad distribution of sound intensities. This is referred to as multi-modal distribution and generally includes sounds that vary in intensity levels over time, such as speech.
On the other hand, Figure 2b shows a level distribution function that has only one peak around 75 dB SPL. This is described as uni-modal distribution which is characterized by signals that do not change their amplitude over time (eg, stationary noise).
Level distribution in multiple channels. One advantage of performing level distribution analyses in all 15 channels independently and simultaneously over time is that a unique visual pattern of the acoustic environment emerges for each environment.
The results of the unprocessed acoustic analyses done on “car noise” and “playground with speech” environments are shown in Figure 3a and 3b respectively. The display shows the percentage of time (z-axis) sounds of a particular intensity level (x-axis) occur in each of the 15 channels (y-axis). One can see that the “car noise” is mostly a broadband noise occurring at around 50-60 dB SPL, while the playground noise has a broad intensity range that is more intense in the low frequency channels (40-70 dB SPL) and decreases in levels with higher channels (10-40 dB SPL). This observation suggests that one may be able to identify precisely the nature of the acoustic environments and modify the processing of the hearing aid accordingly.
|
|
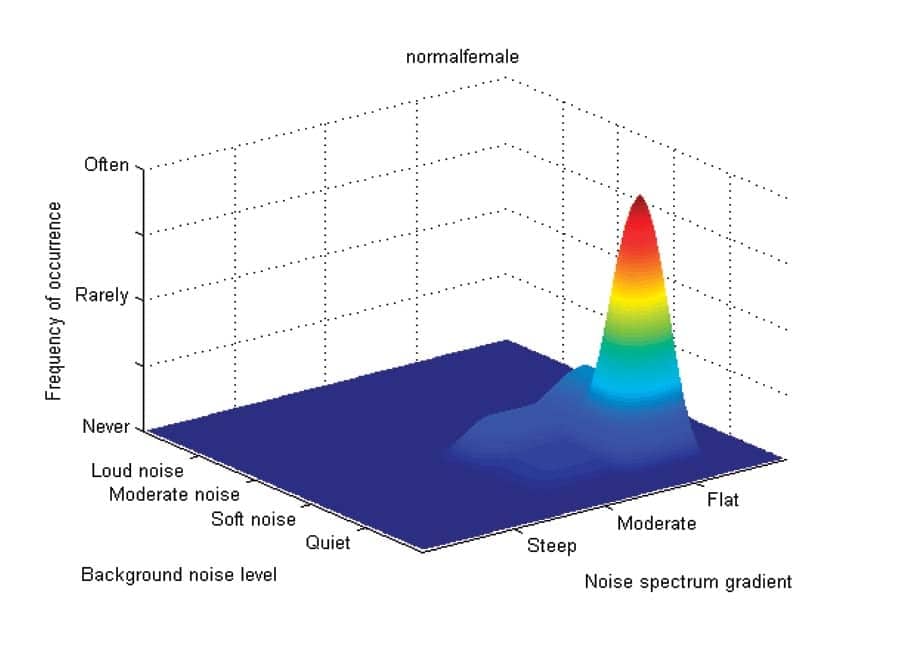
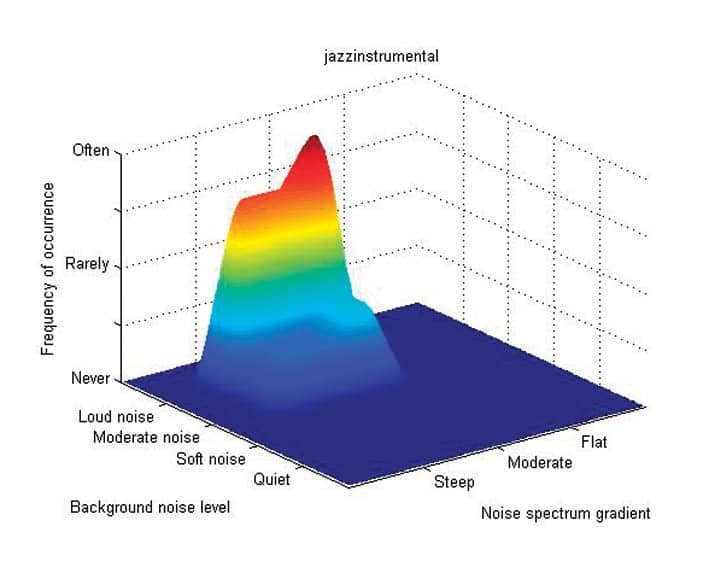
| FIGURE 4a-b. 3-D displays of two sound environments (female speech at normal level on top and jazz instruments on bottom) based on 3 of the 4 parameters described. (click each image for larger view.) |
Storage of information over time (Sound Diary). The acoustic analyses of the wearers’ environments occur continuously in order that the processors are updated with the most current information as they become available. At the same time, the results of some of the acoustic analyses are saved in the hearing aid so they may be reviewed later by the clinicians for better wearer counseling and as clues for trouble-shooting specific wearer complaints.
There are four input parameters that the Inteo hearing aid examines and of which the data are stored. The input signals are characterized by their: 1) Background noise level; 2) Depth of modulation; 3) Overall spectral tilt; and 4) Frequency of occurrence. Using these four parameters, the Inteo is able to differentiate sounds that occur in the typical environments.
The 3-D displays of two listening environments recorded each for 2 minutes using three of the four parameters are shown in Figure 4. One can see that these two sounds differ by their spectral tilt as well as by their input levels. Figure 4a shows female speech spoken at a normal conversational level. The spectral gradient is moderately flat to mildly sloping. The background noise level is low. These descriptions would agree with the label of “speech in quiet.” For the “jazz instruments” in Figure 4b, the peak of the response occurs where the noise level was “loud.” The spectral gradient is somewhat between steep (low frequency only) and moderate. Clearly these two sounds are distinctly different from each other when analyzed using the criteria described earlier. Other sound situations would show different patterns.
Long-term datalogging. There are two options in the Inteo datalogging function—a long-term datalogging and a short-term (or event) datalogging. In long-term datalogging, recording of the data starts when the hearing aid is initially fit until the data are downloaded from the Compass fitting software during a follow-up visit. That is, it can be infinitely long.
|
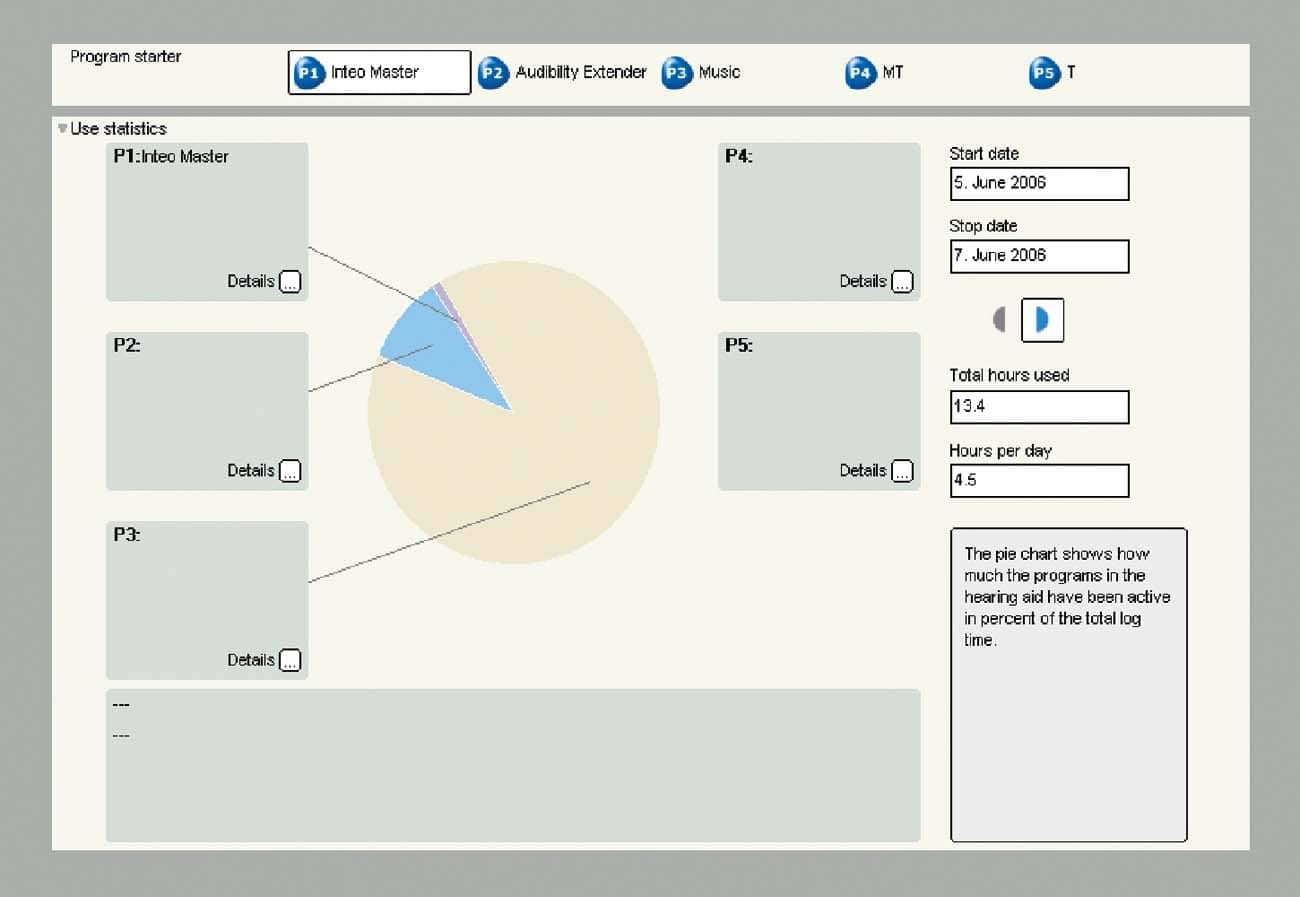
| FIGURE 5. Usage screen showing the actual hours of use of the Inteo and the percentage of time each listening program has been used (via a pie-chart). (click image for larger view.) |
Figure 5 shows the usage information provided by the long-term datalogging of the Sound Diary. One can see that the hearing aid has been in use for a total of 13.5 hours in the 3 days that it was fitted (with an average of 4.5 hours per day). It also shows that the music program (P3) was used over 80% of the time, and the second program (P2, a frequency transposition program) was used about 20% of the time.
This could provide insights to the clinicians on the acceptability of the transposition program. The observation that the music program was used over 80% of the time reflects the wearer’s preference for this over the master (P1>) program, and P3 should be used as the default program instead of the master program. In addition, because the transposition program was used only 20% of the time, its intended use as an optional listening program is justified. However, if P2 were used over 80% of the time and the master program 20% of the time, the clinician may want to switch program positions so P2 becomes the first (ie, default) program instead.
|
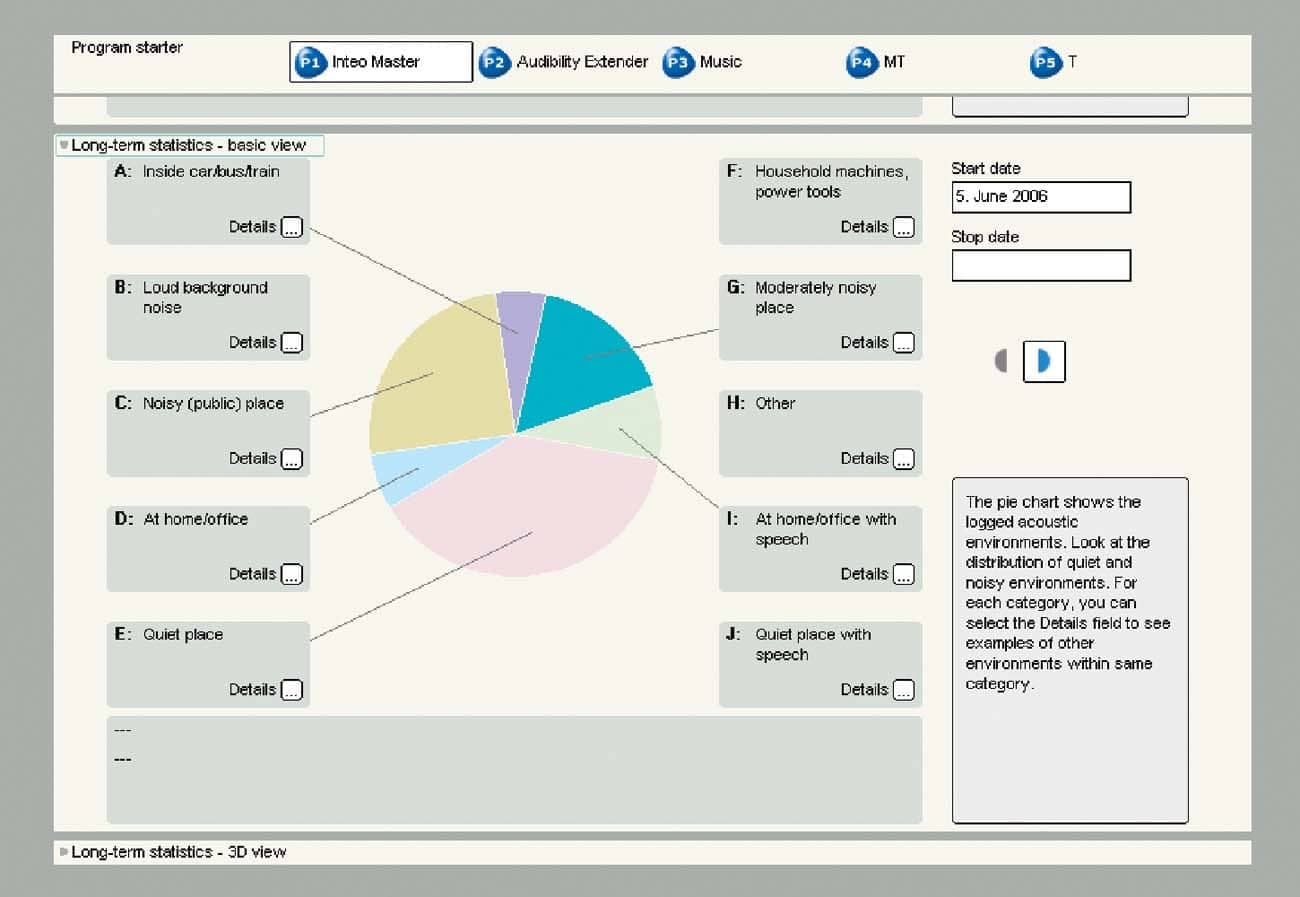
| FIGURE 6. Pie chart showing the percentage of time the wearer was in different sound categories. (click image for larger view.) |
Because of the acoustic analyses performed across the 15 channels, the Sound Diary is able to classify the incoming sounds into eight different sound categories, each having a different combination of values on each of the four analysis parameters listed earlier. One can examine these charts and guesstimate the percentage of time the wearer spends in that category of sound environments.
Figure 6 shows that, of the 13.5 hours that the wearer wore the device, almost 35% of the time was spent in “quiet” environments. The wearer also spent about 25% of the time in “noisy, public places,” 15% in “moderately noisy” places, 11% in the “home/office” environment where speech was present, 7% “inside cars, trains,” and 7% in “home/office without any speech.” Note these sound categories represent the input to the Inteo hearing aid as a whole and not the input to a specific listening program. Because the label for the specific sound category may not be the specific ones that the wearer uses, each sound category also includes a list of sound environments that have similar parametric values.
Figure 6 provides clues about the wearer’s lifestyle. In this case, the wearer spent over half his time in quiet or almost-quiet environments (53%) and 40% of his time in noisy environments. Thus, the wearer has listening needs in both quiet and noisy situations, reinforcing the value of the device’s default master program which has an adaptive directional microphone and a noise reduction algorithm based on the speech intelligibility index (SII). On the other hand, if the wearer was not provided such options, concern would be warranted if the hearing aid didn’t meet the wearer’s needs. Thus, one needs to recognize that the results of the datalogging by themselves are not helpful unless they are interpreted by clinicians who have knowledge of the hearing aid settings/features, as well as the wearers’ report of their listening environments.
Short-term datalogging (Event Log). On the other hand, information from the long-term datalogger would not be helpful in fine-tuning the hearing aid for complaints from isolated acoustic events (eg, a particular talker) for the reasons described earlier. Sampling of the specific acoustic environment and that environment alone is necessary if one intends to use the results for fine-tuning purposes.

|
| FIGURE 7a-b. 2-D detailed view of the result of short-term datalogging used in the Inteo. A car being driven on the highway is represented in Figure 7a, and a bird singing is represented in Figure 7b. (click image for larger view.) |
To provide that flexibility, the Inteo also includes a short-term datalogging function called the Event Log. The wearer may activate the event log by pressing a button on an optional remote control. Once activated, the event log can sample, analyze, and save 1-minute’s worth of the acoustic environment that is identified by the wearer. Fine-tuning is simply a matter of identifying the level and the spectral content of the troubling stimulus, and addressing the gain parameter(s) of the appropriate channels accordingly.
For example, Figure 7a-b show the 2-D detailed view of the short-term event log for the noise recorded in a car being driven on a highway (7a), and the song of a bird (7b). There are four pieces of information that can be generated from each display. The x-axis shows the spectral gradient of the input, with “steep” meaning primarily low frequency content below 500Hz, “moderate” meaning a mixture of low and high frequency sounds with a moderate spectral slope (about 6-10 dB per octave slope), and “flat” meaning approximately equal energy in all frequencies. The y-axis represents the level of the background noise that is measured. “Quiet” would suggest an ambient noise level of less than 30 dB SPL, “soft” would suggest an input noise level of 30 to 50 dB SPL, “moderate” a level between 50 and 70 dB SPL, while “loud” an input above 70 dB SPL. In essence, the display shows the averaged frequency-level content of the input.
There are also two other pieces of information available. The size of the circle displayed indicates the frequency of occurrence of that particular sound. The depth of modulation is represented by the color of the circle; the more modulated it is, the darker the circle. For example, in Figure 7a, the largest circle (or the most dominant sound) is “loud” and has a “steep” spectrum. It is only slightly modulated, a characteristic of a noise-like signal. In Figure 7b, the most dominant sound is the “flat” spectrum with a “soft” level, to be followed by the same spectrum at a lower level (quiet). It is highly modulated, as expected, as one might imagine from bird songs.
There are two observations from the example shown in Figure 7b. First, speech is not the only sound that is highly modulated; other sounds that are repetitive in intensity level changes are also identified as highly modulated. A second observation is that one can describe the sounds from the short-term event log and guesstimate its frequency spectrum; however, it will not be easy to know the identity of the sound (eg, bird vs speech) unless the wearer reported on its identity.
Resolving Complaints Using Event Logging
A requirement to use the short-term log is that the acoustic event lasts longer than 1 minute. This means that the event log is not suitable for use with brief acoustic events (eg, a door slam). However, the results of the short-term event log still preserve the finer details of the acoustic environment so the clinicians can understand the spectral-intensity content of the sound. That information, when paired with the knowledge of the input-output characteristics of the hearing aid, may help in fine-tuning.
|
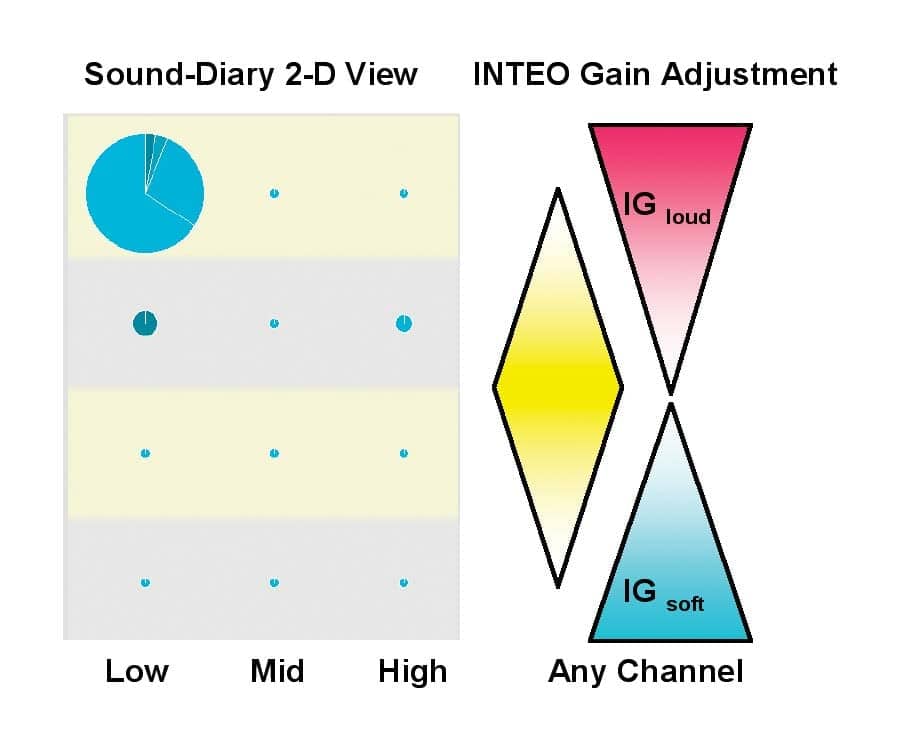
| FIGURE 8. Correspondence between the Sound Diary 2-D detailed display and the effect of each IG parameter. (click image for larger view.) |
Figure 8 pairs the 2-D display of the Sound Diary with the schematized action of each insertion gain (IG) parameter used on the Inteo (for each frequency channel). For example, “IG normal” (yellow) has the maximum effect at around an input level of 50 dB and its effect diminishes as the input level deviates from that level. This suggests that the IG normal adjustment should be made when the “Background noise level” on the Sound Diary is between the “soft” and “moderate” levels. On the other hand, the effect of “IG loud” increases above the 50 dB input level and the effect of “IG soft” increases below the 50 dB level. Consequently, knowing the “background noise level” allows one to adjust the appropriate IG parameter.
The action of each IG parameter is common to all frequency channels used in the Inteo. To know precisely which channel to adjust, one can use the spectrum information shown in the Sound Diary for help. “Steep” would usually involve the low frequency channels at and below 500 Hz. “Moderate” would usually involve frequency channels between 800-2000 Hz, while “flat” would involve frequency channels higher than 2000 Hz.
As an example, assume that the wearer complains the noise in his car is too loud while driving on the highway. One can immediately realize that the noise is low-frequency based and is higher than 70 dB in intensity. So, one would lower the gain parameter that affects primarily low frequency, high input (IG loud) sounds. Effectively, the Sound Diary provides the clinicians information on which frequency and gain parameters to adjust without taking a spectral analyzer to the wearer’s environment to determine the characteristics of the offending sounds.
The event log also takes away the guesswork for clinicians when the wearers are not precise in describing their complaints. The authors recall a case in which an elderly woman reported “traffic noise” to be bothersome. The gain setting for loud sounds (ie, IG loud) across frequencies was lowered but the adjustment did not solve the complaint. With the short-term event log, it was discovered that the “traffic noise” had a “soft” level and a “flat” spectrum—a finding that is uncharacteristic of typical traffic noise. With additional questioning, it was learned that she referred to the traffic noise heard from the window of her apartment. At that distance, traffic noise had a much lower intensity level. A reduction of the IG soft parameter was necessary instead.
Despite the advantages of the short-term datalogging function, the decision to make the final gain adjustment is dependent on many factors—not just on the wearer’s reaction to one isolated acoustic occurrence. This is because the adjustment may affect the performance of the hearing aid in other environments as well. One must consider all the factors before the adjustment. The value of datalogging in general, and the event log in particular, is to provide insights into the acoustic environment related to the complaint. However, the decision to make changes must be carefully weighed by the clinicians.
|
This article was submitted to HR by Francis Kuk, PhD, director of audiology at the Widex Office of Research and Clinical Amplification (ORCA), in Lisle, Ill, and Maja Bülow, MA, a research audiologist at Widex A/S, in Vaerloese, Denmark. Correspondence can be addressed to Francis Kuk, PhD, Widex ORCA, 2300 Cabot Dr, Ste 415, Lisle, Ill 60532, e-mail: . |
References
- Kuk F. Using flow-charts to systematically solve hearing aid problems. Hear Jour. 1999; 52(10):46-52.
- Kuk F. Using the I/O curve to help solve subjective complaints with WDRC hearing instruments. The Hearing Review. 1998;5(1):8-16,59.
- Kuk F, Damsgaard A, Bulow M, Ludvigsen C. Using digital hearing aids to visualize real-life effects of signal processing. Hear Jour. 2004; 57(4):40-49.
- Kuk F, Bulow M, Damsgaard A, Jessen A, Ludvigsen C. Hearing aid fittings and the use of simulated sound environments. The Hearing Review. 2004; 11(8): 42-48.
- Kromen M, Troelsen T, Pawlowski A, Fomsgaard L, Suurballe M, Henningsen L. Inteo—A Prime Example of Integrated Signal Processing. In: Integrated Signal Processing—A New Standard in Enhancing Hearing Aid Performance. The Hearing Review. 2006;13(3)[Suppl]; 3-7.
- Kuk F, Ludvigsen C, Paludan-Muller C. Improving hearing aid performance in noise: Challenge and Strategies. Hear Jour. 2002; 55(4): 34-46.