By Karl Strom
It’s fairly common knowledge that US hearing instrument net unit sales have increased, on average, at a rate of about 3-4% annually for at least 10 years. However, this percentage is not always useful for the average private/commercial dispensing office because: 1) It includes the dispensing activity of the US Department of Veterans Affairs (VA) which has been booming in recent years due to a rapidly aging veteran population, changes in the VA’s eligibility requirements, and the wars in Afghanistan and Iraq, and 2) It ignores potentially important regional demographics and economics.
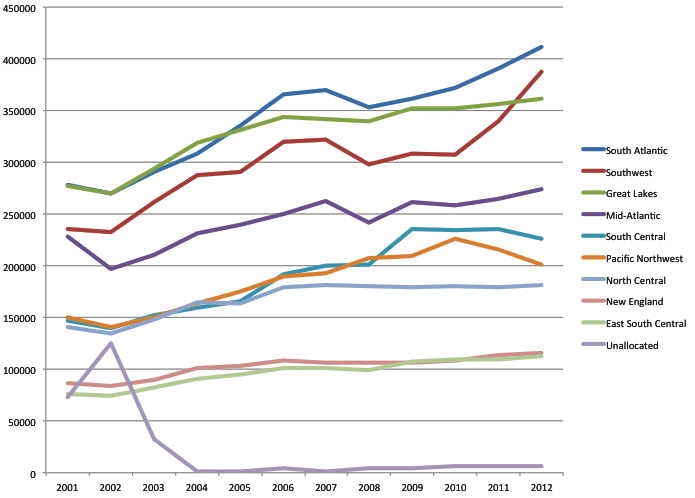
The following article presents a 10-year (2002-2012) snapshot of regional private-sector hearing aid sales using statistics compiled by the Hearing Industries Association (HIA), Washington, DC. It divides the United States into the nine geographical regions typically used by the US Bureau of the Census, and these regions are presented in the article from the highest-to-lowest dispensing volume (Figure 1). Each regional summary on pages 36-42 provides a brief synopsis of sales, a table showing net hearing aid unit volume growth (non-annualized) for each state, and a graph of hearing aid sales from 2001 to 2012.
Overall, this report demonstates that hearing aid unit sales for the US private-sector have increased by about 2.7% annually during the past 10 years (Table 1)—a total unit sales increase of 36.6% since 2002. However, depending on where you live, the annual percentage growth rate could be as high as 5.1%, with total unit growth of 66.4% since 2002 (eg, see Southwest region). Generally speaking, dispensing offices in southern states are experiencing annual percentage unit growth above 4%, compared to about 3% for northern states.
|
| Figure 1. (click to enlarge) Regional private-sector (non-VA) hearing aid unit volume growth from 2001-2012, including unallocated units (ie, units sold to unknown states/regions). As can be seen here and in Table 1, the fastest growing regions are in the southern part of the country. Source: HIA. |
|
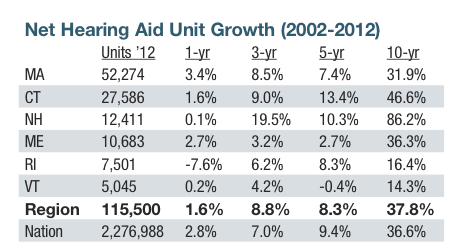
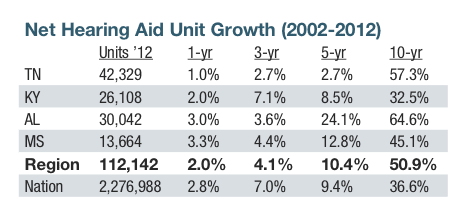
| Table 1. (click to enlarge) Regional private-sector (non-VA) hearing aid units in 2012, as well as 1-, 3-, 5-, and 10-year annual percentage growth figures. Regions are listed by order of fastest growth during past 10 years. *“Nation” includes units not allocated to states (figures not shown), and does not include VA; **“Total” includes all units sold in US including VA and unallocated units. Note that, because 2002 unallocated units were abnormally high (see Figure 1), 10-year regional figures are probably slightly higher than actual values. Source: HIA |
Figure 1 provides a 12-year summary of net unit volume private-sector sales within each of the nine regions. Applying hearing aid terminology to Figure 1, one might say the Great Recession acted like a sales “notch loss” from 2007 to 2009 and a “compression limiter” for hearing aid sales in the subsequent years for most states/regions. The last 5 years have brought flat sales to the North Central (0% annual percentage growth from 2009-12), Pacific Northwest & Mountains (0.8%), Mid-Atlantic (0.9%), Great Lakes (1.1%), and New England (1.6%). The southeastern US fared better (South Central 2.5% annual percentage growth; South Atlantic 2.1%; and East South Central 2.0%), while the Southwest continued its relatively strong sales growth (5.1%).
However, one should place all these statistics in proper context: this analysis includes arguably the bleakest economic period that the United States has endured since the 1930s. And it should be noted that average annual percentage growth rates for these nine regions during the 5 years (2002-2007) preceding the recession ranged from a low of 4.8% in New England to a high of 7.2% in the South Central—for solid market growth.
Some caveats. 1) As with any survey, HIA-member reporting companies can make errors; 2) States with relatively few dispensing offices or unit sales often experience erratic growth patterns. 3) As luck would have it, 2001 was an anomalous year because of its unusual number of unallocated units (7% of national sales compared to <1% in most other years) as shown in Figure 1. Thus, 10-year regional/state sales are slightly inflated and do not reconcile completely with national figures.
All of the following tables and images for can be enlarged by clicking on the image.
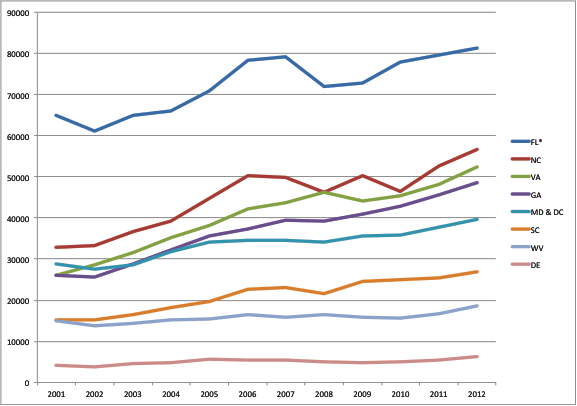
SOUTH ATLANTIC (FL, NC, VA, GA, MD & DC, SC, WV, DE)
Dominated by Florida, the nation’s 2nd largest dispensing state (behind California), the South Atlantic makes up 18.1% of all US sales and has experienced the second-fastest unit sales growth rate behind the Southwest, with Virginia and Georgia leading the way in percentage sales increases.
|
|
| Figure 2. State-by-state unit volume growth from 2001 to 2012. *The dashed line signifies a break in the linear graph for the purpose of including Florida (which is 2 times the values shown here). |
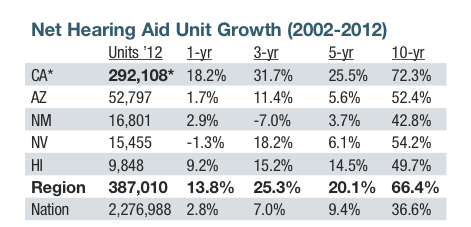
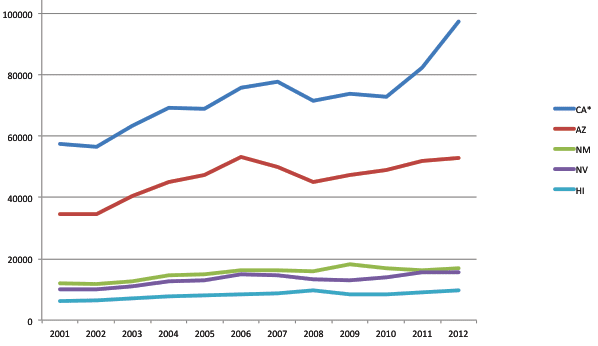
SOUTHWEST (CA, AZ, NM, NV, HI)
California, the largest dispensing state by unit volume, makes up 12.8% of all the hearing aids dispensed in the United States. It is also the fastest-growing state in the region. However, all states in the Southwest—which account for 17% of all US hearing aid sales—have enjoyed far better unit volume growth relative to the rest of the country. Arizona, with its large population of seniors (13.8% of population is over age 65), and Nevada have recovered well following the recession.
|
|
| Figure 3. State-by-state unit volume growth from 2001-2012. *The long dashed line signifies a break in the linear graph for the purpose of including California (which is 3 times the values shown here). |
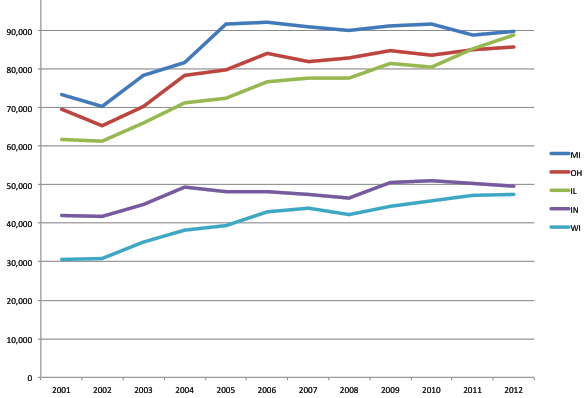
GREAT LAKES (MI, OH, IL, IN, WI)
With many states still at or below the unit sales volumes they had 3 to 5 years ago, the Great Lakes region is an extremely important region for hearing aid sales (16% of total US private-sector market) that has struggled mightily during the Great Recession. All Great Lakes states saw fairly good growth from 2002-2004, but then (with the exceptions of Illinois and Wisconsin) essentially flat-lined in sales shortly thereafter. Likewise, last year was flat for all except Illinois.

|
|
| Figure 4. State-by-state unit volume growth from 2001 to 2012. |
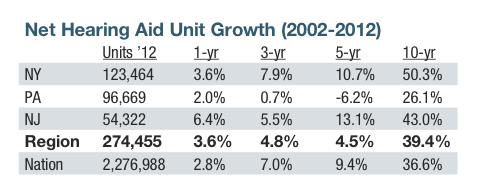
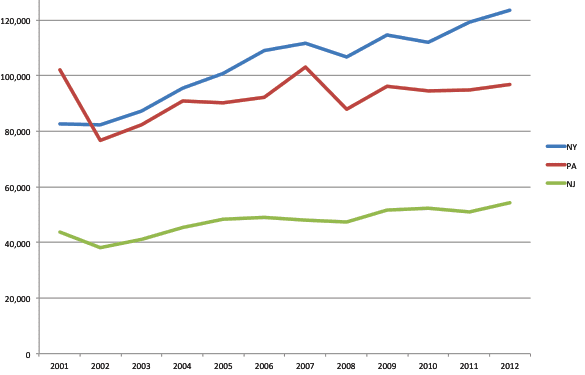
MID-ATLANTIC (NY, NJ, PA)
New York, Pennsylvania, and New Jersey are the 4th, 5th, and 9th largest dispensing states in the United States, respectively, and make up 12.1% of all private-sector hearing aid sales. During the nationwide 1999-2002 hearing aid sales swoon, these three states saw substantial sales losses (NY -11%; PA -29%; -33% NJ), but both New York and New Jersey have experienced relatively healthy unit volume growth thereafter. Pennsylvania, on the other hand, witnessed a good 5-year recovery from 2002-2007, followed by a 14.6% sales loss in 2008 and relatively flat unit sales growth since.
|
|
| Figure 5. State-by-state unit volume growth from 2001 to 2012. |
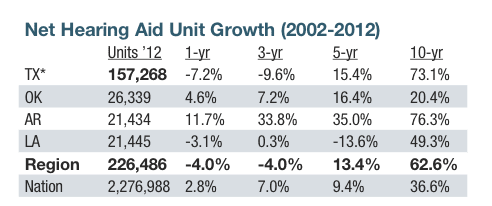
SOUTH CENTRAL (TX, OK, AR, LA)
Texas is the 3rd largest dispensing state, after California and Florida, even though its population makes it the 3rd youngest state (only 10.3% of its people is age 65+). Although in the last 3 years the Lone Star State has witnessed a net unit sales decrease of about 10%, it is the 5th fastest state for hearing aid sales growth during the last 10 years. Oklahoma, Arkansas, and Louisiana were adversely affected by the recession in 2007-08 (-18%, -20%, and -7%, respectively), and so far only Arkansas has fully recovered.
|

|
| Figure 6. State-by-state unit volume growth from 2001 to 2012. *The long dashed line signifies a break in the linear graph for the purpose of including Texas in this graph (Texas is 3 times the values shown here). |
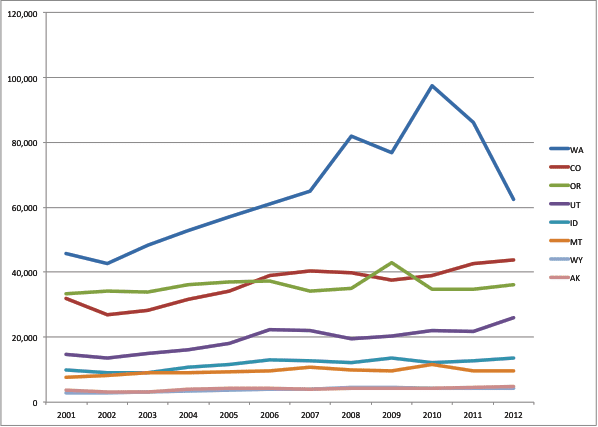
PACIFIC NORTHWEST & MOUNTAIN STATES (WA, OR, CO, ID, UT, MT, WY, AK)
This region (9% of all US sales) has been the 5th fastest growing region for hearing aid sales in the last 10 years, even though Washington has seen its sales plummet by -27% since 2010. All states, except Oregon and Montana, have excellent 10-year unit growth figures, but most also suffered harder from the recession.

|
|
| Figure 7. State-by-state unit volume growth from 2001 to 2012. |
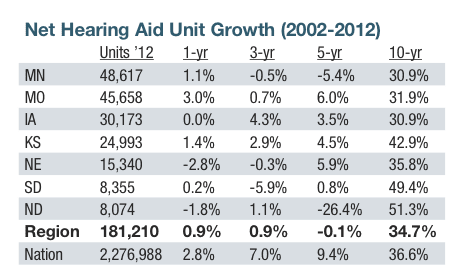
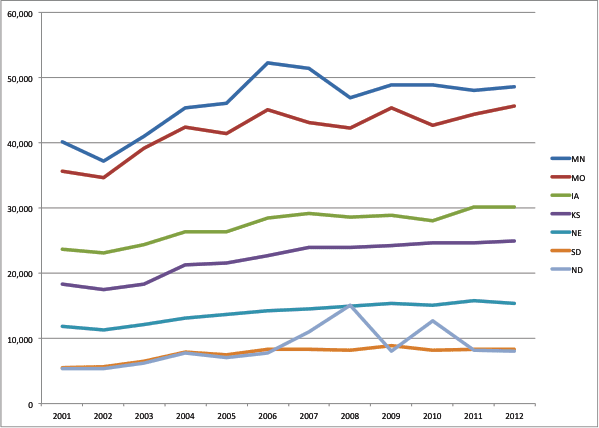
NORTH CENTRAL (MN, ND, SD, IA, NE, KS, MO)
With the exceptions of Kansas and North Dakota, this region has experienced hearing aid unit sales growth below the national average during the last 10 years. Minnesota and North Dakota have yet to recover from unit sales losses during the recession (although it’s likely in the case of North Dakota that this is related to the oil boom and its opportunities).
|
|
| Figure 8. State-by-state unit volume growth from 2001 to 2012. |
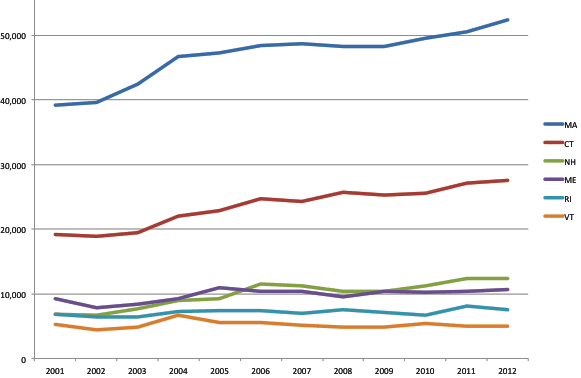
NEW ENGLAND (MA, CT, NH, ME, RI, VT)
New England hearing aid sales have basically reflected the national average. New Hampshire, Connecticut, and Massachusetts experienced strong sales growth from 2002 to 2006, with the former two states enjoying relatively good subsequent growth until cooling off last year. Maine has seen sales that basically mimic the rest of the country while Rhode Island and Vermont’s sales have increased by only 14-16% over the past 10 years.
|
|
| Figure 9. State-by-state unit volume growth from 2001 to 2012. |
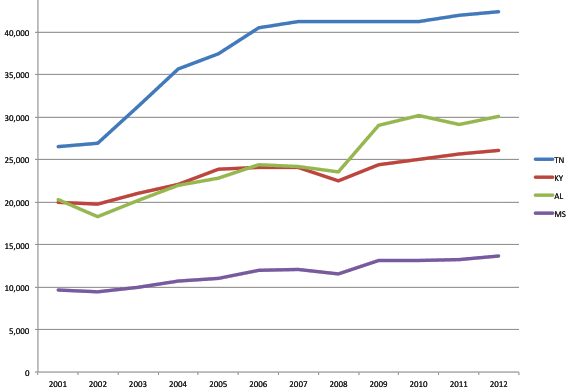
EAST SOUTH CENTRAL (TN, KY, AL, MS)
The East South Central states experienced rapid sales growth from 2002 to 2007, but since then only Alabama has seen impressive unit gains (occurring mostly in 2009), supplanting Kentucky as the region’s second most important dispensing state. All the states in this region, except Kentucky, have strong 10-year sales growth figures compared to the national average. Tennessee, the largest dispensing state in the region, has had relatively flat sales since 2007.
|
|
| Figure 10. State-by-state unit volume growth from 2001 to 2012. |